Journal List > J Korean Rheum Assoc > v.17(4) > 1003755

Jun, Na, Kim, Kim, Park, and Kang: Measurement of Purine Contents in Korean Alcoholic Beverages

Abstract

Objective

Gout is one of the most common forms of inflammatory arthritides among men, which is caused primarily by chronic hyperuricemia. Although pharmacological therapy is the mainstay treatment to manage gout, limiting the consumption of dietary purine is also important. Several epidemiological studies have reported that alcohol consumption is closely related to hyperuricemia and gout. The objective of this study was to determine the purine content in common Korean alcoholic beverages using high performance liquid chromatography (HPLC) to provide a dietary guideline for those with hyperuricemia or gout.

Methods

Thirty-five alcoholic beverages were analyzed. Blindly labeled samples of each alcoholic beverage were degassed and frozen. The sample preparation prior to HPLC followed the methods of Japanese researchers. HPLC was performed to analyze adenine, guanine, hypoxanthine, and xanthine content in the alcoholic beverages.

Results

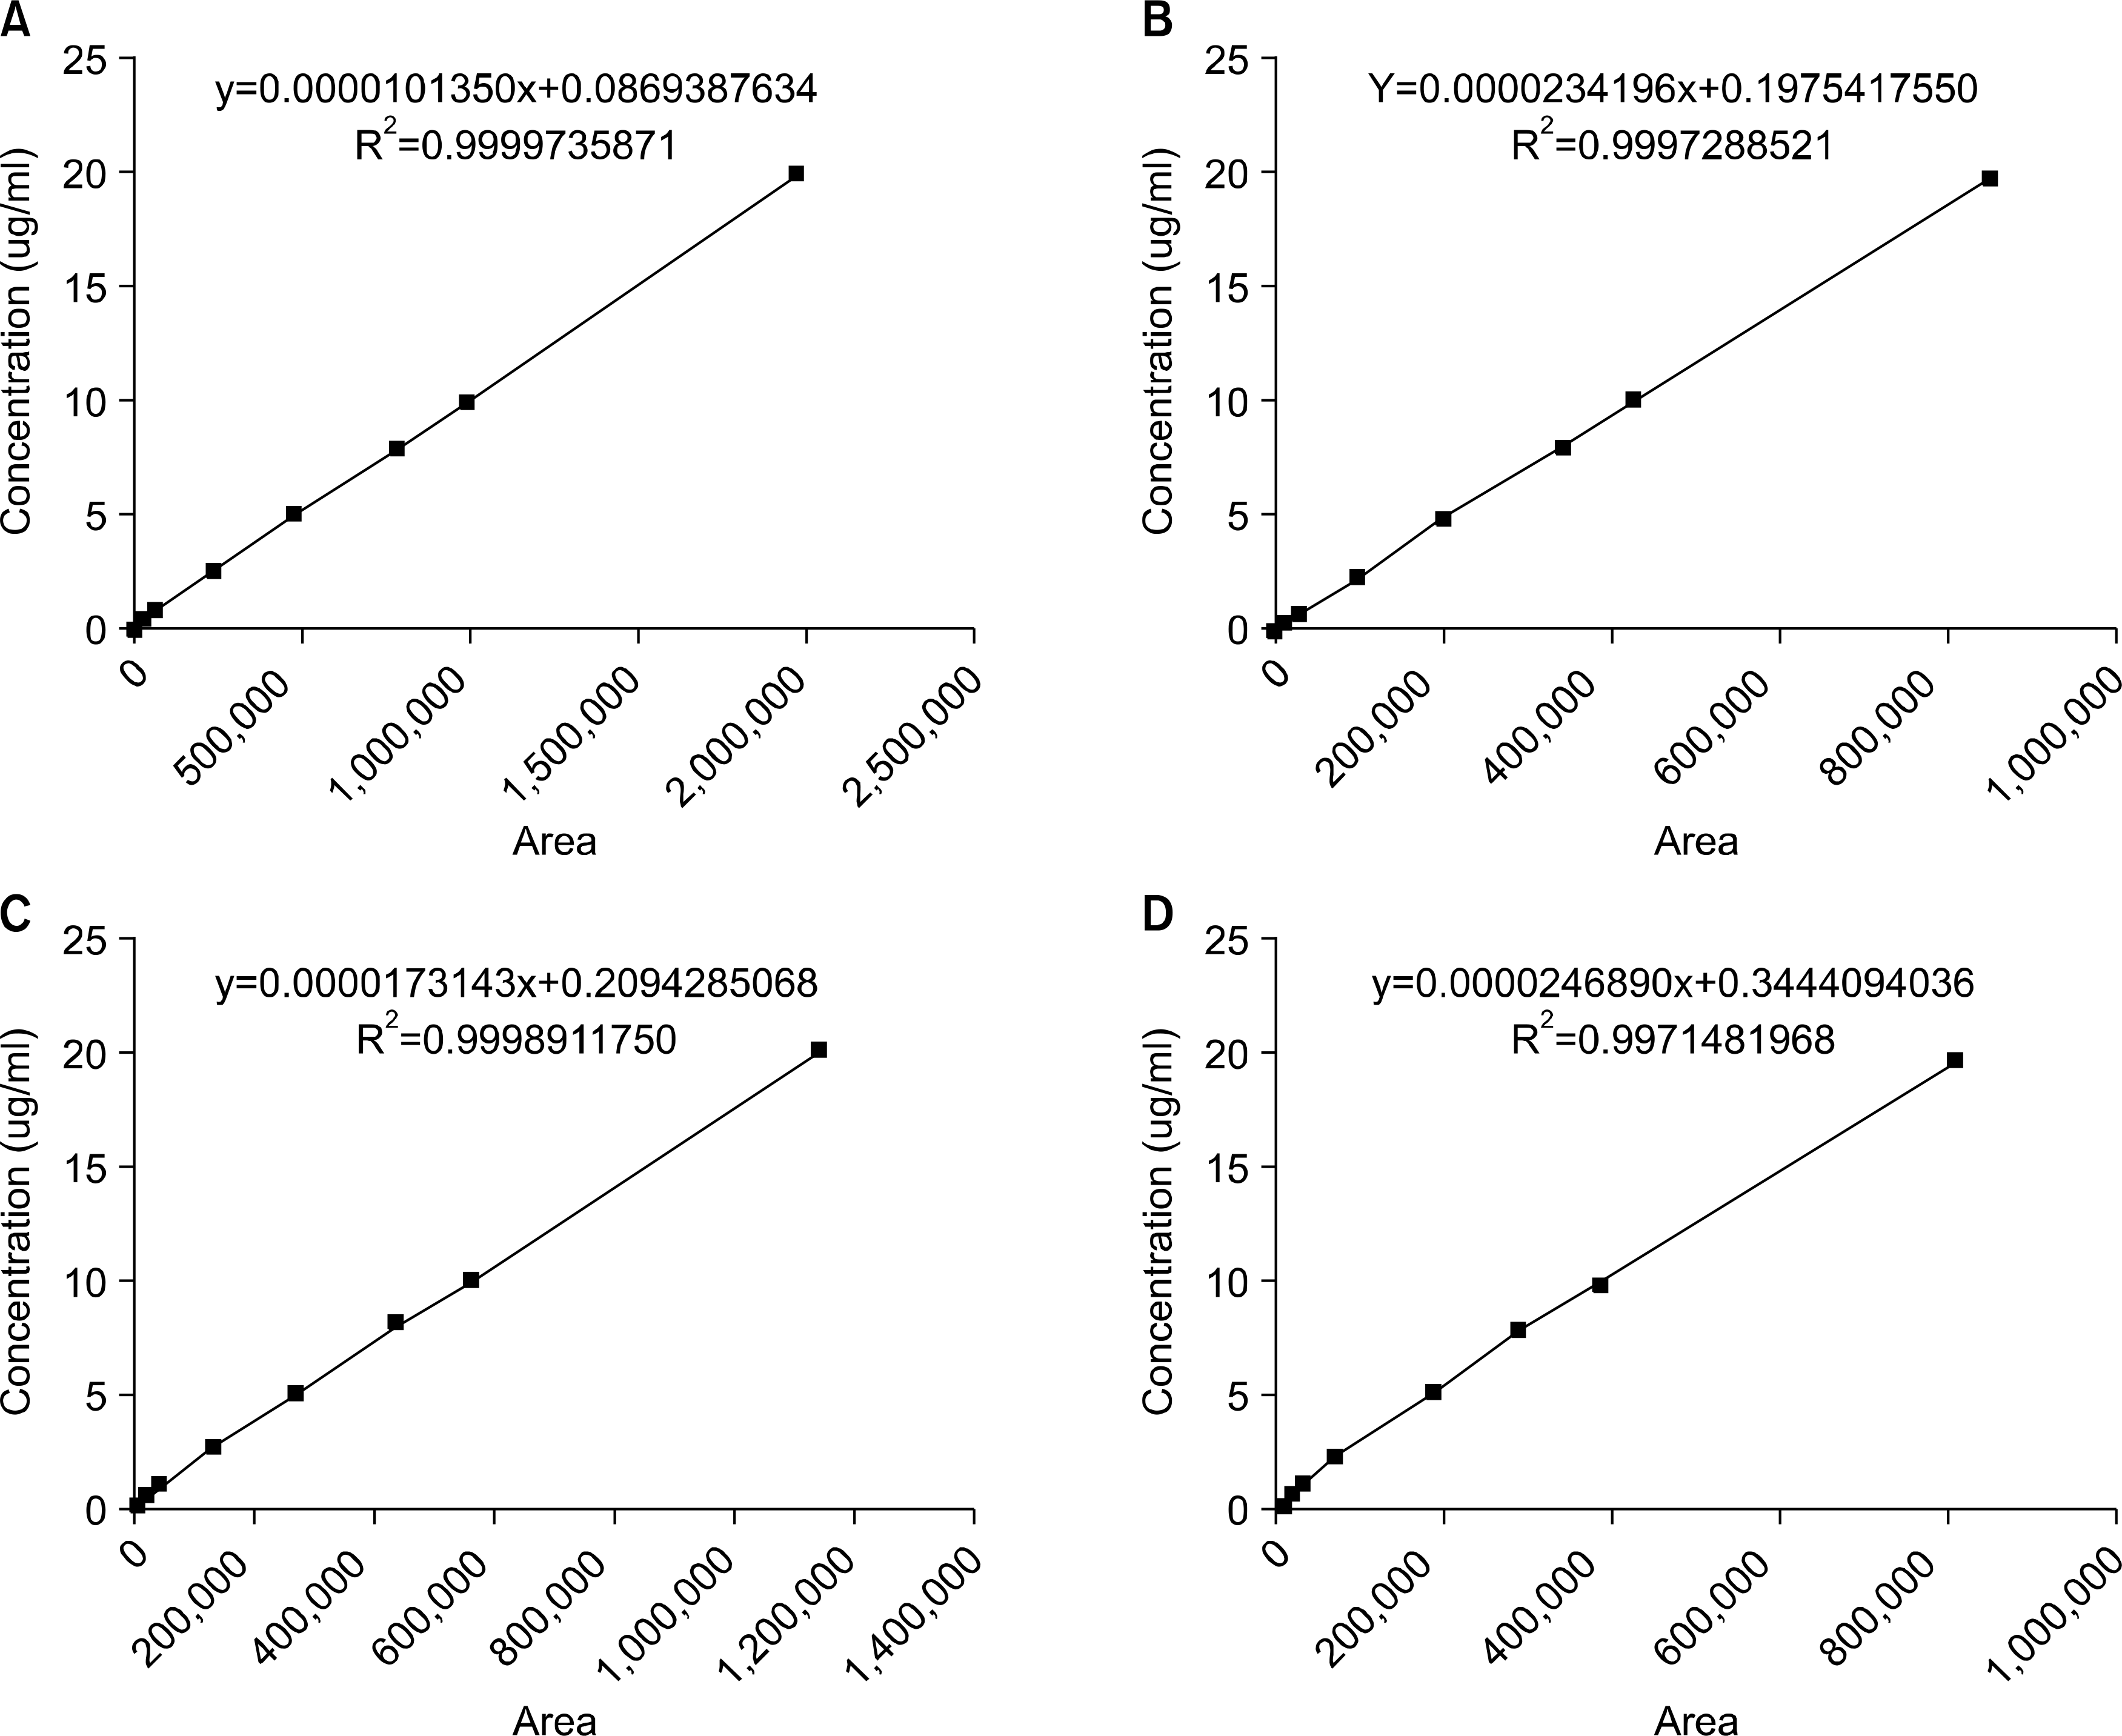
The standard curves were linear for all purines. Purine contents were as follows: beer (42.26~146.39 μmol/L, n=12), medicinal wine (8.2 and 40.41 μmol/L, n=2), rice wine (13.19 μmol/L), Makgeolri (11.71 and 24.72 μmol/L, n=2), red wine (0, 6.03, and 17.9 μmol/L, n=3). No purines were found in fruit wine (n=2), Kaoliang (n=1), white wine (n=1), or distilled alcoholic beverages, such as soju (n=10) or whiskey (n=1).

Conclusion

Among popular Korean alcoholic beverages, beer contained a considerable amount of purines, whereas distilled alcoholic beverages did not. Patients with either gout or hyperuricemia should avoid alcoholic beverages, especially those containing large amounts of purines.

REFERENCES

1). Richette P., Bardin T. Gout. Lancet. 2010. 375:318–28.
crossref
2). Saag KG., Choi H. Epidemiology, risk factors, and lifestyle modifications for gout. Arthritis Res Ther. 2006. ;8 (Suppl 1): S2.
3). Bieber JD., Terkeltaub RA. Gout: on the brink of novel therapeutic options for an ancient disease. Arthritis Rheum. 2004. 50:2400–14.
crossref
4). Neogi T., Hunter DJ., Chaisson CE., Allensworth-Davies D., Zhang Y. Frequency and predictors of inappropriate management of recurrent gout attacks in a longitudinal study. J Rheumatol. 2006. 33:104–9.
5). Zhang W., Doherty M., Bardin T., Pascual E., Barskova V., Conaghan P, et al. EULAR evidence based recommendations for gout. Part II: management. Report of a task force of the EULAR Standing Committee for International Clinical Studies Including Therapeutics (ESCISIT). Ann Rheum Dis. 2006. 65:1312–24.
crossref
6). Lieber CS., Jones DP., Losowsky MS., Davidson CS. Interrelation of uric acid and ethanol metabolism in man. J Clin Invest. 1962. 41:1863–70.
crossref
7). Lieber CS. Hyperuricemia induced by alcohol. Arthritis Rheum. 1965. 8:786–98.
crossref
8). Choi HK., Atkinson K., Karlson EW., Willett W., Curhan G. Alcohol intake and risk of incident gout in men: a prospective study. Lancet. 2004. 363:1277–81.
crossref
9). Kaneko K., Yamamobe T., Fujimori S. Determination of purine contents of alcoholic beverages using high performance liquid chromatography. Biomed Chromatogr. 2009. 23:858–64.
crossref
10). Makkar HP., Becker K. Purine quantification in digesta from ruminants by spectrophotometric and HPLC methods. Br J Nutr. 1999. 81:107–12.
crossref
11). Puig JG., Fox IH. Ethanol-induced activation of adenine nucleotide turnover. Evidence for a role of acetate. J Clin Invest. 1984. 74:936–41.
crossref
12). Yamamoto T., Moriwaki Y., Takahashi S., Suda M., Higashino K. Effect of ethanol ingestion on nucleotides and glycolytic intermediates in erythrocytes and purine bases in plasma and urine: acetaldehydeinduced erythrocyte purine degradation. Metabolism. 1993. 42:1212–6.
crossref
13). Yamamoto T., Moriwaki Y., Takahashi S. Effect of ethanol on metabolism of purine bases (hypoxanthine, xanthine, and uric acid). Clin Chim Acta. 2005. 356:35–57.
crossref
14). Inokuchi T., Ka T., Yamamoto A., Moriwaki Y., Takahashi S., Tsutsumi Z, et al. Effect of ethanol on mono-sodium urate crystal-induced inflammation. Cytokine. 2008. 42:198–204.
15). Szabo G. Alcohol's contribution to compromised immunity. Alcohol Health Res World. 1997. 21:30–41.
16). Arbabi S., Garcia I., Bauer GJ., Maier RV. Alcohol (ethanol) inhibits IL-8 and TNF: role of the p38 pathway. J Immunol. 1999. 162:7441–5.
17). Gibson T., Rodgers AV., Simmonds HA., Toseland P. Beer drinking and its effect on uric acid. Br J Rheumatol. 1984. 23:203–9.
crossref
18). Gibson T., Rodgers AV., Simmonds HA., Court-Brown F., Todd E., Meilton V. A controlled study of diet in patients with gout. Ann Rheum Dis. 1983. 42:123–7.
crossref
19). Committee for the Preparation of Guidelines for the Management of Hyperuricemia and Gout.Lifestyle Guidance. Guidelines for the Management of Hyperuricemia and Gout. Tokyo, Japanese Society of Gout and Nucleic Acid Metabolism. 2002.
20). Choi HK., Curhan G. Beer, liquor, and wine consumption and serum uric acid level: the Third National Health and Nutrition Examination Survey. Arthritis Rheum. 2004. 51:1023–9.
crossref
21). Maxwell S., Cruickshank A., Thorpe G. Red wine and antioxidant activity in serum. Lancet. 1994. 344:193–4.
crossref

Fig. 1.
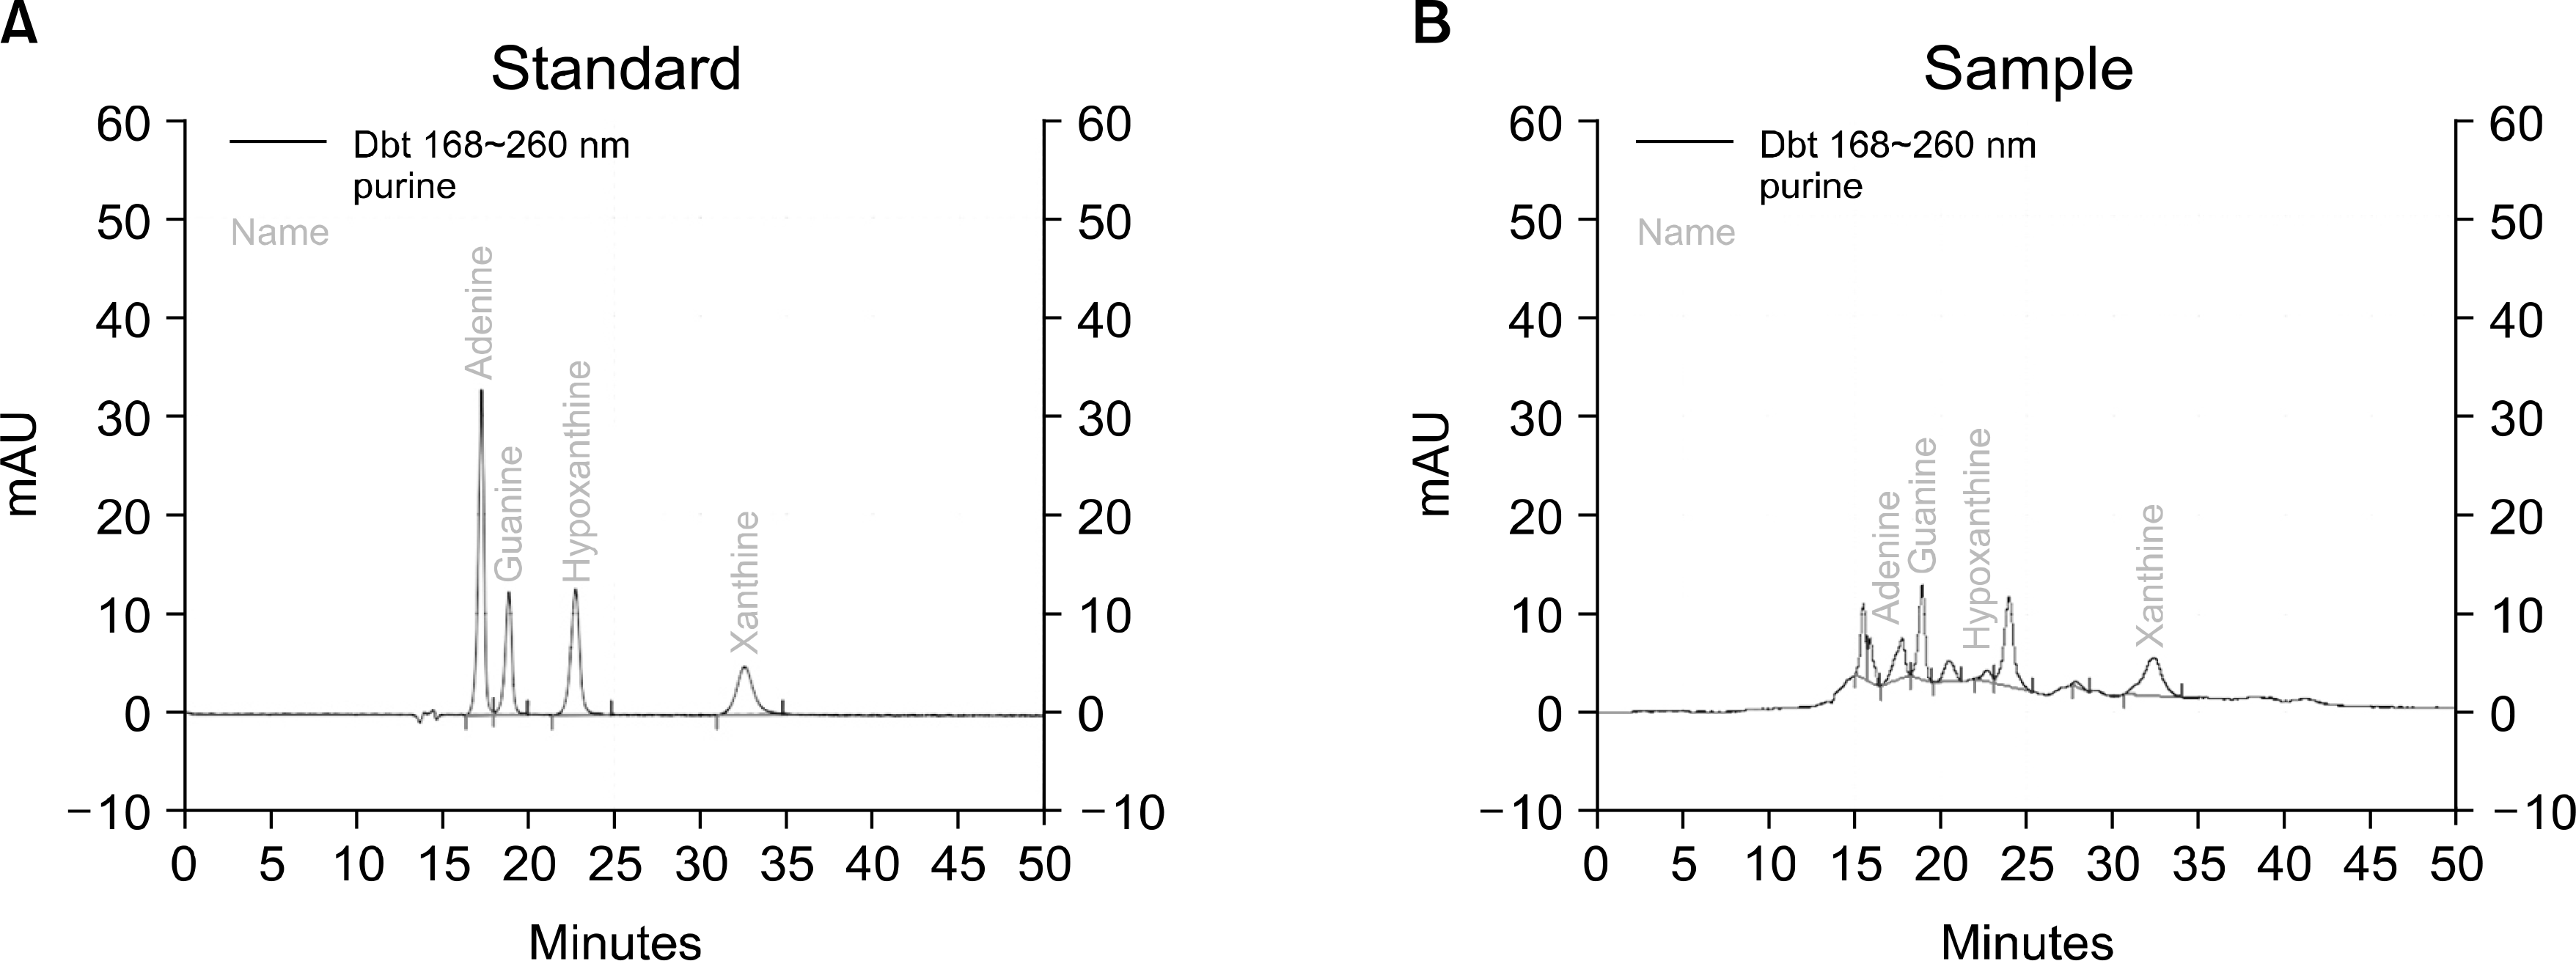
Chromatogram of standard purine bases and a sample.
jkra-17-368f1.tif
Fig. 2.
Standard curves for for purine bases. (A) Adenine, (B) Guanine, (C) Hypoxanthine, (D) Xanthine.
jkra-17-368f2.tif
Table 1.
High performance liquid chromatography (HPLC) conditions
1. HPLC apparatus (PDA-HPLC)
Pump Binary Pump 126 (Beckman Coulter Co., Fullerton, USA)
Sampler Autoinjector (Beckman Coulter Co., Fullerton, USA)
Column 5mm i.d.×300 mm length (Shodex Asahipak HQ-310, Shoko America, Inc. Japan)
Column oven Photodiode Array detector 168 (Beckman Coulter Co., Fullerton, USA)
Detector Karat 32 (Beckman Coulter Co., Fullerton, USA)
Software VS-6000CFI (Vision Scientific Co., Ltd., Korea)
Centrifuge KMC-1300V (Vision Scientific Co., Ltd., Korea)
Vortex-mixer Sartorius AC2115 (Sartorious Mechatronics, Ltd., Germany)
Balance Model 420 A+ (Thermo Scientific Inc. USA)
pH meter PC-420 (Corning Co., USA)
Stirrer & hot plate SH-3600 (Saehan Ultrasonic Co., Korea)
Sonicator Binary Pump 126 (Beckman Coulter Co., Fullerton, USA)
2. Mobile phase
Sodium phosphate Monobasic Anhydrous 98% (Yakuri Pure Chemicals Co., Ltd., Japan)
Purelab Classic triple distilled water (ELGA, UK)
O-Phosphoric acid 85% (Sigma-Aldrich Co., Ltd., USA)
Perchloric acid 70% (Junsei Chemical Co., Ltd., Japan)
Potassium Hydroxide 95% (Samchun Pure Chemical Co., Ltd., Korea)
Standard Adenine 99% (Sigma-Aldrich Co., Ltd., USA)
Guanine hydrochloride (Sigma-Aldrich Co., Ltd., USA)
hypoxanthine 99% (Sigma-Aldrich Co., Ltd., USA)
Xanthine sodium salt 99% (Sigma-Aldrich Co., Ltd., USA)
3. Experimental conditions
Mobile phase 150 mM Sodium Phosphate buffer (pH : 2.5)
Apparatus Flow Rate: 0.6 mL/min
UV Wavelength: 260 nm
Column oven: 35.0°C
Column: Shodex Asahipak HQ-310
Table 2.
Accuracy and precision of the purine base standards
1. Adenine
Standard (μg/mL) Adenine (μg/mL) Average SD Precision (% CV) Accuracy (% RE)
1 2 3
20 20.89 22.02 21.99 21.63 0.65 2.98 108.17
10 10.35 10.75 10.57 10.55 0.20 1.89 105.53
8 8.46 8.81 9.29 8.85 0.42 4.69 110.68
5 5.48 5.77 5.86 5.70 0.20 3.51 114.04
2.5 2.78 2.88 2.88 2.84 0.06 2.02 113.76
1 1.19 1.24 1.22 1.21 0.02 1.97 121.49
0.5 0.63 0.63 0.64 0.63 0.01 1.06 126.40
0.25 0.37 0.38 0.36 0.37 0.01 2.31 147.98
2. Guanine
Standard (μg/mL) Guanine (μg/mL) Average SD Precision (% CV) Accuracy (% RE)
1 2 3
20 21.42 22.45 22.51 22.13 0.61 2.76 110.63
10 10.65 11.02 10.86 10.84 0.18 1.68 108.44
8 8.72 9.07 9.21 9.00 0.26 2.84 112.49
5 5.76 6.03 6.47 6.09 0.36 5.93 121.74
2.5 3.03 3.09 3.14 3.09 0.05 1.73 123.44
1 1.34 1.36 1.39 1.36 0.03 2.03 136.27
0.5 0.82 0.87 0.80 0.83 0.04 4.57 166.60
0.25 0.55 0.55 0.54 0.55 0.01 1.14 218.91
3. Hypoxanthine
Standard (μg/mL) Hypoxanthine (μg/mL) Average SD Precision (% CV) Accuracy (% RE)
1 2 3
20 21.63 22.73 22.82 22.39 0.67 2.98 111.97
10 10.82 11.35 10.94 11.04 0.28 2.51 110.37
8 8.78 9.17 9.14 9.03 0.22 2.44 112.87
5 5.78 6.01 6.11 5.97 0.17 2.87 119.34
2.5 3.03 3.14 3.19 3.12 0.08 2.59 124.67
1 1.29 1.38 1.36 1.34 0.04 3.31 134.47
0.5 0.85 0.95 0.85 0.89 0.06 6.61 177.16
0.25 0.53 0.55 0.67 0.58 0.08 12.98 233.50
4. Xanthine
Standard (μg/mL) Xanthine (μg/mL) Average SD Precision (% CV) Accuracy (% RE)
1 2 3
20 23.42 24.56 24.54 24.18 0.65 2.70 120.88
10 11.65 12.22 11.86 11.91 0.29 2.44 119.11
8 9.51 9.87 9.76 9.71 0.18 1.87 121.41
5 6.11 6.81 6.55 6.49 0.35 5.45 129.87
2.5 3.14 3.36 3.54 3.35 0.20 5.89 133.89
1 1.75 1.63 1.61 1.66 0.07 4.32 166.33
0.5 0.91 1.07 0.92 0.97 0.09 9.58 193.22
0.25 0.65 0.59 0.81 0.68 0.11 16.34 273.94

SD, standard deviation; CV, coefficients of variation; RE, relative error

Table 3.
Purine contents (μmol/L) of co mmon Kor ean alcoholic beverages
Category No. Adeni ne Guani ne Hypoxanthine Xanthine Total
Beer Local 1 11.25 26.44 3.09 31.99 72.77
Local 2 11.03 29.53 2.2 38.43 81.19
Local 3 13.32 31.24 6.39 45.09 96.04
Local 4 10.43 12.53 0 19.3 42.26
Local 5 15.84 48.94 3.01 28.03 95.82
Imported 6 19.76 85.67 13.96 27 146.39
Imported 7 10.51 20.74 2.35 10.05 43.65
Imported 8 16.87 30.6 2.28 12.12 61.87
Imported 9 10.29 16.1 2.64 20.28 49.31
Imported 10 29.16 58 4.11 28.32 119.59
Imported 11 16.87 26.33 4.56 25.85 73.61
Imported 12 9.77 10.71 3.09 29.75 53.32
Soju 1 0 0 0 0 0
2 0 0 0 0 0
3 0 0 0 0 0
4 0 0 0 0 0
5 0 0 0 0 0
6 0 0 0 0 0
7 0 0 0 0 0
8 0 0 0 0 0
9 0 0 0 0 0
10 0 0 0 0 0
Medicinal wine 1 0 2.03 6.17 0 8.2
2 3.4 12.9 7.57 16.54 40.41
Makgeolri 1 6.96 13.06 4.7 0 24.72
2 1.85 1.92 2.2 5.74 11.71
Fruit wine 1 0 0 0 0 0
2 0 0 0 0 0
Kaoliang 0 0 0 0 0
Whisky 0 0 0 0 0
Wine Red 1 0 0 0 6.03 6.03
Red 2 0 0 0 0 0
Red 3 2.29 4.58 0 11.03 17.9
White 4 0 0 0 0 0
Rice wine 2.07 2.67 8.45 0 13.19
TOOLS
Similar articles