Journal List > J Korean Endocr Soc > v.23(6) > 1003466

Kwon, An, Kang, Son, Kim, and Kim: Alanine Aminotransferase as a Predictor of Metabolic Syndrome in Koreans

Abstract

Aims

Alanine aminotransferase (ALT) is associated with insulin resistance, and is independent of the general metabolic measures. Gamma-glutamyltransferase (GGT) is regarded as a predictor of diabetes mellitus. We analyzed which of ALT or GGT is better tool to preestimate the development of metabolic syndrome.

Method

A total of 1203 Koreans who visited the Institute of Health in Pusan National University Hospital from January 2005 to August 2006 were enrolled in this cross-sectional study. Their median age was 51 years old, and the prevalence of metabolic syndrome was 16.4% (n = 197). We excluded the subjects with diabetes mellitus, hypertension and viral hepatitis or those subjects with a level of alanine aminotransferase (ALT) or gamma-glutamyltransferase (r-GGT) > 80 IU/L.

Results

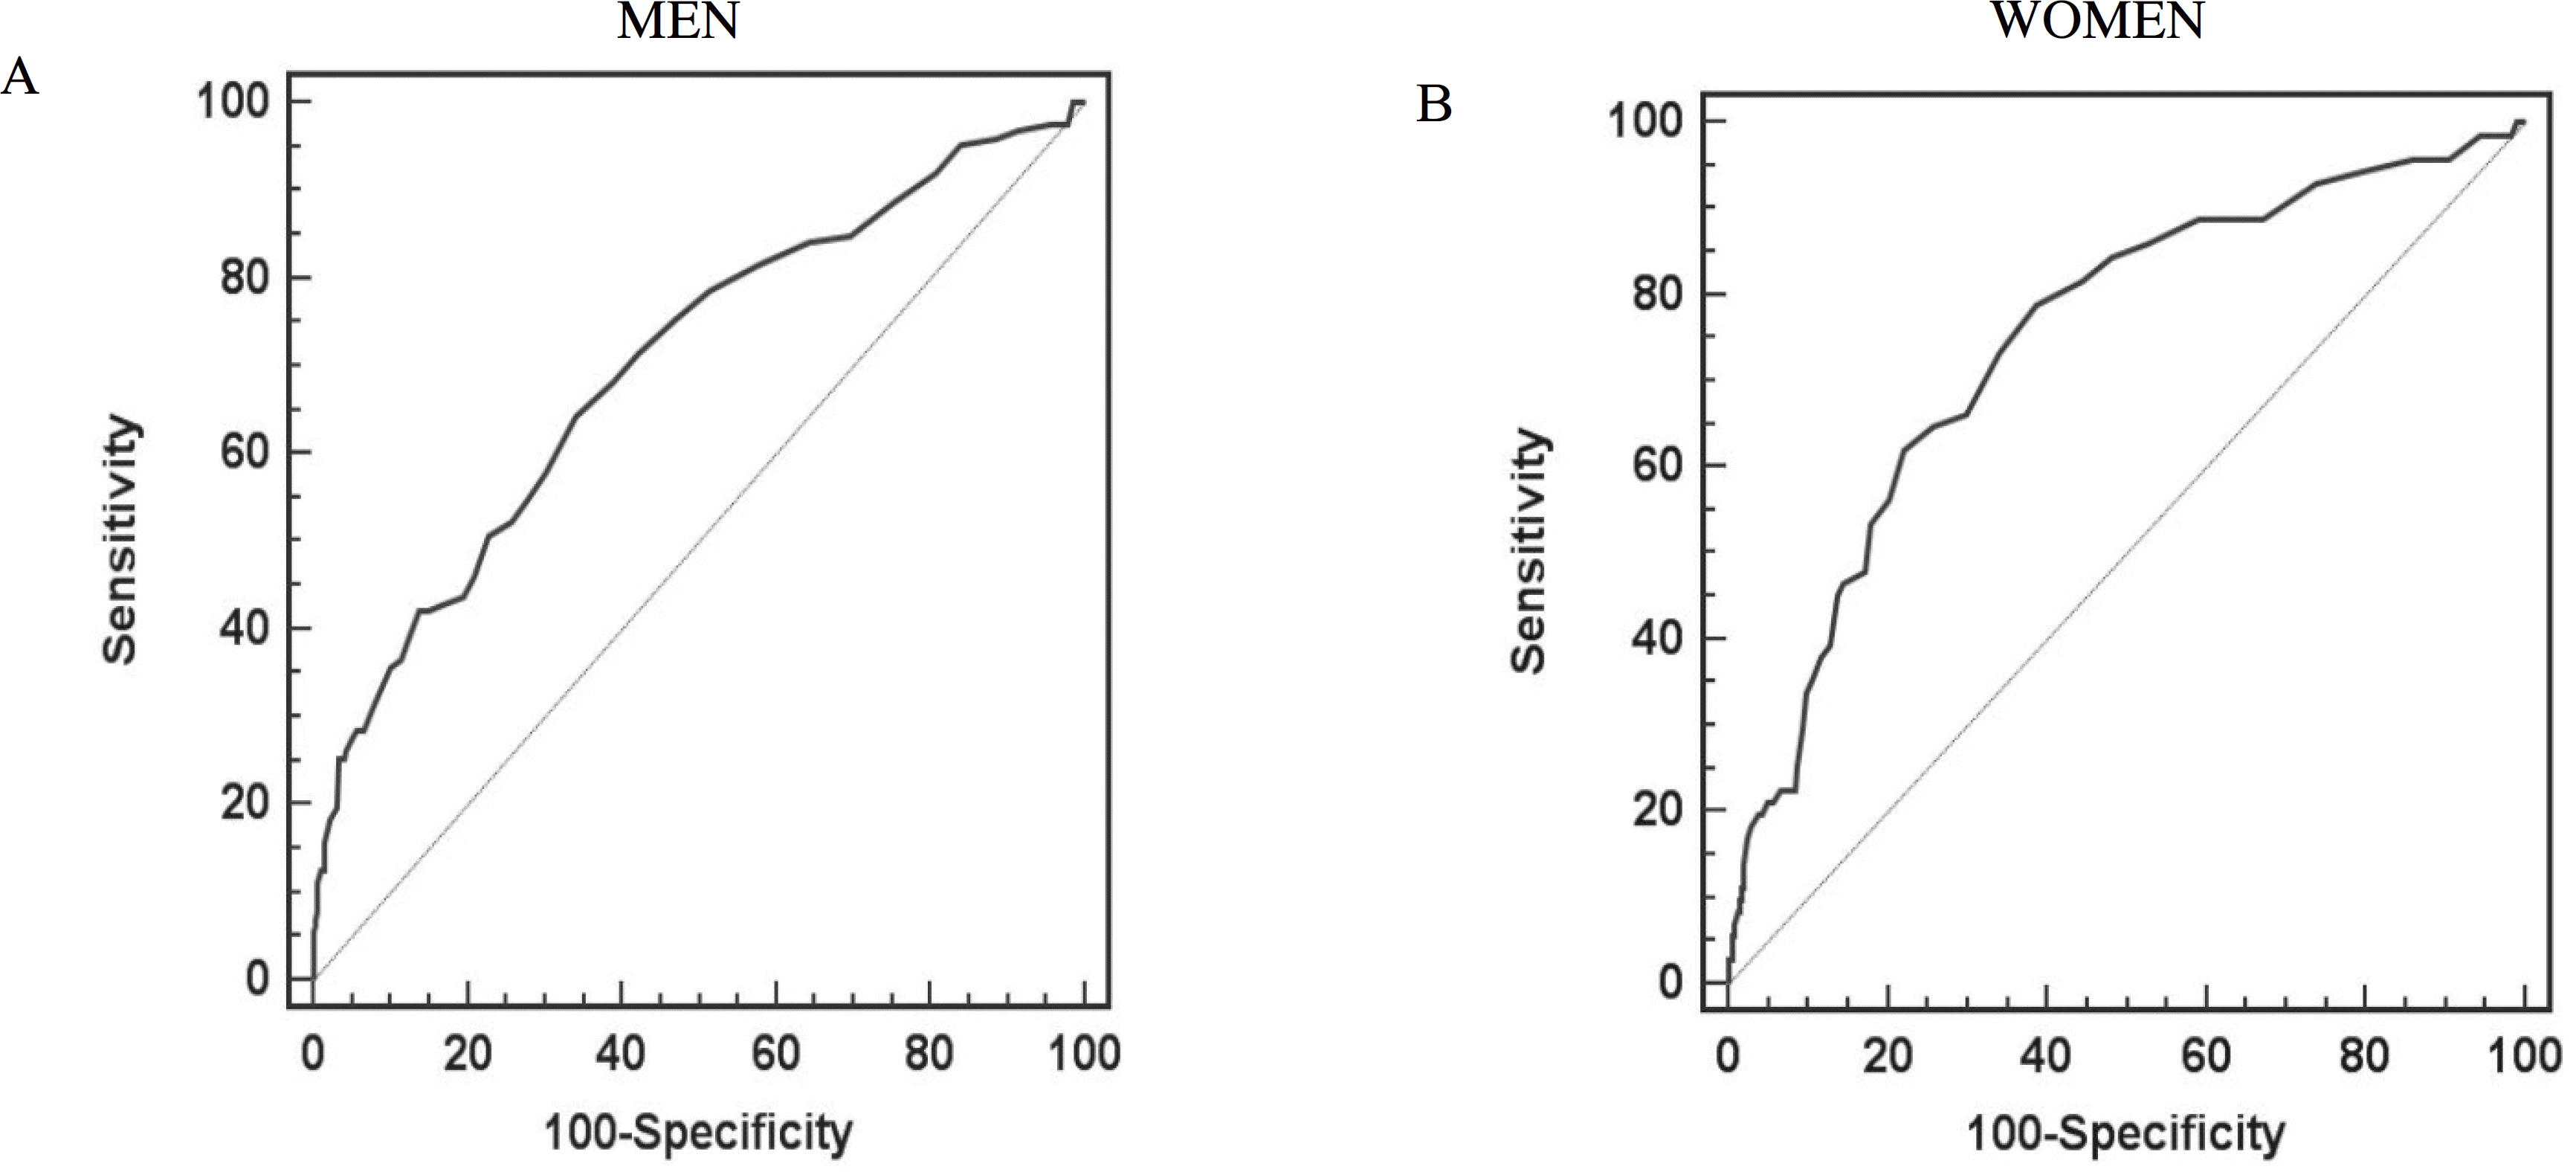
For all the patients in the metabolic syndrome group, the median homeostatic assessment of insulin resistance (HOMA-IR), the waist circumference, the fasting blood glucose level, the systolic and diastolic blood pressure were all associated with the ALT level (P < 0.05). For the nonmetabolic syndrome group, all the metabolic risk factors were associated with the ALT level (P < 0.05). On logistic regression analysis, after correction for age, alcohol intake, HOMA-IR and body mass index, the logALT maintained a highly predictive value for metabolic syndrome, and this was better than the logGGT [odds ratio (OR) of logALT: 18.489, odds ratio of logGGT: 2.024] (P < 0.001). The risk of developing metabolic syndrome was significantly higher in the above 50 percentile and the above 75 percentile of ALT than in the lowest quartile. [for men – OR: 3.6; 95% confidence interval (CI), 2.2–5.9; OR: 6.9; 95% CI: 4.3–10.9] [for women – OR: 2.7; 95% CI: 1.5–4.7; OR: 6.5; 95% CI: 3.8–11] (P < 0.001). The cut-off value of ALT by the ROC curve was 24 IU/L for men (sensitivity: 64.3%, specificity: 66%, negative predictive value: 99.5%) and 20 IU/L for women (sensitivity: 78.9%, specificity: 61.4%, negative predictive value: 84.9%).

Conclusions

Even although patients can have an ALT level that's included within the upper normal level, we may consider the probability that these patients will have metabolic syndrome. Furthermore, in our analysis, the ALT level is a better predictor of metabolic syndrome than the GGT level.

References

1. Hanley AJ, Williams K, Festa A, Wagenknecht LE, D'Agostino RB Jr, Haffner SM. Liver markers and development of the metabolic syndrome: the insulin resistance atherosclerosis study. Diabetes. 54:3140–3147. 2005.
2. Mulhall BP, Ong JP, Younossi ZM. Non-alcoholic fatty liver disease: an overview. J Gastroenterol Hepatol. 17:1136–1143. 2002.
crossref
3. Angulo P, Lindor KD. Non-alcoholic fatty liver disease. J Gastroenterol Hepatol 17 (suppl): S186-S190,. 2002.
4. Clark JM, Brancati FL, Diehl AM. The prevalence and etiology of elevated aminotransferase levels in the United States. Am J Gastroenterol. 98:960–967. 2003.
crossref
5. Sattar N, Scherbakova O, Ford I, O'Reilly DS, Stanley A, Forrest E, Macfarlane PW, Packard CJ, Cobbe SM, Shepherd J. Elevated alanine aminotranferase predicts new-onset type 2 diabetes independently of classical risk factors, metabolic syndrome, and C-reactive protein in the West of Scotland Coronary Prevaention Study. Diabetes. 53:2855–2860. 2004.
6. Nakanishi N, Suzuke K, Tatara K. Serum r-glutamyltransferase and risk of metabolic syndrome and type 2 diabetes in middle-aged Japanese men. Diabetes Care. 27:1427–1432. 2004.
7. Cho NH, Lee HK, Jang HC, Chan JCN, Choi SH, Lim S, Kim HR. Abnormal liver function test predicts type 2 diabetes. Diabetes Care. 30:2566–2568. 2007.
crossref
8. Lee DH, Steffes MW, Jacobs DR Jr. Can persistent organic pollutants explain the association between serum gamma-glutamyltransferase and type 2 diabetes? Diabetologia. 51:402–407. 2008.
9. Matthews DR, Hosker JP, Rudenski AS, Naylor BA, Treacher DF, Turner RC. Homeostatic model assessment: insulin resistance and b-cell function from fasting plasma glucose and insulin concentration in man. Diabetologia. 28:412–419. 1985.
10. Executive Summary of the Third Report of the National Cholesterol Education Program (NCEP) Expert Panel on Detection, Evaluation, and Treatment of High Blood Cholesterol in Adults (Adult Treatment Panel III). JAMA. 285:2486–2496. 2001.
11. Chung HW, Kim DJ, Jin HD, Choi SH, Ahn CW, Cha BS, Lee HC, Huh KB. Prevalence of metabolic syndrome according to the new criteria for obesity. J Kor Diabetes Assoc. 26:431–442. 2002.
12. Laaksonen DE, Lakka HM, Salonen JT, Niskanen LK, Rauramaa R, Lakka TA. Low levels of leisure-time physical activity and cardiorespiratory fitness predict development of the metabolic syndrome. Diabetes Care. 25:1612–1628. 2002.
crossref
13. Choi KM, Lee J, Lee KW, Seo JA, Oh JH, Kim SG, Kim NH, Choi DS, Baik SH. Serum adiponectin concentrations predict the developments of type 2 diabetes and the metabolic syndrome in elderly Koreans. Clin Endocrinol. 61:75–80. 2004.
crossref
14. Han TS, Sattar N, Williams K, Gonzalez-Villalpando C, Lean ME, Haffner SM. Prospective study of C-reactive protein in relation to the development of diabetes and metabolic syndrome in the Mexico City Diabetes Study. Diabetes Care. 25:2016–2021. 2002.
crossref
15. Wannamethee SG, Shaper AG, Lennon L, Whincup PH. Hepatic enzyme, the metabolic syndrome, and the risk of type 2 diabetes in older men. Diabetes Care. 28:2913–2918. 2005.
16. Andre P, Balkan B, Vol S, Charles MA. Eschweqe E DESIR study group. Gamma-glutamyltransferase activity and development of the metabolic syndrome (International Diabetes Federation Definition) in middle-aged man and women, data from the Epidemiological Study on the Insulin Resistance Syndrome(DESIR) cohort. Diabetes Care. 30:2355–2361. 2007.
17. Marchesini G, Brisi M, Bianchi G, Tomassetti S, Bugianesi E, Lenzi M, McCullough AJ, Natale S, Forlani G, Melchionda N. Nonalcoholic fatty liver disease: Nonalcoholic fatty liver disease: a feature of the metabolic syndrome. Diabetes. 50:1844–1850. 2001.
18. Marchesini G, Bugianesi E, Forlani G, Cerrelli F, Lenzi M, Manini R, Natale S, Vanni E, Villanova N, Rizzetto M. Nonalcoholic fatty liver, steatohepatitis, and the metabolic syndrome. Hepatology. 37:917–923. 2003.
19. Liangpunsakul S, Chalasani N. Unexplained elevations in alanine aminotransferase in individuals with the metabolic syndrome: results from the third National Health and Nutrition Survey (NHANES III). Am J Med Sci. 329:111–116. 2005.
crossref
20. Browning JD, Szezepaniak LS, Dobbins R, Nuremberg P, Horton JD, Cohen JC, Grundy SM, Hobbs HH. Prevalence of hepatic steatosis in an urban population in the United States: impact of ethnicity. Hepatology. 40:1387–1395. 2004.
crossref
21. Seppala-Lindroos A, Vehkavaara S, Hakkinen AM, Goto T, Westerbacka J, Sovijarvi A, Halavaara J, Yki-Jarvinen H. Fat accumulation in the liver is associated with defects in insulin suppression of glucose production and serum free fatty acids independent of obesity in normal men. J Clin Endocrinol Metab. 87:3023–3028. 2002.
crossref
22. Tiikkainen M, Bergholm R, Vehkavaara S, Rissanen A, Hakkinen AM, Tamminen M, Teramo K, Yki-Jarvinen H. Effects of identical weight loss on body composition and features of insulin resistance in obese women with high and low liver fat content. Diabetes. 52:701–707. 2003.
crossref
23. Pratt DS, Kaplan MM. Evaluation of abnormal liver-enzyme results in asymptomatic patients. N Engl J Med. 342:1266–1271. 2000.
crossref

Fig. 1–1.
Cut-off value of ALT according to sex (A: men, B: women) to preestimate the incidence of metabolic syndrome. A. MEN The cut-off value of ALT about metabolic syndrome is above 24 IU/L. The sensitivity is 64.29% (95% confidence interval 55.3∼72.6%) and the specificity is 66% (61.7∼70.1%). The negative predictive value is 99.5% and AUC (area under the ROC curve) is 0.701 (95% confidence interval 0.664∼0.737) (P = 0.0001). B. WOMEN The cut-off value of ALT about metabolic syndrome is above 20 IU/L. The sensitivity is 78.87% (95% confidence interval 67.6∼87.7%) and the specificity is 61.43% (57∼65.7%). The negative predictive value is 84.9% and AUC is 0.747 (0.709∼0.782) (P = 0.0001).
jkes-23-404f1.tif
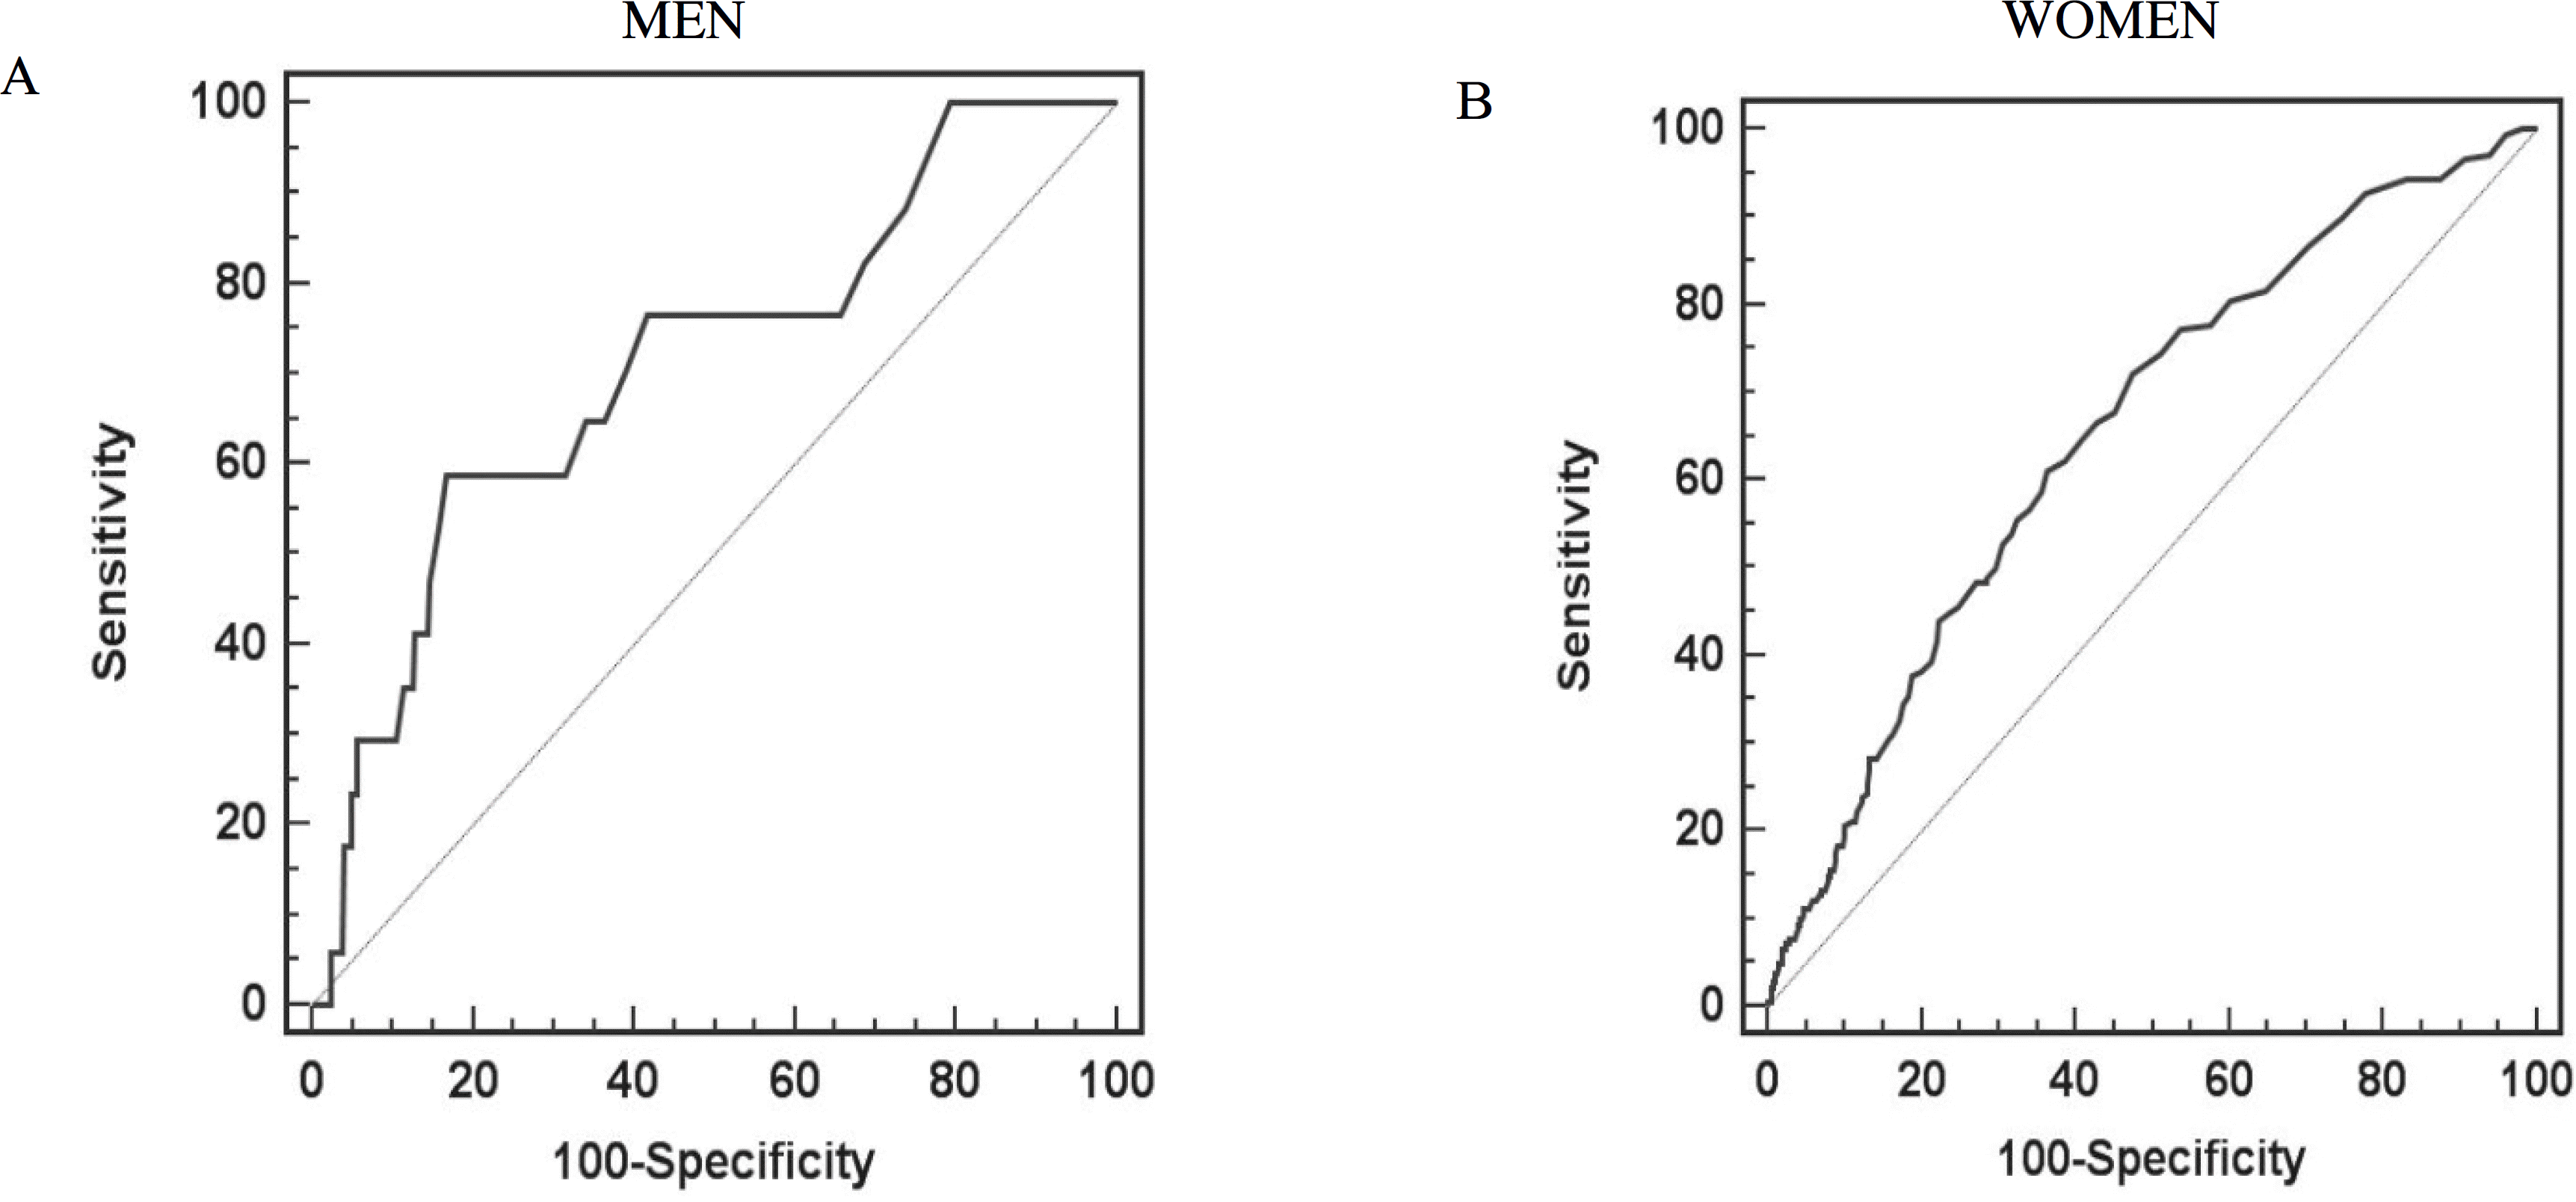
Fig. 1–2.
Cut-off value of GGT according to sex (A: men, B: women) to preestimate the incidence of metabolic syndrome. A. MEN The cut-off value of GGT about metabolic syndrome is above 36 IU/L. The sensitivity is 58.82% (95% confidence interval 33∼81.5%) and the specificity is 83.3% (80.1∼86.2%). The negative predictive value is 98.6% and AUC (area under the ROC curve) is 0.71 (95% confidence interval 0.673∼0.745) (P = 0.0033). B. WOMEN The cut-off value of GGT about metabolic syndrome is above 26 IU/L. The sensitivity is 61.11% (95% confidence interval 53.6∼68.3%) and the specificity is 63.71% (58.7∼68.5%). The negative predictive value is 78.2% and AUC is 0.655 (0.614∼0.694) (P = 0.0001).
jkes-23-404f2.tif
Table 1–1.
Characteristics of subjects according to the presence of metabolic syndrome
  Total Metabolic syndrome Nonmetabolic syndrome
  (n = 1203) (n = 197) (n = 1,006)
Age (years) 51.28 ±9.3 54.9 ±8.9 50.6 ±9.2
Smoking (1 or 2) N = 438 N = 86 N = 352
  (36.4% of total) (43.65% among smoker)* (56.35%)
Alcohol (1 or 2) N = 555 N = 114 N = 441 (42.13%)
  (46.13% of total) (57.87% among alcohol drinker)  
SBP (mmHg) 123.77 ±18.58 142.08 ±14.39* 120.19 ±17.15
DBP (mmHg) 76.41 ±11.66 86.82 ± 9.03 74.37 ±11.02
ALT (IU/L) 23.63 ±11.61 32.47 ±15.49* 21.9 ±9.81
AST (IU/L) 24.21 ±7.14 27.37 ±8.63* 23.59 ±6.64
GGT (IU/L) 30.92 ±31.84 44.69 ±36.3* 28.23 ±30.2
HOMA-IR 1.24 ±0.97 1.83 ±1.31* 1.13 ±0.84
BMI (kg/m2) 24.14 ±2.84 25.5 ±2.9 23.88 ±2.75
Waist (cm) 83.05 ±8.76 90.33 ±6.84* 81.62 ±8.38
TG (mg/dL) 124.26 ±90.41 188.46 ±105.58* 111.7 ±81.5
HDL-C (mg/dL) 54.7 ±13.1 46.2 ±10.78* 56.37 ±12.87
FBS (mg/dL) 92.61 ±19.57 106.62 ±26.98* 89.9 ±16.4

Data are means ±SD. Smoking (0: no smoking history, 1: previous smoking, 2: current smoking); Alcohol (0: no alcohol, 1: 1∼2 times/week, 2: ≥ 3 times/week); ALT, alanine aminotransferase; AST, aspartate aminotransferase; BMI, body mass index; DBP, diastolic blood pressure; FBS, fasting blood sugar; GGT, r-glutamyltransferase; HDL-C, high density lipoprotein cholesterol; HOMA-IR, homeostatic model assessment–insulin resistance; PP, pulse pressure; SBP, systolic blood pressure; TG, triglyceride.

* P < 0.001, †P < 0.05, metabolic syndrome vs nonmetabolic syndrome.

Table 1–2.
Mean difference of metabolic risk factors according to sex
Metabolic syndrome (Yes or No) MEN
WOMEN
Y N Y N
Age (years) 53.7 ±8.8 50.6 ±9.4 56.9 ±8.9 50.5 ±9.1
Smoking (1 or 2) N = 81 N = 330 N = 5 N = 22
Alcohol (1 or 2) N = 101 N = 355 N = 13 N = 86
SBP (mmHg) 141.2 ±15.4 122.4 ±16.2 43.7 ±12.3* 118 ±17.8
DBP (mmHg) 87.6 ±9.6 76.3 ±10.8 85.4 ±7.8 72.4 ±10.8
ALT (IU/L) 33.3 ±15.9* 23.1 ±9.6 31 ±14.7* 20.7 ±9.8
AST (IU/L) 27 ±8.2 24.1 ±6.5 28 ± 9.4 23 ±6.8
GGT (IU/L) 49 ±38.5* 30.6 ±30.1 37.1 ±31 25.9 ±30.1
HOMA-IR 1.9 ±1.35* 1.2 ±0.9 1.7 ±1.2* 1.1 ±1.2
BMI (kg/m2) 25.3 ±2.5 24 ±2.7 25.8 ±3.6* 23.7 ±2.8
Waist (cm) 90.1 ±6.1* 82.4 ±8.3 90.8 ±8 81 ±8.4
TG (mg/dL) 202.4 ±117.2* 122.9 ±71 163.7 ±75.6 100.5 ±89.4
HDL-C (mg/dL) 45.8 ±9.9* 56.5 ±12.7 46.9 ±12.1 56.3 ±13
FBS (mg/dL) 108.7 ±28.9* 91.6 ±17.4 102.9 ±22.9* 88.2 ±15.3

Data are means ±SD. Smoking (0: no smoking history, 1: previous smoking, 2: current smoking); Alcohol (0: no alcohol, 1: 1∼2 times/week, 2: ≥ 3 times/week); ALT, alanine aminotransferase; AST, aspartate aminotransferase; BMI, body mass index; DBP, diastolic blood pressure; FBS, fasting blood sugar; GGT, r-glutamyltransferase; HDL-C, high density lipoprotein cholesterol; HOMA-IR, homeostatic model assessment–insulin resistance; PP, pulse pressure; SBP, systolic blood pressure; TG, triglyceride.

* P < 0.001

P < 0.05.

Table 2.
Pearson's correlations between hepatic enzymes and metabolic risk factor in the presence and absence of metabolic syndrome (Men + Women)
Metabolic syndrome (Yes or No) Hepatic enzymes Alcohol HOMA-IR BMI Waist TG HDL FBS SBP DBP
Y ALT 0.094 0.468* 0.136 0.23 0.018 –0.009 0.644* –0.175 –0.141
  AST 0.048 0.33* 0.149 0.133 0.116 –0.075 0.413* –0.007 –0.01
  GGT 0.21 0.206 0.057 0.125 0.076 0.08 0.419* –0.015 0.05
N ALT 0.097 0.38* 0.146* 0.276* 0.112* –0.112* 0.705* 0.097 0.084
  AST 0.062 0.24* 0.078 0.089 0.086 0.1 0.409* 0.117* 0.102
  GGT 0.075 0.216* 0.081 0.182* 0.01 –0.054 0.308* 0.083 0.067

* P < 0.001

P < 0.05.

Table 3.
Logistic regression between study variables and metabolic syndrome
Variables Odds ratio P
LogALT 18.489 < 0.001
LogALT –0.49 0.466
LogALT 2.024 0.022

This results are adjusted for age, HOMA-IR, BMI and alcohol.

Table 4–1.
Risk for metabolic syndrome according to ALT levels
  ALT level below 25 percentiles ALT level within 25∼50 percentiles ALT level within 50∼75 percentiles ALT level above 75 percentiles
Men (IU/L) 6∼17 18∼22 23∼30 31∼77
Odds Ratio (95% confidence interval) 1 1.7 (1∼2.8) 3.6 (2.2∼5.9)* 6.9 (4.3∼10.9)*
Women (IU/L) 6∼15 16∼19 20∼25 26∼77
Odds Ratio (95% confidence interval) 1 1.2 (0.6∼2.3) 2.7 (1.5∼4.7)* 6.5 (3.8∼11)*

* P < 0.001.

Table 4–2.
Risk for metabolic syndrome according to GGT levels
  GGT level below 25 percentiles GGT level within 25∼50 percentiles GGT level within 50∼75 percentiles GGT level above 75 percentiles
Men (IU/L) 5∼15 16∼23 24∼41 42∼389
Odds Ratio (95% confidence interval) 1 1.7 (1∼2.9) 3.2 (2∼5.2)* 5.9 (3.7∼9.4)*
Women (IU/L) 5∼13 14∼18 19∼30 31∼389
Odds Ratio (95% confidence interval) 1 2.4 (1.3∼4.6) 3.1 (1.7∼5.6)* 7.2 (4.1∼12.5)*

* P < 0.001.

TOOLS
Similar articles