

 PDF
PDF ePub
ePub Citation
 Print
Print


Introduction
The metabolic syndrome is a cluster of metabolic abnormalities combined with insulin resistance. The two major adverse consequences of metabolic syndrome are cardiovascular disease and type 2 diabetes mellitus (T2DM)[1].
Hepatic steatosis, triglyceride accumulation in the liver, is one end of broad spectrum of non-alcoholic liver disease (NAFLD)[2]. Hepatic steatosis is frequently developed in the patients who have obesity, T2DM and hypertriglyceridemia[3,4]. Because the development of hepatic steatosis is related to insulin resistance, it is suggested to be one of the components of metabolic syndrome[5].
Regular exercise is one of essential recommendations for management of metabolic syndrome. Exercise improves insulin resistance by increasing glucose transport via increasing expression of glucose transporter-4 (GLUT4) protein in skeletal muscle [6,7] as well as by enhancing fat oxidation[8]. Exercise also decreases abdominal or visceral adiposity as well as total adiposity by increasing energy consumption[9]. Exercise also decreases plasma triglyceride (TG) level[10]. However, physical exercise alone or with other life style change has a limitation to control metabolic syndrome completely.
Thiazolidinedione or metformin as insulin sensitizer can improve hyperglycemia and hepatic steatosis, but have limitation to control other components of metabolic syndrome and even worsening of body weight in some patients[11,12].
In the management of metabolic syndrome, it has not been known till now that a unique drug or management can overcome the whole components of metabolic syndrome. Thus, the current recommendation of metabolic syndrome is collective therapeutic modality for each component of metabolic syndrome[13,14].
Recently it has been known as peroxisome proliferator-activated receptor (PPAR) α activator, fenofibrate has a capacity of decreasing abdominal adiposity and insulin resistance as well as decreasing TG level in rodents. Those actions are related to increased β -oxidation of fatty acid (FA) in mitochondria of hepatocyte[15] as well as increased lipolysis of lipoprotein[16].
The anti-steatotic effect of fenofibrate in the liver was reported on alcoholic fatty liver of rats[17]. Such action by bezafibrate also was demonstrated in a small group of breast cancer patients with tamoxifen induced non-alcoholic steatohepitis (NASH), an intermediate form of NAFLD[18].
Many data about modifying actions for metabolic derangements by fenofibrate has been reported but most of them were not analyzed in the context of metabolic syndrome.
We hypothesized that fenofibrate monotherapy have benefit to control metabolic syndrome. We also hypothesized that the combination therapy with fenofibrate and exercise might be more effective than fenofibrate or exercise monotherapy controlling major components of metabolic syndrome and hepatic steatosis.
Method
1. Animals
Four weeks of age OLETF (Otsuka Long-Evans Tokushima Fatty) rats, a model of obese T2DM (n = 20) and LETO (Long-Evans Tokushima Otsuka) rats, non-obese, non-diabetic rat strain (n = 5) were kindly donated from Otsuka Pharmaceuticals. They were fed standard rat diet (Oriental Yeast, Tokyo, Japan) and tap water ad libitum until thirty-four weeks of age. At this age, the subjects of OLETF rats were randomly assigned to one of the following four groups. Body weight did not differ significantly among groups. First group were ingested with chow diet only (n = 5, DD group) and second group were ingested with chow diet and were planned to exercise (n = 5, DE group). Third group were ingested with chow diet mixed with micronized fenofibrate (100 mg/kg) (n = 5, DF group) and fourth group, in addition to exercise, were ingested with chow diet mixed with micronized fenofibrate (100 mg/kg) (n = 5, EF group). All the subjects of LETO rats were also ingested with chow diet only as the age-matched control group (n = 5, LETO group).
Each exercise-planned rat was placed in the cage equipped with a fixed rotatory wheel (Dual treadmill, Daejung machinery Co, Korea) and encouraged to run. We modified the exercise protocol of Henriksen[19]. The modified exercise protocol is as follow: Exercise started in warming mode for 1 week (running for 8 min at 8 m/min on first day and for 15 min at 10 m/min on second day and for 18 min at 15 m/min on third day and for 20 min at 18 m/min on fourth day and then for 25 min at same velocity on fifth day and for 30 min at same velocity on sixth day and for 30 min at 20 m/min on seventh day and for 35 min at 22 m/min on eighth day) and exercise was continued for 60 min by 4 cycles during the next 5.5 weeks. Peak velocity of first cycle was at 15 m/min for 4 min and second cycle was at 18 m/min for 5 min and third cycle was at 20 m/min for 6 min and fourth cycle was at 15 m/min for 4 min.
At 38 weeks of age, blood sampling was done for all the subjects and then they were sacrificed for fat tissue dissections. The dissected visceral (mesenteric, epididymal and retroperitoneal) fat tissues and subcutaneous fat tissues were weighed.
All the OLETF rats were cared and handled during entire period of experiments by the Guidelines of Animal Experiments recommended by The Korean Academy of Medical Sciences.
2. Measurement of total food intake, BW
From the age of 34 weeks till the end of 38 weeks of age, we measured daily and total amount of food intake. Body weight of each rat was measured in twice a week.
3. Measurement of glucose, insulin, and HOMA-IR index
After 8 hours fasting period, all animals were inhaled with ether and injected with ketamine (200 mg/kg) into intraperitoneum. The glucose levels were measured with a method of glucose oxidase (glucose analyzer 2, Beckman, Fullerton, CA, U.S.A.). Insulin levels were analyzed with RIA (Rat insulin RIA kit, Linco Research Inc, St. Charles, Missouri, USA). We used a homeostasis model of assessment for insulin resistance (HOMA-IR) and the formula used to calculate HOMA-IR index[20] was as follow;
fasting glucose (mmoL/L) × fasting insulin (U/mL)/22.5
4. Measurement of lipid and leptin levels
The levels of total cholesterol (Infinity Cholesterol Reagent, Sigma Diagnostics, USA), triglyceride (Infinity Triglycerides Reagent, Sigma Diagnostics, USA) and HDL-C (EZ HDL Cholesterol, Sigma Diagnostics, USA) were measured with enzyme method. The levels of leptin were analyzed with RIA (Rat leptin RIA kit, Linco Research Inc, St. Charles, Missouri, USA).
5. Light microscopy of liver
Hepatic tissues were sampled and fixed in 10% neutral buffered formalin, and embedded in paraffin. The sections were stained with haematoxylin and eosin.
6. Hepatic steatosis scoring
Haematoxylin- and eosin-stained sections were examined to grade the severity of steatosis. We classified steatosis into five grades. A grade of 0 was assigned when hepatocytes did not contain any fat ('none'), 0.5 when only microvesicles of fat were seen ('minimal'), 1 when up to l/3 of hepatocytes showed macrovesicular fatty change of hepatocytes ('mild'), 2 when l/3 to 2/3 of hepatocytes showed macrovesicular fatty change ('moderate') and a grade of 3 when fatty change was present more than 2/3 of hepatocytes ('severe'). The degree of fibrosis was assessed by Masson's trichrome stain.
7. Statistical analysis
All results are presented as means ± standard deviation. Significance of differences between groups was analyzed by Mann-Whitney U test. We used statistical programs resident in SPSS 10.0 for windows. Differences were considered significant when the P values were less than 0.05. The relationships between body weight, food intake and plasma leptin level, and between hepatic grades and plasma leptin levels were examined by Spearman's rho correlation coefficients.
Results
1. Total amount of food intake
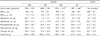
The total amount of food intake of DD (1556 ± 225 g/5 week) and DE (1450 ± 230 g/5 week) groups were not significantly different between both groups. But, DF (1012 ± 218 g/5 week) and EF group (997 ± 364 g/5 week) were significantly decreased than DD and DE group (P < 0.05) (Table 1).
2. Body weight
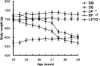
The final body weight of DD group (768 ± 62 g) was significantly increased than that of LETO group (609 ± 22 g). DF (605 ± 31 g) and EF (568 ± 90 g) groups were significantly decreased than DD group. EF group also significantly decreased than DE group (701 ± 82 g) (P < 0.05) (Table 1).
The body weight of DF and EF groups showed gradually decreasing patterns but DD and DE groups showed less changes during experiment. The body weight of LETO group was increased with time (Fig. 1).
The change of body weight during experiment (BW38w-34w) and its percentage of change {BW38w-34w (%)}were calculated in all groups. The body weight changes of DE (1 ± 12 g, 0.0 ± 1.9 %), DF (-103 ± 17 g, -17 ± 2.9 %) and EF (-116 ± 44 g, -22 ± 11.2 %) were significantly decreased compared with that of DD (28 ± 22 g, 3.5 ± 2.5%) and LETO (29 ± 14, 4.8 ± 2.5 %) groups (P < 0.05). However, there were no significant differences of body weight change between DD and LETO groups, or DF and EF groups (Table 1).
3. Body fat weight
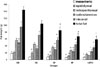
The mesenteric fat weight of DD (18.5 ± 11.3 g) group was significantly increased than LETO (6.5 ± 0.9 g) group (P < 0.05). And EF (6.3 ± 2.8 g) and DF (7.9 ± 3.5 g) groups were significantly lower than DD group (P < 0.05). However, there were no significant differences between DE (7.5 ± 3.5 g), DF and EF groups (Table 1, Fig. 2).
The epididymal fat weight of DD (20.4 ± 4.0 g) group was not significantly different than that of LETO (16.4 ± 2.0 g) group. EF (10.7 ± 3.9 g), DF (12.3 ± 3.0 g) and DE (19.1 ± 12.0 g) were significantly lower than DD group (P < 0.05) (Table 1, Fig. 2).
The weight of retroperitoneal fat of DD (56.4 ± 20.7 g) group was significantly increased than LETO (12.3 ± 0.2 g) group (P < 0.05). EF (26.9 11.5 g) was significantly lower than DD group (P < 0.05). There were no significant differences between DE (45.0 ± 10.4 g) and DF (36.2 ± 5.6 g) groups (Table 1, Fig. 2).
The weight of subcutaneous fat of DD (48.9 ± 2.5 g) group was significantly increased than LETO (23.5 ± 0.7 g) group (P < 0.05). EF (23.3 ± 9.0 g) and DF (29.2 ± 2.9 g) groups were significantly lower than DD group (P < 0.05). There were no significant differences between DE (32.5 ± 17.0 g) group and other groups (Table 1, Fig. 2).
The weight of visceral fat, which is the sum of each mesenteric, epididymal and retroperitoneal pad mass, in DD (95.3 ± 22.6 g) group was significantly increased than LETO (35.1 ± 2.9 g) groups (P < 0.05). EF (43.9 ± 18.1 g) and DF (56.3 ± 6.4 g) groups were significantly lower than DD group (P < 0.05). But DE (71.6 ± 28.5 g) group was not significantly different with other groups (Table 1, Fig. 2).
The weight of total fat, which is the sum of visceral and subcutaneous fat weight, in DD (144.2 ± 20.8 g) groups was significantly increased than LETO (58.6 ± 3.6 g) group (P < 0.05). EF (67.3 ± 26.1 g) and DF (85.5 ± 6.6 g) groups were significantly lower than DD group (P < 0.05). But DE group (104.2 ± 45.3 g) was not significantly different from other groups (Table 1, Fig. 2).
4. Plasma glucose levels
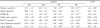
The fasting glucose levels of DD (15.7 ± 1.5 mmoL/L) were significantly increased than LETO (6.6 ± 0.8 mmoL/L) group (P < 0.05). EF (8.8 ± 0.7 mmoL/L) and DF (9.0 ± 0.7 mmoL/L) were significantly decreased than DD (P < 0.01, P < 0.05, respectively) and DE (12.8 ± 2.3 mmoL/L) groups (P < 0.01, P < 0.05, respectively). However there were no significant differences between DE and DD groups or DF and EF groups (Table 2).
5. Plasma insulin levels and HOMA-IR index
The fasting insulin levels of DD (30.0 ± 7.8 pmoL/L) were significantly increased than LETO (10.2 ± 9.0 pmoL/L) group (P < 0.05). EF (4.8 ± 4.2 pmoL/L), DF (12.6 ± 9.0 pmoL/L) and DE (9.6 ± 4.2 pmoL/L) were significantly decreased than DD group (P < 0.01, P < 0.05 and P < 0.01, respectively). However there were no significant differences between DE and DF groups or DE and DF groups or DF and EF groups (Table 2).
The HOMA-IR of DD (3.6 ± 1.2) group was significantly increased than LETO (0.9 ± 0.4) group (P < 0.05). EF (0.3 ± 0.3), DF (0.9 ± 0.7) and DE (1.0 ± 0.5) were significantly decreased than DD group (P < 0.01, P < 0.05, and P < 0.05, respectively). Also, EF was significantly decreased than DE group (P < 0.05). However, there were no significant differences between DE and DF groups or DF and EF groups (Table 2).
6. Plasma leptin levels
There were no significant differences in plasma leptin levels between DD (14.1 ± 3.2 ng/mL) and LETO (10.2 ± 2.8 ng/mL) groups. EF (3.9 ± 2.0 ng/mL) and DF (6.3 ± 0.9 ng/mL) were significantly decreased than DD group (P < 0.05). Also, EF and DF were significantly decreased compared with DE group (11.2 ± 4.1 ng/mL) (P < 0.05). However there were no significant differences between DD and DE groups, or DF and EF groups (Table 2).
7. Plasma triglyceride and HDL-C levels
The fasting triglyceride levels of DD (4.30 ± 1.97 mmoL/L) were significantly increased compared than LETO group (0.65 0.24 mmoL/L) (P < 0.05). EF (0.46 ± 0.18 mmoL/L), DF (0.60 ± 0.13 mmoL/L) and DE (1.87 ± 0.57 mmoL/L) were significantly decreased than DD group (P < 0.01, P < 0.05, and P < 0.05, respectively). Also, EF and DF were significantly decreased than DE group (P < 0.01, P < 0.05, respectively). However there were no significant differences between DF and EF groups (Table 2).
There were no significant differences in plasma HDL-C levels between DD (0.76 ± 0.43 mmoL/L) and LETO (0.72 ± 0.25 mmoL/L) groups. EF (1.19 ± 0.16 mmoL/L) and DF (0.88 ± 0.59 mmoL/L) groups were significantly higher than DD group (P < 0.05). DE group (1.00 ± 0.39 mmoL/L) was no significantly different from other groups (Table 2).
The fasting total cholesterol level of DD (5.95 ± 2.66 mmoL/L) was significantly increased than that of LETO group (2.69 ± 0.18 mmoL/L) (P < 0.05). The fasting total cholesterol levels of EF, DF and DE groups were 3.73 ± 0.91, 3.84 ± 0.84 and 5.20 ± 2.30 mmoL/L, respectively. There were no significant differences between all four groups (Table 2).
8. Correlation among plasma leptin levels, body weight and food intake
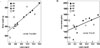
Plasma leptin levels of all subjects were significantly correlated with final body weights of total subjects (r = 0.88 P < 0.0001). The linear correlations between both variables in DD and DF were well preserved (Fig. 3A). Plasma leptin levels of all subjects were significantly correlated with total food intake (r = 0.54 P < 0.03). The linear correlation between both variables was well preserved in DD group but not in DF group. The amounts of food intake in two rats were lowered than predicted amounts regarding to their plasma leptin levels in DF group (n = 4) (Fig. 3B).
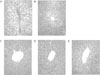
9. Light microscopic findings of liver
DD group (A) showed moderate hepatic steatosis. The hepatocytes were occupied by macrovesicular fats and showed the ballooning character. DE group (B) showed mild hepatic steatosis. Some of the hepatocytes presented macrovesicular fats predominantly. DF (C) and EF group (D) hardly showed recognizable fatty change of hepatocytes. LETO group (E) showed normal morphology of hepatocytes (Fig. 4).
10. Hepatic steatosis score and plasma leptin levels
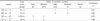
The hepatic steatosis score of DD was 1.7, and that of DE was 1.4. There were no significant differences of scores between DD and DE groups. However, EF (0.4) and DF (0.1) groups showed significantly decreased scores than that of DE group (P < 0.01, P < 0.05, respectively), and EF group also showed significantly decreased score than that of DD group (P < 0.05) (Table 3).
The hepatic steatosis score of each group was well correlated with the plasma leptin levels in each group (Table 3).
Discussion
OLETF rats lack of cholecystokinin (CCK)-A receptors because of a genetic mutation, which lead to hyperphagia, mild obesity, diabetes, hyperlipidemia and hypertension[21,22]. Though the exact diagnostic criteria of metabolic syndrome in animal have not been defined, the constellation of these significant metabolic derangements in OLETF rats could be called as metabolic syndrome in a broad sense. Along with these similar phenotypes of human metabolic syndrome, OLETF rats have definite insulin resistance[23] as the pathophysiologic mechanism. These strains also complicate hepatic steatosis, which has been suggested as one component of metabolic syndrome[5]. Because of these reasons, we thought that these strains could be used as animal model of metabolic syndrome with hepatic steatosis.
In this study, fenofibrate monotherapy induced to decrease abdominal obesity significantly. The decreased body weight and adiposity induced by fenofibrate was previously reported to relate with the increased fatty acid oxidation in the liver and decreased food intake[15]. Fenofibrate treatment also definitely decreased the amount of food intake as well as plasma leptin levels. Fenofibrate did not affect the correlation between body weight and plasma leptin levels as others reported[24]. However, fenofibrate treatment showed the tendency that it decreased amounts of food intake less than predicted amounts regarding to plasma leptin levels. This finding suggested that decreased food intake might be resulted from decreased leptin activity by fenofibrate.
It has been reported that decreased food intake by fenofibrate was related to increased ketogenesis via inducing upregulation of mitochondrial HMG CoA synthase[25]. It also reported that increased intraventricular level of β-hydroxybutyrate induced to decrease food intake in rats[26]. In this study, we did not measure the plasma ketone bodies but other studies demonstrated that fenofibrate treatment increased the plasma ketone levels[27,28].
We do not know that the decreased food intake was induced by direct action of fenofibrate via increasing ketogenesis or by indirect effect via decreasing leptin activity or both. Whether the decreased food intake by fenofibrate was induced directly or indirectly, it could contribute to decrease body weight and body adiposity.
OLETF rats are the naturally occurring knockout animals with the homozygously disrupted CCK-A receptor gene. One of the functions of CCK-A receptor in the hypothalamus is to regulate food intake[29]. The central suppressive effect of CCK on food intake may be mediate by CCK-A receptor[30]. The absence of CCK-A receptor may result in hyperphagia and obesity in OLETF rats because of lack of satiety. It is very interesting finding that fenofibrate therapy could decrease food intake in CCK-A receptor knockout rats. This finding suggests that fenofibrate derived stimuli (possibly improved leptin resistance) might be more important than CCK derived stimuli for regulation of satiety center in hypothalamus of OLETF rats.
In this study, fenofibrate monotherapy also significantly improved hypertriglyceridemia and hyperglycemia. The hypotriglyceridemic effect of fenofibrate has been well known[31]. The hypoglycemic action of fenofibrate was unexpected. Fenofibrate treatment was known to decrease plasma insulin level and HOMA-IR index[15,24]. We supposed that reduced plasma glucose level by fenofibrate treatment might be resulted from improved insulin resistance. There could be two possible explanations for this improvement of insulin resistance by fenofibrate; 1) via decreasing abdominal obesity 2) via disrupting the vicious cycle of insulin resistance.
First, we already discussed that fenofibrate therapy induced a significant decrease of abdominal obesity. Abdominal adiposity is causally related to insulin resistance. Therefore, fenofibrate therapy can improve insulin resistance by decreasing abdominal obesity.
Second, fenofibrate treatment may improve insulin resistance by disrupting the vicious cycle of insulin resistance. For the genesis of hepatic steatosis, peripheral insulin resistance is one of major mechanism[32,33]. It has been suggested that fat burden in liver could induce hepatic insulin resistance[37,38]. The hepatic steatosis in moderate obese subjects with normal glucose tolerance is associated with (hepatic) insulin resistance[5]. There are some indirect evidences that hepatic steatosis might induce hepatic insulin resistance independently associated with peripheral insulin resistance[36,37]. These data suggest that hepatic insulin resistance induced by hepatic setatosis might aggravate the preexisting insulin resistance, leading to vicious cycle[33]. Thus, we suggest that resolved hepatic steatosis by fenofibrate might alleviate pre-existing insulin resistance by relieving hepatic insulin resistance.
In this study, we showed that hepatic steatosis had not developed in fenofibrate treated rats. It has been explained that visceral obesity, increased FFA influx of liver and peripheral insulin resistance (with compensatory hyperinsulinemia) are etiologic factors for the genesis of hepatic steatosis in obese subjects[32,33]. It has been also reported that plasma leptin correlated directly with the severity of hepatic steatosis and its mechanism was supposed that leptin might have pathologic role in insulin resistance and/or fail the anti-steatogenic actions possibly via peripheral leptin resistance[38]. Thus, we suggest that fenofibrate might prevent the development of hepatic steatosis by decreasing visceral obesity, improving peripheral insulin resistance and possibly improving leptin resistance.
It was also reported that hyperglycemia in diabetic condition or hyperinsulinemia in insulin resistance state may contribute to genesis of hepatic steatosis via inducing de novo lipogenesis[32]. Therefore, improving hyperglycemia and hyperinsulinemia by fenofibrate also contributed to prevent the development of hepatic steatosis in these rats.
Exercise therapy significantly reduced epididymal fat weight, plasma level of triglyceride and HOMA-IR index but not plasma level of glucose and hepatic steatosis. Thus, exercise alone is not enough to control metabolic syndrome or hepatic steatosis. The combination therapy with fenofibrate and exercise did not show any synergistic effects to control metabolic syndrome and hepatic steatosis than fenofibrate monotherapy. The combination therapy showed only insignificant additive effect.
In our previous study using a lower dose of fenofibrate (30 mg/kg), we showed that exercise or fenofibrate monotherapy did not reduce body adiposity. However, combination therapy decreased abdominal adiposity synergistically[39]. Discrepancy between those results can be explained by the different dose of fenofibrate. The action of lower dose of fenofibrate might be too weak to decrease abdominal adiposity significantly. However, the higher dose of fenofibrate itself was so strong that it could overwhelm additional positive effect of exercise.
In conclusion, fenofibrate monotherapy was effective to control three major components (obesity, hypertriglyceridemia and hyperglycemia) of metabolic syndrome and hepatic steatosis in OLETF rats. Combination therapy of fenofibrate and exercise showed only additional effect of exercise on that of fenofibrate monotherapy. We supposed that the improvement of metabolic syndrome and hepatic steatosis by fenofibrate treatment was related with decreasing food intake and abdominal adiposity that resulted in weight loss, improving insulin resistance, and decreasing leptin activity.
 XML Download