

 PDF
PDF ePub
ePub Citation
 Print
Print


Abstract
Purpose
The purpose of this study was to develop and test the psychometric properties of the newly developed instrument, Meaning in Life, for elderly Korean people.
Methods
Ten older adults participated in the qualitative research used to develop the initial items. Participants for the psychometric testing were 371 community-dwelling older adults. Validity and reliability analyses included content, construct, and criterion-related validities, internal consistency, and test-retest reliability.
Results
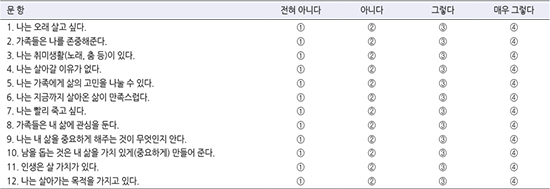
The Meaning in Life Scale consisted of 12 items with three distinct factors; value of life, source of life, and will to live, which explained 86.7% of the total variance. A three-factor structure was validated by confirmatory factor analysis. Criterion-related validity was supported by comparison with the Purpose in Life Test (r=.74). Reliabilities were secured with test-retest reliability of Intra-class Correlation Coefficient (ICC) .85 and the Cronbach's alpha coefficient .90.
Figures and Tables
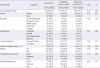
Table 1
Demographic Characteristics of Participants
![]()
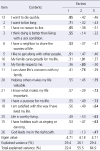
Table 2
Factor Loadings from First Wave EFA of MLS (N=200)
![]()
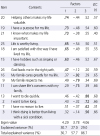
Table 3
Factor Loadings from Second Wave EFA and Reliability Coefficients of MLS (N=200)
![]()
Table 4
Confirmatory Factor Analysis of MLS (N=171)
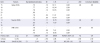
| Fitness index | χ2 (p) | df | CMIN/DF | GFI | SRMR | RMSEA (90% CI) | TLI | CFI |
|---|---|---|---|---|---|---|---|---|
| Criteria | (>.05) | ≤3 | ≥.90 | ≤.08 | ≤.10 | ≥.90 | ≥.90 | |
| Model | 104.08 (<.001) | 51 | 2.04 | .91 | .05 | .08 (.06~.10) | .93 | .95 |
MLS=Meaning in life scale; SE=Standard error; C.R.=Critical ratio; AVE=Average variance extracted; CMIN/DF=Chi-square minimum/degree of freedom; GFI=Goodness of fit index; SRMR=Standardized root mean residual; RMSEA=Root mean square error of approximation; CI=Confidence interval; TLI=Turker lewis index; CFI=Comparative fit index.
Two items were deleted because it was standardized estimates of less than .50.
![]()

References
1. Park ES, Park JA. Research trends and implications in meaning in life. Ewha J Soc Sci. 2013; 29(1):267–299.
2. Kim KM, Ryu SA, Choi IC. The effect of meaning in life on happiness and health in late life. Korean J Psychol Gen. 2011; 30(2):503–523.
3. Bamonti P, Lombardi S, Duberstein PR, King DA, Van Orden KA. Spirituality attenuates the association between depression symptom severity and meaning in life. Aging Ment Health. 2016; 20(5):494–499. DOI: 10.1080/13607863.2015.1021752.
4. Heisel MJ, Neufeld E, Flett GL. Reasons for living, meaning in life, and suicide ideation: Investigating the roles of key positive psychological factors in reducing suicide risk in communityresiding older adults. Aging Ment Health. 2016; 20(2):195–207. DOI: 10.1080/13607863.2015.1078279.
5. Van Orden KA, Bamonti PM, King DA, Duberstein PR. Does perceived burdensomeness erode meaning in life among older adults? Aging Ment Health. 2012; 16(7):855–860.
6. Crumbaugh JC, Maholick LT. Manual of instructions for the purpose in life test. Munster, DE: Psychometric Affiliates;1969. p. 1–28.
7. McGregor I, Little BR. Personal projects, happiness, and meaning: On doing well and being yourself. J Pers Soc Psychol. 1998; 74(2):494–512.
8. Steger MF, Frazier P, Oishi S, Kaler M. The meaning in life questionnaire: Assessing the presence of and search for meaning in life. J Couns Psychol. 2006; 53(1):80–93. DOI: 10.1037/0022-0167.53.1.80.
9. Burbank PM. An exploratory study: Assessing the meaning in life among older adult clients. J Gerontol Nurs. 1992; 18(9):19–28. DOI: 10.3928/0098-9134-19920901-06.
10. Choi SO, Kim SN, Shin KI, Lee JJ, Jung YJ. Development of elderly meaning in life(EMIL) scale. J Korean Acad Nurs. 2003; 33(3):414–424.
11. Hinkin TR. A brief tutorial on the development of measures for use in survey questionnaires. Organ Res Methods. 1998; 2(1):104–121. DOI: 10.1177/109442819800100106.
12. Fitzpatrick JJ. Life perspective rhythm model. In : Fitzpatrick JJ, Whall AL, editors. Conceptual models of nursing: Analysis and application. Bowie, MD: Brady;1983. p. 295–302.
13. Fitzpatrick JJ, Kim NH. Meaning in life: Translating nursing concepts to research. Asian Nurs Res. 2008; 2(1):1–4. DOI: 10.1016/S1976-1317(08)60023-7.
14. Lincoln YS, Guba EG. Naturalistic inquiry. Beverly Hills, CA: Sage;1985. p. 187–220.
15. Won DR, Kim KH, Kwon SJ. Validation of the Korean version of meaning in life questionnaire. Korean J Health Psychol. 2005; 10(2):211–225.
16. DeVellis RF. Scale development: Theory and applications. 3rd ed. Thousand Oaks, CA: Sage;2012. p. 80–110.
17. Lynn MR. Determination and quantification of content validity. Nurs Res. 1986; 35(6):382–385.
18. Polit DF, Beck CT, Owen SV. Is the CVI an acceptable indicator of content validity? Appraisal and recommendations. Res Nurs Health. 2007; 30(4):459–467. DOI: 10.1002/nur.20199.
19. Jung KH, Oh YH, Kang EN, Kim JH, Sunwoo D, Oh MA, et al. A survey of Korean older persons. Report No.: Policy Report 2014-61. Sejong: Ministry of Health and Welfare, Korea Institute for Health and Social Affairs;2014.
20. Gyeongin Regional Statistics Office. Capital region 65 Plus (3V Senior) I Aging [Internet]. Gwacheon: Statistics Korea;2016. cited 2016 December 20. Available from: http://www.kostat.go.kr/office/giro/rogi_nw/2/1/index.board?bmode=read&aSeq=355685&pageNo=&rowNum=10&amSeq=&sTarget=&sTxt=.
21. Anderson JC, Gerbing DW. Structural equation modeling in practice: A review and recommended two-step approach. Psychol Bull. 1988; 103(3):411–423. DOI: 10.1037/0033-2909.103.3.411.
22. Zimet GD, Dahlem NW, Zimet SG, Farley GK. The multidimensional scale of perceived social support. J Pers Assess. 2010; 52(1):30–41. DOI: 10.1207/s15327752jpa5201_2.
23. Shin JS, Lee YB. The effects of social supports on psychosocial well-being of the unemployed. Korean Acad Soc Welf. 1999; 37(1):241–269.
24. Diener E, Emmons RA, Larsen RJ, Griffin S. The satisfaction with life scale. J Pers Assess. 1985; 49(1):71–75. DOI: 10.1207/s15327752jpa4901_13.
25. Jo MH, Cha KH. National comparison to life satisfaction. Seoul: Jipmoondang;1998. p. 1–23.
26. Cohen J. A power primer. Psychol Bull. 1992; 112(1):155–159.
27. Hair JF, Black WC, Babin BJ, Anderson RE. Multivariate data analysis: A global perspective. 7th ed. Upper Saddle River, NJ: Pearson Prentice Hall;2010. p. 109–136.
28. Yu JP. The concept and understanding of structural equation modeling. Seoul: Hannare Publishing Co.;2012. p. 160–370.
29. Field AP. Discovering statistics using IBM SPSS statistics: And sex and drugs and rock ‘n’ roll. 4th ed. London, UK: Sage;2013. p. 685–686.
30. Heo J. Structural equation modeling with AMOS. Seoul: Hannarae Publishing Co.;2013. p. 70–89.
 XML Download