

 PDF
PDF ePub
ePub Citation
 Print
Print


INTRODUCTION
The prevalence rates of many chronic diseases (e.g., obesity, diabetes mellitus, hypertension, stroke, and cancer) are increasing worldwide, and many of these are associated with dietary habits. The available literature on diet and health supports the development of current dietary guidelines, nutritional policies, and educational tools to promote healthy eating [1]. The increasing prevalence of being overweight or obese in South Korea and other countries has renewed the attention of governments on the format and regulation of nutrition labeling on foodstuffs.
The provision of clear nutrition information for consumers is a population-based public health strategy aimed at facilitating health literacy. There is presently a global move toward mandatory nutrition labeling on prepackaged food products, along with improvements to existing policies on nutrition labeling. In Korea, nutrition labeling was harmonized under the Nutrition Labeling Directive in 1995, but to date this has not been compulsory. Since 1990, US law has mandated that all food packages contain nutrition information in a standardized label form [2].
Nutrition labels were instituted to assist the population in making healthier dietary choices that would ultimately have a positive effect on public health [3]. Various nutrition-education campaigns have been implemented by public health organizations to increase knowledge about healthy food choices with the aim of facilitating the adoption of better dietary practices. One of these strategies includes regulations for the labeling of food products that, in North America [4], consist of approved nutrient-content claims (e.g., low in fat or a good source of fiber). However, whether people understand nutrition information provided on food labels sufficiently well for them to be able to choose healthier foods remains to be clearly established.
Obesity is an increasingly prevalent nutritional disorder throughout the world and its accompanying comorbidities are major health concerns in Korea. During the period 1998–2012, the prevalence of obesity (BMI>25 kg/m2) in women showed a mildly increasing tendency by 1.6% from 28.1% in 1998 to 29.7% in 2012 [5]. The continued rise in rates of obesity and diet-related chronic disease over the past several decades has culminated in a public health crisis that warrants re-examination of approaches designed to combat these disorders. Given the increasing prevalence of being overweight or obese, it is important to investigate the effects on the reproductive health of women. There are several mechanisms whereby the obese women may have reduced fertility potential, such as psychosocial factors and pathophysiological mechanism [6]. A positive correlation between increasing BMI and infertility has been described with a relative risk of 2.70 in obesity [7]. Ovarian dysregulation associated with hyperandrogenism, insulin resistance, menstrual irregularity and infertility are commonly found in women with polycystic ovarian syndrome many of whom are obese [8].
Obese women are more likely to experience menstrual cycle irregularity than non-obese women [6910]. Menstrual cycles can be important indicators of health and fertility because they reflect basic physiology, and irregular cycles may be indicative of underlying endocrine disorders [11]. The menstrual cycle length has been suggested as a noninvasive clinical marker of reproductive function [12], and has also been investigated as a predictor of adverse health outcomes including breast cancer, cardiovascular disease, and type 2 diabetes mellitus [1213].
Several studies showed that reading labels was associated with nutrition knowledge, perceived importance of a healthy diet, and an understanding that eating too much fat is related to being unhealthy [141516]. For example, in one study, the people with chronic disease may be open to increasing healthy dietary behaviors, given their greater use of nutrition labels and awareness of national nutrition recommendations [3].
Although these aforementioned studies have attempted to explain some of effects on obesity and menstrual cycle irregularity of nutrition labeling, we are not aware of any previous studies that simultaneously considered association with these factors. Thus, the purpose of this study was to use a nationally representative sample of women in the Korean population to determine the association between the awareness of nutrition labels and menstrual cycle irregularities.
METHODS
1. Study sample
This study was based on the raw data collected in the Fifth Korean National Health and Nutrition Examination Survey (KNHANES-V), which was conducted by the Korean Centers for Disease Control and Prevention (KCDC) during a 3-year period (2010~2012). KNHANES-V was a nationally representative, cross-sectional survey targeting noninstitutionalized Korean people and used a stratified and multistage probability sampling design with a rolling survey sampling model. The sampling units were based on the population and housing consensus from the National Census Registry in Korea. Sample weights were calculated by a nonresponse, complex survey design, with post stratification used to ensure that the sample participants accurately represented the overall Korean population [17]. The first year of the survey (in 2010) involved 8,958 participants out of 10,938 people in total (participation rate: 81.9%), the second year (in 2011) involved 8,518 participants out of 10,589 people in total (participation rate: 80.4%), and the third year (in 2012) involved 8,057 participants out of 10,069 people in total (participation rate: 80.0%). All of the participants provided written informed consent, and the institutional review board of the KCDC approved the study protocol.
For this study, we excluded the data of 8,461 male respondents and 5,954 female respondents who were aged under 19 or over 54 years. Of the remaining 11,119 women aged 19~54 years, 6,350 women with menopause, 2 women with pregnancy, and 443 women with missing values were exclude. We thus analyzed the data of 4,324 women in the present study.
2. Measures
1) Awareness of Nutrition Labels, and Menstrual Cycle Characteristics
KNHANES-V contained the question “Do you read nutrition labels when you buy food products?” to be answered by selecting one of the following three responses: (1) “Read nutrition labels,” (2) “Do not read nutrition labels,” or (3) “Do not know about nutrition labels.” The participants were divided into three groups according to their awareness of nutrition labels as indicated by the response to the questionnaire: (1) Reading Group, composed of individuals who read nutrition labels; (2) Not-Reading Group, composed of individuals who do not read nutrition labels; and (3) Not-Knowing Group, individuals who do not know about nutrition labels.
Data regarding reproductive factors were collected by asking the participants to recall the duration of their menstrual cycle, their use of hormone replacement therapy, and their use of oral contraceptives. Menstrual cycle characteristics were categorized into regular, irregular, duration of up to 3 months, and irregular with duration of longer than 3 months. Finally, the menstrual cycle irregularity was dichotomized into regular and irregular.
2) Demographic Characteristics
The following variables were used as demographic characteristics: age, residence area, living with spouse, educational level, economic status, smoking status, alcohol intake, and exercise regularity. The “living with spouse” characteristic was categorized as “yes” in the case of living together with a spouse and “no” when the woman was single, had no spouse, or was living separately from a spouse due to divorce. The women were stratified into four groups according to educational level: elementary school, middle school, high school, and college. The economic status of the household was classified into quartiles according to the normalized income defined as the average monthly household income divided by  . Smoking status was categorized into never smoked, had smoked in the past, or current smoker. Alcohol intake was based on the drinking patterns during the past month. Regular exercise was defined as strenuous or moderate physical activity performed for at least 20 min at least three times per week.
. Smoking status was categorized into never smoked, had smoked in the past, or current smoker. Alcohol intake was based on the drinking patterns during the past month. Regular exercise was defined as strenuous or moderate physical activity performed for at least 20 min at least three times per week.3) Food intake
Calories, total fat, cholesterol, carbohydrate, and sodium content were all measured using the 24-hour dietary recall from KNHANES-V. KNHANES-V quantifies dietary intake in the calendar day from midnight to midnight prior to the interview via dietary recall interviews that were conducted in person by trained dietary interviewers.
4) Physical, Psychological, and Women's-Health-related Factors
The physical and psychological health-related variables comprised a physician's diagnoses or results from a health examination of obesity (body mass index [BMI] and waist circumference), hypertension, diabetes, hypercholesterolemia, and metabolic syndrome, recognition of stress, experience of depression, and experience of suicidal ideation. The recognition of stress was dichotomized into “yes” (“very strong,” “strong,” or “moderate” recognition) or “no” (“little recognition”). The experience of depression was surveyed using the question “Have you ever felt sad or depressed for more than 2 weeks in the past year?”, while the experience of suicidal ideation were surveyed using the question “Have you ever thought about killing yourself in the past year?”, with each question answered by a “yes” or “no” response.
Information concerning women's-health-related factors were obtained from data based on a self-report questionnaire completed during the interview portion of each survey period. The factors included age at menarche, age at menopause, experience of pregnancy, number of pregnancies, age at first birth, and age at last birth. The number of pregnancies included those with and without abortion. The number of abortions was classified into the total number of abortions (including spontaneous and artificial abortions), the number of spontaneous abortions, the number of artificial abortions, the number of normal deliveries, and the number of preterm births.
3. Statistical analysis
The SAS survey procedure (version 9.3, SAS Institute, Cary, NC, USA) was used to implement a complex sample design based on data analysis from the survey data; this provided sampling weights and nationally representative estimates. All data are presented as mean±standard-error values for continuous variables and as proportions for categorical variables. Differences between demographic characteristics, physical and psychological health-related characteristics, awareness of nutrition labels, and menstrual cycle irregularity were analyzed with chi-square tests, t-tests, and ANOVA. Logistic regression models were used to calculate multivariable adjusted odd ratios (ORs) and 95% confidence intervals (CIs). Potential confounding variables were minimally controlled for age and BMI only in the first model (model 1). The second model (model 2) was adjusted for the variables in model 1 plus smoking status, alcohol intake, and exercise regularity. The third model (model 3) was adjusted for the covariates as in model 2 plus stress, depression, suicidal ideation, metabolic syndrome, age at menarche, parity, and use of oral contraceptives.
4. Ethical considerations
This study was granted an exemption from IRB review at the first author's university (IRB No. 1041078-201608-HRSB-155-01) because it used de-identified KNHANES-V data that are openly available to the public through a website as a government-approved statistical survey. Informed consent was obtained from all of the participants in this survey.
RESULTS
1. Demographics and awareness of nutritional labels
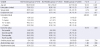
Table 1 presents the demographic characteristics of the participants according to awareness of nutrition labels. There were 8.7%, 44.9%, and 46.4% of the overall 4,324 participants in the Not-Knowing, Not-Reading, and Reading Groups, respectively. The mean age (p<.001), residence area (p=.001), employment (p=.017), educational level (p<.001), economic status (p=.003), and exercise regularity (p<.001) differed significantly between the groups. Individuals in the Reading Group were younger and had a higher educational level, higher economic status, and greater exercise regularity, and were more likely to live in an urban area and were unemployed compared to those in the Not-Reading and Not-Knowing Groups.
2. Comparison of physical, psychological, and women's health
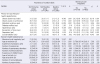
Data on physical, psychological, and women's health-related factors are presented in Table 2. The prevalence rates of BMI obesity, waist-circumference obesity, metabolic syndrome, hypertension, depression, and suicidal ideation were higher in the Not-Knowing Group than in the Reading or Not-Reading Groups (all p<.01). Of the women's-health-related factors, experience of pregnancy, experience of childbirth, age at first birth, and age at last birth were significantly higher in the Reading Group (all p<.001). The prevalence of menstrual cycle irregularity was highest in the Not-Knowing Group and lowest in the Reading Group (p=.001). Age at menarche was younger in the Reading Group, while the age at first birth was younger in the Not-Knowing Group.
All study variables except for the number of abortions, normal deliveries, and preterm births differed significantly with menstrual cycle irregularity (all p<.05). The percentages of participants with BMI obesity, waist-circumference obesity, metabolic syndrome, diabetes mellitus, hypertension, recognition of stress, depression, and suicidal ideation were higher for those with an irregular menstrual cycle than those with the regular menstrual cycle. Experiences of pregnancy and childbirth were significantly more common in women with a regular menstrual cycle than in those with menstrual cycle irregularity. Although women with a regular menstrual cycle had statistical differences in age at menarche and age at first birth compared to the menstrual cycle irregularity groups, it was not clinically different in those groups (Table 2).
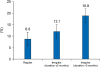
Figure 1 shows the percentage of individuals in the Not-Knowing Group with menstrual cycle irregularity. The prevalence of irregular menstrual cycles with a duration longer than 3 months (18.9%) was significantly higher than those with regular menstrual cycles (8.8%) and of irregular menstrual cycles with a duration of up to 3 months (12.1%) in the Not-Knowing Group.
3. The role of awareness of nutrition labels
In this population-based sample of women who had irregular menstrual cycles, 16.7% checked cholesterol on nutrition labels, then protein (15.9%), total fat (14.5%), and saturated fat (14.4%) compared with women who had regular menstrual cycles (not shown in table).
Logistic regression analyses were performed to examine whether the awareness of nutrition labels was associated with menstrual cycle irregularity. In comparison with the Reading Group, the OR (95% CI) for menstrual cycle irregularity was 1.37 (1.10~1.71) in the Not-Reading Group and 1.91 (1.34~2.71) in the Not-Knowing Group for model 1; the corresponding values were 1.35 (1.08~1.69) and 1.87 (1.30~2.69) for model 2, and 1.34 (1.05~1.69) and 1.63 (1.10~2.41) for model 3. The likelihood ratio test suggests these models provides an acceptable fit to the data respectively (p<.001) (Table 3).
DISCUSSION
To our knowledge, this study is the first to examine the association between awareness of nutrition labels and menstrual cycle irregularity in a nationally representative sample after controlling for relevant variables. Awareness of nutrition labels was an independent predictor of menstrual cycle irregularity, which further underscores the need to address health literacy.
In this study only 46.4% of 4,324 Korean women were categorized into the Reading Group. A recent study conducted in the USA found that 14.9% of parents reported never using a food label [18] and evaluated the impact of health literacy using a tool (Newest Vital Sign [19]) relevant to nutrition, as this tool includes an assessment of reading a food label. Unfortunately, although research on health literacy has expanded in recent years, few studies have focused specifically on how different aspects of nutrition knowledge and skills influence dietary intake and health.
Furthermore, the use of nutrition labels to assess health literacy is intuitively appealing because such labels are familiar and widespread items that constitute an important component of health management for many chronic diseases [19]. They are also useful for health promotion, since many healthy people use information on nutrition labels to help achieve health eating habits. The ability of patients to understand and use the information on nutrition labels has been investigated in many health-promotion and epidemiology research projects in the USA and other countries [20]. The association between menstrual cycle irregularity and eating habits has been demonstrated previously, and this may explain the association between menstrual cycle irregularity and awareness of nutrition labels in terms of health literacy.
There has been little agreement about whether menstrual irregularity is more strongly associated with overall or central obesity [9]. The probability of having an irregular cycle followed a “J” shaped curve and women with BMI values <20 or >30 kg/m2 had at least twice the odds of having an irregular cycle compared to normal weight women [21]. In contrast, the probability of having an irregular cycle increased linearly with increasing waist-hip ratio [21]. Obese women are more likely than non-obese women to experience menstrual cycle irregularities, including amenorrhea and oligomenorrhea [922]. Obesity is also linked to diabetes through the increased production of adipokines and cytokines, reductions in adiponectin levels, altered ectopic fat deposition, and mitochondrial dysfunction [23]. As with breast cancer, the probable mechanism underlying the increased risk of endometrial cancer associated with obesity is an increase in circulating estrogens [24]. However, because not all obese individuals develop diabetes, breast cancer, and amenorrhea, the relationship among obesity and others remains unclear.
Psychosocial factors are likely to be important, but pathophysiological mechanisms linked to disturbed ovulation patterns as well as issues of egg, embryo and endometrial receptivity have also been implicated [6]. The rate at which cholesterol is converted into estrogen in peripheral fat is higher in obese than non-obese women. Obese women are likely to exhibit a high-estrogen status. It is thought that the increase in estrogens in obese females is due to an increase in estradiol production, which is a result of an aromatase-dependent conversion of gonadal and adrenal androgens into estradiol and estrone [25]. This process occurs predominantly in fat tissue. Many studies have shown large increases in the endometrial cancer risk among postmenopausal women who take unopposed estrogen (i.e., estrogen in the absence of progesterone), as well as an increases in risk among women with higher circulating levels of total and bioavailable estrogens [24]. However, because estrogen levels vary during the menstrual cycle, few studies have used data obtained from premenopausal women [26].
Our results also have implications for pregnancy and childbirth in the context of women's health. The awareness of nutrition labels was associated with a decrease in body weight and the probability of obesity [27], and obese women are more likely than non-obese women to experience menstrual cycle irregularity [91022]. Also, maternal obesity increases the risk of preterm delivery [28], but the association between being overweight and preterm delivery is less clear [29].
There is increasing evidence of a positive correlation between snack food and/or fast food consumption and rising rates of obesity. However, consumers might not understand food package nutrition information. Nutrition knowledge is an integral component of health literacy, with low health literacy being associated with poor health outcomes [15]. Understanding food labels requires sound literacy and numeracy skills in addition to knowledge of what ingredients or nutrients are desirable or undesirable. Dietary patterns and food choices would offer more insight into the eating behaviors of amenorrheic women and those with regular menstrual cycles. Knowledge of specific dietary patterns, such as the benefits of consuming low-energy-density foods, can assist nurses, physicians, and dietitians to ensure optimal menstrual health in exercising women by allowing for optimal dietary intervention strategies without needing to alter their physical activity [30].
This study has several limitations which should be considered when interpreting these findings. First, it is unknown whether participants are checking labels only for certain foods and/or whether or not labels are being compared for different foods. Nutrition label use decreases individuals' average daily intakes of calories from total fat and saturated fat, cholesterol, and sodium in the absence of labels are compared [14]. We do not show the ascertain causality of nutritional labeling to endometrial effects of obesity such as polycystic ovary syndrome in this study. Second, the menstrual cycle characteristics were determined retrospectively rather than based on menstrual diaries, and the exact length of each cycle was not determined. Lastly, the data used in this study were based on a self-report questionnaire, and so information bias might have been present. Considerable errors can be present in self-report menstrual cycle lengths, with there being only a moderate agreement between observed and reported cycle lengths [8]. Errors were also possible due to general food label use being assessed by self-reporting rather than by the use of specific food-label components or food-label comprehension. However, it should be emphasized that the KNHANES-V data are highly reliable because they were obtained from a nationwide, population-based, and representative sample and because the analysis used sample weights and adjustments for the complex sample design of the survey [17].
CONCLUSION
In conclusion, this study provides important evidence for the association between reading nutrition labels and menstrual cycle irregularity in a nationally representative Korean population sample. This association remained statistically significant even after adjusting for covariates such as age, BMI, smoking status, alcohol intake, exercise regularity, metabolic syndrome, age at menarche, parity, and use of oral contraceptives. An awareness of nutrition labels will be particularly helpful to women with an irregular menstrual cycle. However, nutrition labeling alone is likely to offer only limited effectiveness as a strategy for improving the nutritional health of the population, and so nutrition labeling ought to be supplemented by other integrated education strategies. For example, in many individuals, improving knowledge and skills such as in nutrition label reading or identifying low fat products can be a useful implementation tool for changing choices. Widespread awareness about nutritional harms (or benefits) can also help to frame public understanding, opinions and help to generate support for healthy public policy to create healthy environments.

 XML Download