

 PDF
PDF ePub
ePub Citation
 Print
Print


INTRODUCTION
Economic evaluation of nursing service has employed various methods such as cost analysis, cost-benefit analysis (CBA), cost-effectiveness analysis, and cost-utility analysis (Newhouse, 2010; Pappas, 2008; Stephens, 2008). CBA is one of the most commonly used methods, as the result is expressed in monetary terms, which helps to explain the value of a program to decision makers. CBA has been used for evaluation of nursing service programs in clinical settings, and its outcomes expressed in economic values are often used by decision makers for budget allocation. Benefit-cost ratio (BCR) is one of the most frequently used summary indicators of CBA results. However, methods for accurate estimation of BCR remain controversial for CBA, as BCR values can change depending on the method used for estimation.
Theoretically, when we measure benefits, all plausible benefits (both positive and negative) occurring from the program must be included and estimated. This is particularly important for a management program for chronic diseases, such as hypertension, as the patients' blood pressure can fluctuate during the management program period. In that case, estimated benefits would change as blood pressure changes, which then would affect the value of the BCR. In general, estimating a benefit increase (i.e., positive benefits) is easy, but estimating a benefit decrease (i.e., negative benefits) is difficult, and it is rarely estimated. This paper examined some issues involved in benefit estimation and compared the methods for benefit estimation using a data of community-based chronic hypertension management programs in a city in South Korea.
1. Issues related to benefit estimation
Two major issues merit our attention. First, there are concerns about benefit estimations that do not account for negative benefits, which could lead to inaccurate benefit estimations. "Negative benefits" refers to worsened outcomes resulting from the program. This is in contrast to positive benefits that show improved results from the program. Negative benefits are often excluded in benefit estimates because they tend to have small values; thus, their impact on the final benefit estimation is considered minimal (Korea Centers for Disease Control & Prevention [KCDCR], 2007; Lim, 2008). In addition, it may also reflect people not wanting to report negative aspect of the program. Sometimes they are ignored in the calculation altogether because negative benefits vary depending on factors such as characteristics of the program, context in which program evaluation takes place, or societal priority in decision making. For instance, chronic programs in the community setting may not receive as high societal priority as acute programs in the hospital setting when the budget decision is made for the program implementation.
Previous studies of CBA for medical programs are incomplete as they did not include negative benefits. For example, Lim, Im, Kim and Ko (2010) analyzed the BCR of a hypertension management program of a community-based nursing care center. They estimated benefits by counting only improved cases (such as those whose hypertension improved from severe to mild) without counting the worsened cases (i.e., those whose hypertension changed from mild to severe). The percent of worsened cases during their program was about 2% of the total sample. This may appear small, but its impact on a large-scale project could be significant. Ahmed, Elbasha, Thompson, Harris and Sneller (2002) in their research on CBA of pneumococcal vaccination, they explained that to measure benefits, they used human capital approach to estimate the economical value of productivity and excluded medical care costs for unrelated diseases as a result of increased longevity due to pneumococcal vaccination. The reason of exclusion is because of the uncertainty in negative benefit measurement. Romo and Gifford (2007) in their research of BCR of music therapy in a home hospice, they estimated the music therapy's benefits as a cost saving effect, they didn't consider cost of negative effect that might be happened because patient's condition was worsen while the music therapy was going on.
Hence, estimating negative benefits of a program, especially in the management of chronic diseases such as hypertension, poses a challenge, as the patients' conditions may change during the management period. Needless to say, the instability of patients' conditions is an important factor when estimating the benefits of the programs for chronic problems. Accurate benefit estimation calls for inclusion of both positive and negative benefits and the use of a measurement method that accounts for changing patterns of patients' conditions, which can be extrapolated to similar pattern of conditions.
A second issue of concern is using a deterministic versus stochastic approach for benefit estimation. The former employs the use of percentage or number, and the latter uses transitional probability. Using appropriate measurement methods for benefit estimation is important, particularly when patient-level data are used. Usually, benefit estimation includes percentage or number of patients whose condition is changed positively during the program (Lim et al., 2010; Yim, 2008). In such cases, the benefits are estimated simply by multiplying the number of patients with the unit of benefit. Since this approach is influenced by the characteristics of the sample, application of the result is limited to that specific sample, which makes generalization of the results difficult. A need exists for finding a method that could measure the benefits more accurately and allow generalization.
The stochastic approach, which includes transitional probability, answers this need. Chin, Zhang and Rathouz (2003) used transitional probability to determine probabilities from year t-1 state to year t state in older (aged 65 or older) patients with heart failure who were in the Medicare program in the United States. By using this approach, they could identify any critical change in patterns of health perception, activities of daily living (ADLs), and instrumental activities of daily living (IADLs) according to individual characteristics such as age or sex. In addition, Peng, Ling and He (2010) used transitional probability among self-rated health status for the oldest (aged 80 or older) Chinese according to gender and age, and they were able to project the future need for long-term care. Transitional probability was also used by Diehr and Patrick (2001) to estimate future health states for older adults (aged 65 or older) who were in the Medicare program in United States. These precedents imply that the use of a stochastic approach that includes transitional probability may allow us to get more accurate benefit estimates and to apply the results more broadly.
2. Objectives of the study
In this study, we compared three different benefit calculation models to show how different benefit estimation methods affect the estimated benefits. First was a standard deterministic estimation model (SDEM) that used pre-post design; second, a repeated-measures deterministic estimation model (RMDEM) that used repeated-measures design; and third, a transitional probability estimation model (TPEM) that measured benefit based on all transitional path probabilities. The goal of this study is to demonstrate the differences in BCRs according to the benefit estimation models. Specific aims are to:
METHODS
1. Data
Data from community-based chronic hypertension management programs in a city in South Korea were used in this study. Eighty-five adult patients from the database of all visiting care service records from March to December in 2008 were selected when they met the following conditions: diagnosed hypertension with the blood pressure over 140/90 mmHg, and blood pressure was checked twice exactly at three-month intervals after the initiation of the program. Hypertension severity was estimated by the range of diastolic blood pressure: mild (Mi) hypertension was diastolic blood pressure between 90 and 92 mmHg; moderate (Mo) hypertension, diastolic blood pressure between 93 and 97 mmHg; and severe (Se) hypertension, diastolic blood pressure, 98 mmHg or over (Ahn, 1995).
1) Community-based chronic hypertension management program
Community-based chronic hypertension management program has been operated nation widely by the Korea Ministry of Health and Welfare (KMHW) since 2007, and it is a part of customized community-based visiting health care services. Specially trained visiting nurses (sometimes, including social workers, physical therapists, dietitians, and doctors as team members) provide customized visiting health care services focused on individualized health care needs. This program's aim was to improve subjects' health status, to make a community system to manage chronic diseases properly, to build the network between the social welfare and the health resources, and finally to enhance the people's health promotion and increase their quality of life. The subjects were usually elderly (65 years and over), pretty low-economic status, or households living alone. After a visiting nurse register a subject this program, she (or he) serves intensive case management care services during 8 weeks according to subject's severity and then keeps follow-up by 3 month, 6 month, or 1 year interval according to the subject's hypertension treatment adherence. The programs are including health educations for proper management of hypertension: stop-smoking and drinking, proper nutrition, importance of accurate medication, stress management, and continuous medication. Basic lab test such as blood sampling is also served. All services are provided standardized manuals developed by KMHW, for example assessment questionnaires, checklist for health behaviors, and recorded in an informatics database system.
2) Three benefit estimation models
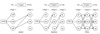
The three benefit estimation models (SDEM, RMDEM and TPEM) are illustrated in Figure 1. SDEM used a pre-post design, in which benefit was calculated as the differences between the first and third measurement points. The number of cases whose hypertension severity changed positively (e.g., from moderate to mild) was used to estimate the program's benefits in SDEM. SDEM was commonly used model to calculate benefits in cost-benefit analyses. In this model, we tried to show how BCR was affected by excluding negative benefits and using a deterministic approach.
RMDEM used a repeated-measures design, in which the benefit was measured at each measurement point. RMDEM reflects change in hypertension severity from the first to the second time point (after 3 months), and from the second to the third time point (after 6 months). In RMDEM, the benefit was estimated using the number of cases whose hypertension severity changed positively for each time point of the three time points. Recently repeated-measures design researches in nursing fields were strikingly increased. However, when a CBA research was conducted, the focus of measuring benefits was still caught in positive aspects. Although negative benefits were calculated by counting worsen cases in RMDEM, the results were still hard to allow generalization because those were based on deterministic approach. Therefore, in this model, we tried to show the limitations when the BCR was measured by not including negative benefits and not applying a stochastic approach. This result would be useful to compare with the result of SDEM or TPEM.
TPEM measured the benefit based on all at each measurement point. TPEM included all possible changes in hypertension severity (i.e., both positive and negative) in estimating benefits. TPEM was based on repeated-measures design like RMDEM. However, the BCR in TPEM was differently measured in SDEM or RMDEM because TPEM could estimate negative benefits using a stochastic approach; transitional path probabilities. Then only the results of TPEM could handle the two issues which were discussed in this study. Thus, we compared the outcomes of each model to see the differences among the models.
3) Cost and benefit measurement
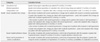
This study used the same cost and benefit measurements used by Yim (2008), as shown below. Each calculation formulas of cost and benefit measurements were shown in Table 1. But the cost and benefit for BCR of our study were recalculated for 6 months. Cost was categorized as follows. First was operational cost of the chronic hypertension management program, including staff salary, supplies and materials, and overhead cost; second was medical expenditure of outpatient clinic and drug charge for hypertension management; third was transportation cost to visit the outpatient clinic. Total cost per patient was estimated as $278.61, with operational cost $110.74, medical expenditure $158.88, and transportation cost, $9.00.
Benefit was categorized by three items of the program: saved outpatient clinic charge, saved hospital admission charge, and saved cost for prevention of severe complications of hypertension. Benefits were estimated by the severity of hypertension: mild (Mi), moderate (Mo), and severe (Se) (Ahn, 1995). According to these categories, benefit from saved outpatient clinic charge for six months was estimated to be $13.74 per patient who showed improvement from severe to mild; $1.28 per patient from severe to moderate, and $12.17 per patient from moderate to mild. The benefit from saved hospital admission charge was estimated to be $608.12 per patient who showed improvement from severe to normal, and saved cost for prevention of severe complications of hypertension was estimated to be $103.64 per patient who showed improvement from severe to normal.
2. Analyses
The frequency or percentage of patients who changed their hypertension severity at each time point was used to calculate benefits for the deterministic model (SDEM and RMDEM). Ordinal logistic regression was applied to estimate transitional probability for the stochastic model (TPEM). A non-parametric test (one-sample Kolmogorov-Smirnov test) was used to determine the differences between BCR estimates using SDEM and TPEM, and RMDEM and TPEM.
RESULTS
1. General characteristics of subject
The general characteristics of subjects included our research was follows. The average age was found 67.8 years. In aspects of sex, female was 61 (71.7%), and male was 24 (28.2%). At the first stage, the average systolic blood pressure was 155.28 (SD=15.6), and diastolic blood pressure was 99.61 (SD=23.0). At the second stage measured three months later from first stage, the average systolic blood pressure was 136.97 (SD=23.3), and diastolic blood pressure was 80.67 (SD=11.8). The last, third stage measured six months later from first stage, the average systolic blood pressure was 132.01 (SD=20.5), and diastolic blood pressure was 79.31 (SD=12.6).
2. Matrix according to severity of hypertension
The matrix according to severity of hypertension was as follows. At the first time point, the number of patients with mild hypertension was 47 (55.2%), moderate was 3 (3.5%), and severe was 35 (41.1%). At the second time point, the number with mild was 77 (90.5%), moderate was 3 (3.5%), and severe was 5 (5.8%). At the third time point, the number with mild was 76 (89.4%), moderate was 3 (3.5%), and severe was 6 (7.0%).
To avoid overestimation of benefits from saved hospital admission charge and saved cost for prevention of severe complications, we selected the cases in which blood pressure changed from severe to normal. The number was 62 (72.9%) at the second time point and 54 (63.5%) at the third time point.
3. Estimation of benefits by the three models
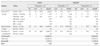
To estimate benefits using SDEM, severity changes in hypertension were estimated (Table 2). The number of patients whose hypertension severity changed from severe at the first time point to mild at the third time point was 28/35 (80.0%); from severe to moderate was 2/35 (5.7%); and from moderate to mild was 2/3 (66.7%). Notably, the number whose hypertension severity changed from severe at the first to normal at the third time point was 24/35 (68.6%). Based on these numbers of patients whose hypertension severity changed, the total benefit estimate using the SDEM was $24,955.03.
For RMDEM-based benefit estimation, the numbers of patients whose hypertension severity changed from the first to second time point were estimated as follows: severe to mild 30/35 (85.7%); severe to moderate 2/35 (5.7%); and moderate to mild 3/3 (100.0%). Notably, the number of patients whose hypertension severity changed from severe to normal was 18/35 (51.4%). Second, numbers of patients whose hypertension severity changed from the second to third time point were as follows. Severe to mild 1/5, (20.0%); severe to moderate 0/5 (0.0%); and moderate to mild 3/3 (100.0%). The number whose hypertension severity changed from severe to normal was 1/5 (20.0%). Based on this estimated hypertension severity changes, total benefit using the RMDEM was estimated as $19,932.60.
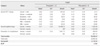
For TPEM-based benefit estimation, we estimated a transitional probability first. Ordinal logistic regression analysis controlling for subject's age and sex was employed to estimate transitional probability. As shown in Table 3, some subjects showed lower blood pressure at 3 months and 6 months compared to the initial value, but others showed higher blood pressure, changing from normal to severe hypertension (i.e., negative benefit). The total benefit (including both positive and negative benefits) using TPEM considering all possible hypertension severity changes was estimated as $18,559.47.
4. Comparison of BCRs as determined by the three models
The estimated total cost of the program was about $23,682.02 ($278.61 per patient multiplied by 85 patients). The BCRs were calculated by benefits divided by the total cost of the program per each model, and these are shown in Tables 2 and 3. The estimated net benefit by SDEM was $1,273.01, and the BCR was 1.054. However, when the same data were analyzed using RMDEM, the net benefit was $-3,749.42, and the BCR was 0.842, which was lower than the SDEM. The benefit (including negative benefits) using TPEM was $-5,122.55, and the BCR was 0.784, which was lower than both the SDEM and RMDEM.
When statistical differences of the BCRs between SDEM and TPEM, and RMDEM and TPEM were tested for homogeneity, the null hypothesis of homogeneity for each set was rejected and a statistically significant difference was shown in BCRs between the two models of each set (significant at p<.001).
DISCUSSION
CBA is used to determine economic feasibility of a program, and to guide decision making about resource allocation (Alcocer & Cueto, 2008). Many governments require CBA results before any project is launched and a policy is developed. Although accurate benefit estimation is emphasized in CBA, measurement of benefits remains a challenge. Even though no statistically significant differences in BCR were found by Stevens et al. (2006) in their study between home-based vs. hospital-based support groups, they noted invisible benefits that they could not capture. Hence, it appears to be prudent to find a method that could estimate benefits more fully and accurately for economic evaluation of a program.
In this study, we compared three methods for estimating benefits. Since SDEM considered only the positively improved cases from the first to the third time point, this approach could lead to inaccurate estimation of benefits. Ignoring changes occurring between time points and excluding worsened cases could lead to overestimation of the benefits. RMDEM is more refined than SDEM. Because this model traces changes between time points, the number of patients whose hypertension severity changed was more accurately calculated than in SDEM. For example, in SDEM, the number of patients in our study whose hypertension severity changed from severe at the first time point to normal at the third time point was 24, but using RMDEM, the same group numbered only 19 (18 at second time point plus 1 at the third time point, as shown in Table 2). Consequently, the difference of 5 patients (i.e., 24 minus 19) lowered the value of estimated benefits of saved hospital admission charges and saved costs for prevention of severe complications of hypertension.
Even though RMDEM calculated the benefit more accurately than did SDEM, its limitation was using only positively improved cases, not including negative benefits. TPEM overcame this limitation and accounted for possible hypertension severity changes in between time points and both positive and negative benefits. As shown in Tables 2 and 3, the probability of the hypertension severity change from severe to normal from the first point to the third point was estimated as .69 (24/35) in SDEM. But the probabilities of RMDEM and TPEM that compared between first and second point; and second and third point were .51 (18/35) and .20 (1/5); and .51 and .41 respectively. Also, unlike in SDEM and RMDEM, the probability of hypertension severity change from normal to severe was also estimated as .05. That means that patients' hypertension severity varied widely during the program, which provides a rationale for the need for closer attention to both positive and negative benefits to get more accurate estimation of total benefits.
In this study, the differences of estimated benefits according to benefit estimation models were compared. The BCR was over 1 when SDEM was used alone, which could lead to favorable recommendation for implementation of the program. However, when other methods (RMDEM and TPEM) were used to estimate benefits of the same program, the estimated BCR was lower than 1. That means the estimated total benefit from the program was less than the cost of the program, which may lead decision makers not to implement that program.
The statistically significant difference found in this study in BCRs between the two models of each set models (SDEM and TPEM; RMDEM and TPEM) may be explained by the bi-modal distributions of TPEM including both positive and negative benefits. This indicates one group had positive status transitional probability and the other group had negative status transitional probability. Hence, the total negative benefits had to be deducted from total positive benefits. That was why the estimated benefit using TPEM was lower than that using SDEM or RMDEM. This comparison suggests that TPEM is a more accurate model for benefit estimation of a program because it considers both positive and negative benefits measured at multiple points of time, and the results may apply to other similar situations.
CONCLUSION
BCRs were different depending on the methods used for the measurement of benefits. Of the three methods, TPEM showed the most realistic BCR, as it traced possible paths of changing status in between time points and it accounted for both positive and negative benefits. These different and conflicting evaluation results demonstrated that the method to estimate the benefits critically affected the estimated BCRs, and decision making about a program. TPEM may be used for more accurate estimation of the benefit of a program and the higher quality of decision making about allocation of social and financial resources. Hence, TPEM may be used for more realistic estimation of the benefit of a program, which may lead to more reality-based decision making about resources allocation.
 XML Download