

 PDF
PDF ePub
ePub Citation
 Print
Print


INTRODUCTION
Recent works suggest a certain cutoff of elevated 1-hour plasma glucose during oral glucose tolerance test (OGTT) is a strong predictor of future risk for type 2 diabetes, suggesting the role of 1-hour post-challenge glucose in the alteration of glucose metabolism status as well as 2-hour post-challenge glucose [1,2]. A very recent work reported that elevated 1-hour post-load plasma glucose level identifies subjects with normal glucose tolerance but subclinical atherosclerosis measured by carotid intima-media thickness [3]. These results imply the importance of acute post-challenge glucose excursions in the development of atherosclerosis.
Arterial stiffness is an independent predictor of cardiovascular morbidity and mortality [4,5]. In general, stiffer arteries cause an early return of the pressure waves from reflectance sites and can be detected as an increase in the pulse wave velocity (PWV). Recently a simple device to measure brachial-ankle PWV (baPWV) by recording the pulse volume at the upper arms and the ankles, has been developed [6]. baPWV correlates well with carotid PWV (heart to carotid) and aortic PWV (carotid to femoral PWV) [7,8], and age, smoking, lipid profiles and hypertension are the known factors to affect arterial stiffness [9].
A body of evidence suggests that atherosclerosis develops even from the prediabetic stage, implying the importance of early detection of subclinical atherosclerosis in much earlier period than the stage in which overt atherosclerosis develops in diabetic stage [10,11]. Furthermore, there is evidence that the metabolic alteration in type 2 diabetes and impaired glucose metabolism are associated with increased arterial stiffness [11,12]. We analyzed the relationship of baPWV with fasting and post-challenge plasma glucose levels in different time points during OGTT in apparently healthy Korean subjects, and also compared these metabolic parameters in subjects with different glucose tolerant status.
METHODS
The study subjects
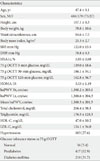
A total of 663 subjects (mean age, 47 years; ranged 30-78 years old) who performed 75 g OGTT in Department of Endocrinology and Metabolism, Kangbuk Samsung Hospital, Seoul, Korea, between April to October 2003, were enrolled in the study. All of the participants were free of history for type 2 diabetes and were referred to the Endocrinology Department due to elevated fasting blood glucose (≥ 100 mg/dL) detected in Health Check-up Program in Health Promotion Center at Kangbuk Samsung Hospital. The glucose tolerance status of a subject was determined according to the criteria from American Diabetes Association [13]: normoglycemia (fasting glucose < 100 mg/dL, post-challenge 2 hour-glucose < 140 mg/dL), prediabetes (impaired fasting glucose: 100 ≤ fasting glucose < 126 mg/dL, impaired glucose tolerance: 140 ≤ post-challenge 2-hour glucose < 200 mg/dL) and diabetes (fasting glucose ≥ 126 mg/dL or post-challenge glucose ≥ 200 mg/dL).
Subjects were excluded from the study if they had a history of cardiovascular disease including peripheral atherosclerosis, chronic gastrointestinal diseases associated with malabsorption, chronic pancreatitis, history of any malignant disease, history of alcohol or drug abuse, liver or kidney failure, and treatments able to modify glucose metabolism, such as steroid. The subjects with history of hypertension were included in the analyses and the presence of hypertension was defined when the subject was taking anti-hypertensive medication or measured systolic or diastolic blood pressures were same or above 140/90 mm Hg [14]. Written informed consent was obtained from each participant and the study protocol conforms to the ethical guidelines of the 1975 Declaration of Helsinki as reflected in a priori approval by the institution's Human Research Committee.
Laboratory assessment
Blood pressures (BP) were taken with a standardized sphygmomanometer after at least 5 minutes of rest. The heights and weights of the subjects were measured with individuals dressed in an examination gown wearing no shoes. The body mass index (BMI) was expressed as the weight in kilograms divided by the height in meters (kg/m2). The waist circumference was measured in the standing position, at the level of umbilicus by a single examiner.
Blood samples were collected after at least 12 hours of fasting. An enzymatic colorimetric test was used to measure total cholesterol (TC) and triglyceride concentrations. The selective inhibition method was used to measure the level of high density lipoprotein cholesterol (HDL-C), and a homogeneous enzymatic calorimetric test was used to measure the level of low density lipoprotein cholesterol (LDL-C) (Advia 1650 Autoanalyzer; Byer Diagnostics, Leverkusen, Germany).
After 8 hours of overnight fasting, a 75 g OGTT was performed with 0, 30, and 120 minutes sampling for plasma glucose and fasting insulin. Blood glucose levels were determined using the hexokinase method (Advia 1650 Autoanalyzer) and serum insulin concentration was determined with an immunoradiometric assay (Biosource, Fleurus, Belgium); this assay had intra- and inter-assay coefficients with a variation of 2.1-4.5% and 4.7-12.2%, respectively.
The subjects' insulin resistance status was calculated by using the homeostatic model assessment-insulin resistance (HOMA-IR) [15]. HbA1c was measured by high performance liquid chromatography using the Variant™ II Turbo (Bio-Rad Laboratories, Hercules, CA, USA). The methodology was aligned with the Diabetes Control and Complications Trial (DCCT) and National Glycohemoglobin Standardization Program (NGSP) standards [16].
Assessment of arterial stiffness
Pulse-wave velocity were measured using a Waveform analyzer (VP-1000; Colin Co., Komaki, Japan), after at least 5 minutes rest. Two indices such as baPWV were obtained using a volume-plethysmographic apparatus by simultaneous BP and waveform measurements on all four limbs along with ECG and phonogram tracings. PWV was automatically calculated by time-phasic analysis using the following formula: distance between two sites divided by pulse wave transit time. baPWV was measured from the ascending point of right brachial pulse volume recorder to the ascending point of each ankle pulse volume recorder. The distance between the right brachium and ankle was estimated based on body height and derived from statistical studies [17]. All procedures took about 5 minutes. Mean baPWV value was calculated with (rt baPWV + lt baPWV)/2.
Statistical analysis
All analyses were carried out with SPSS version 13.0 (SPSS Inc., Chicago, IL, USA). Bivariate correlation analyses were performed to analyze the relationships between mean baPWV and the parameters and one-way ANOVA test was used to compare the mean values of the parameters between different glucose tolerance groups. Multiple regression analysis with backward method was performed to investigate the determinants for baPWV among the post-challenge glucose levels during 75 g OGTT after adjustment for the confounding variables. P value less than 0.05 was considered statistically significant.
RESULTS
Comparisons of the metabolic parameters according to glucose tolerant status
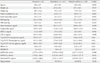
When the mean values of parameters are compared between the different glucose tolerance groups, waist circumference and BMI showed significantly higher mean values and HDL-C showed significantly lower mean value in diabetes subjects compared with non-diabetic groups (Table 2).
For HOMA-IR, diabetes subjects showed significantly higher value compared with prediabetes subjects (3.5 ± 1.4 vs. 2.8 ± 1.0, P < 0.01) (Table 2). For baPWV values, mean values showed significantly higher values in diabetic subjects compared with prediabetes group.
There was no difference in the proportion of subjects with hypertension among the different glucose tolerance groups (Table 2).
Relationship between baPWV and metabolic parameters
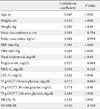
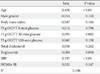
In bivariate correlation analyses between baPWV and other parameters, mean baPWV showed significant positive correlations with age, blood pressure, TC, LDL-C, 30-minute and 120-minute post-challenge glucose levels and mean HbA1c levels, and negative correlations with weight and height (Table 3). In multiple regression analyses with backward method, age, 30-minute post-challenge glucose, triglyceride and systolic blood pressure were the significant determinants for baPWV values after adjustment for confounding variables (Table 4).
DISCUSSION
In this study performed in subjects without a history of type 2 diabetes, who were referred due to elevated fasting blood glucose in a health check-up program, 30-minute post-challenge glucose levels in 75 g OGTT showed the most significant association with baPWV values, reflecting acute glucose excursion after glucose challenge affected arterial stiffness mostly other than 120-minute glucose. These significances were consistent even after adjustment for confounding factors, such as age, blood pressure and lipid profile, suggesting the association of 30-minute glucose could be important effector for arterial stiffness.
Cardiovascular disease is one of the important causes for mortality in patients with diabetes mellitus, and the measurement method for the vascular complication is very important. The importance for the assessment of arterial stiffness lies in its predictability for subclinical atherosclerosis and the prevention of future cardiovascular events [18]. Arterial stiffness could be measured in many ways, including distensibility, pulse wave velocity and augmentation index. The arterial PWV, especially of the aorta, has emerged as an important independent predictor of cardiovascular events, and it is reflected with the speed with which the arterial pressure wave progresses through the arterial tree, and this increases with increasing vascular stiffness [9]. Increased PWV occurs with a range of estabilished cardiovascular risk factors, including age, hypercholesterolemia, smoking, and sedentary life style [18,19]. Diabetic patients have increased arterial stiffness, and compromised PWV have been demonstrated even before the onset of diabetes, in patients with impaired glucose tolerance [20]. Healthy offspring of type 2 diabetes patients have a higher PWV than matched controls [12,20]. Arterial stiffness in diabetes is related to prevalent CVA, and has shown to be an independent predictor of coronary heart disease [21]. In the Hoorn study, baseline distensibility did not predict mortality in subjects with impaired glucose tolerance during a follow-up period of 6.6 years [11]. In contrast, PWV seemed to have reasonable predictable value for mortality in patients with impaired glucose tolerance and type 2 diabetes mellitus [12].
The importance of post-challenge glucose levels during OGTT other than 2-hour glucose levels, such as 30-minute or 1-hour glucose level, in glucose metabolism has not been clearly defined. Although glucose tolerance status is defined mainly by fasting and post-challenge 2-hour glucose levels, a few studies have suggested that a certain cutoff value of 1-hour glucose during OGTT can stratify subjects with normal glucose tolerance (NGT) into categories of low or high risk for development of type 2 diabetes [1,2]. In a recent study by Succurro et al. [3], NGT subjects with a 1-hour post-load glucose ≥ 155 mg/dL have an atherogenic profile including intima-media thickness similar to IGT subjects, suggesting the association of post-challenge glucose levels other than 2-hour glucose level with development of atherosclerosis and diabetes mellitus. Although the role of other post-challenge glucose levels other than 2-hour glucose levels during OGTT in the relationship with development of diabetes or atherosclerosis is not clearly defined, it is evident that acute hyperglycemia in response to oral glucose load suppresses endothelium-dependent vasodilation, increases oxidative stress, increases inflammatory response in vasculature, all of which are processes involved in atherogenesis [22].
In our study, post-challenge 30-minute glucose level showed significant correlation with baPWV values and this significance was significant even after adjustment for cardiovascular risk factors. This significance was stronger than those with fasting or 2-hour post-load glucose levels, implying the association of acute hyperglycemia after oral glucose loading with arterial stiffness. Large epidemiological studies, such as the Diabetes Epidemiology: Collaborative analysis Of Diagnostic criteria in Europe (DECODE) Study, have shown a stronger association of post-challenge glycemia with cardiovascular outcomes compared with fasting glucose level and higher glucose levels after glucose challenge [23,24]. In the study by Kasayama et al. [7], 2-hour post-load glucose level in OGTT showed weak but significant correlation with PWV levels in male subjects. In another study performed in type 1 diabetes patients, acute hyperglycemia during hyperglycemic clamp test showed significant correlation with increased baPWV, emphasizing the importance of post-load glucose control in the development of atherosclerosis [5]. These results from the previous studies are similar with our study result in that post-load hyperglycemia is deleterious for the vessel, but differ from our study in that our study showed the association of rapidly increased post-load glucose earlier than 2 hours with arterial stiffness. Further well-designed studies are warranted to define the significant role of 30-minute or 1-hour post-load glucose levels in the prediction of type 2 diabetes in NGT subjects and in the development of atherosclerosis.
Our study has limitations. As these study subjects were referred to Endocrinology Department due to the detection of at least one time of high fasting glucose level, all of the study subjects could be categorized as having impaired fasting glucose. This could be the reason for the absence of difference in mean baPWV between subjects with normoglycemia and prediabetes. However, significantly increased baPWV in diabetes subjects compared with prediabetes subjects show the significantly affected arterial stiffness according to glucose tolerant status.
In conclusion, our data suggests the association of post-challenge 30-minute glucose level during OGTT other than 120-minute or fasting glucose levels with arterial stiffness in Korean subjects in whom 75 g OGTT was performed due to fasting hyperglycemia. This result warrants the further researches to clarify the significance of acute glucose excursions in the development of atherosclerosis.
 XML Download