

 PDF
PDF ePub
ePub Citation
 Print
Print


INTRODUCTION
Increased insulin resistance and reduced insulin secretion have been identified as key players in the pathogenesis of type 2 diabetes mellitus (T2DM) [1,2]. In particular, the reduced insulin secretion resulting from beta cell dysfunction is altered more dynamically compared with that of the insulin resistance seen in the development of disease to non-diabetic hyperglycemia and T2DM, and this is assumed to be the most direct and most important cause of clinical hyperglycemia [3-9].
The origin of the substantial elevation of blood glucose in beta cell dysfunction indicates that significant functional changes in beta cells may occur at a specific period of glucose metabolism impairment, and thus, it is necessary to evaluate accurately both the pattern and clinical significance of this period. However, the current diagnostic criteria for T2DM were established based on the risk of developing chronic microvascular complications [10-15]. Accordingly, there is no clinical relationship between the time point at which significant change in pancreatic function occurs and the current diagnostic criteria. Therefore, the current criteria regarding diabetes mellitus cannot be considered to represent a direct index of beta cell dysfunction.
Currently, a relatively complex technique is required to evaluate human insulin secretion. However, there have not been a great number of relevant studies conducted to evaluate this technique. According to several studies conducted with Caucasian and Hispanic subjects, reduced insulin secretion is assumed to begin in patients who can be categorized as having normal glucose tolerance (NGT) on the basis of current diagnostic criteria [16-18]. This indicates that beta cell dysfunction progresses, causing abnormal glucose metabolism, prior to the 'prediabetes' period of the current criteria.
In particular, according to several recently conducted studies, increased insulin resistance is not marked, and the beta cell capacity is relatively lower in Asian people, including Koreans, compared to those of Western individuals [19-22]. It is therefore assumed that insulin secretory dysfunction, rather than insulin resistance, may play a more important role in the progression of T2DM. However, there have been no systematic analyses conducted thus far to assess the changes in insulin secretion depending on the changes in glucose tolerance in Koreans.
Given this background, we conducted this study to assess changes in early phase insulin secretion depending on the glucose tolerance statuses of Koreans with non-diabetic hyperglycemia and those with early stage T2DM without a long disease history of hyperglycemia, with no history of medication that would affect glucose tolerance with well-preserved glucose metabolism.
METHODS
Subjects
Among patients who visited the Department of Endocrinology and Metabolism at the Kyung Hee University Hospital during a period ranging from May 2003 to December 2006 and underwent 75 g oral glucose tolerance tests (OGTT), this study included 873 subjects who had been diagnosed with hyperglycemia in the previous three months and who had no history of medication that would affect glucose tolerance. To minimize the outside influences on insulin secretion and insulin resistance that might occur due to the duration of, medication for, or other interventions related to hyperglycemia, all subject recruitment was designed to place a limitation on the time point at which hyperglycemia was diagnosed and the types of medications prescribed. Before the study was initiated, the protocols for this study were approved by the Institutional Review Board of Kyung Hee University Hospital.
Methods
Clinical characteristics
Prior to the 75 g OGTT, patients' past medical histories, family histories, and smoking histories were investigated. Basal anthropometry was evaluated to determine patients' height, weight, body mass index (BMI), abdominal circumference (AC) and resting blood pressure. Blood sampling and analyses were conducted to measure total cholesterol (TC), high density lipoprotein cholesterol (HDL-C), low density lipoprotein cholesterol (LDL-C), triglycerides (TG) and glycosylated hemoglobin (A1c).
OGTT
OGTT was conducted by measuring plasma glucose (Glc0), insulin (Ins0), and C-peptide (Cpep0) concentration after a minimum eight-hour fasting period. After oral glucose loading, plasma glucose concentrations were measured at 30, 60, 90, and 120 minutes, and serum insulin (Ins30) and C-peptide (Cpep30) concentrations were measured 30 minutes after glucose loading. On the basis of the OGTT results, all study subjects were categorized into three groups: NGT, prediabetes (preDM) and overt T2DM. The diagnostic criteria were based on those established by the American Diabetes Association [14].
Biochemical analysis
Serum TC and TG levels were determined via enzymatic assays, and serum HDL-C was determined via a precipitation assay. LDL-C was determined using a homogenous assay, and HbA1c was measured via high-performance liquid chromatography (G7; Tosoh Co., Tokyo, Japan). Plasma glucose was determined via the hexokinase method using a glucose analyzer (Automatic Analyzer; Hitachi, Tokyo, Japan), and plasma insulin and C-peptide levels were measured using an immunoradiometric assay (Insulin: Insulin Riabead II, C-peptide: Daiichi III; both SRL, Tokyo, Japan).
Calculation of insulin secretion and insulin resistance indices
Based on the OGTT results, indices for insulin secretion including the insulinogenic index (IGI), acute C-peptide response (ACR) and homeostasis model assessment β (HOMAβ), as well as insulin resistance indices including the homeostasis model assessment-insulin resistance (HOMA-IR) and QUICKI were calculated based on formulas described below [23-26]. Among these, IGI and ACR were used to measure the changes in insulin and C-peptide concentrations depending on the changes in plasma glucose concentration measured 30 minutes prior to and after oral glucose loading. Therefore, these measurements were utilized in the current study as an indicator for early insulin secretion.
IGI = (Ins30 - Ins0) / (Glc30 - Glc0)
ACR = (Cpep30 - Cpep0) / (Glc30 - Glc0)
HOMAβ = (20 × Ins0) / [(Glc0 / 18) - 3.5]
HOMA-IR = (Ins0 × Glc0) / 405
QUICKI = 1 / [Ln(Ins0) + Ln(glc0 / 18)]
Ins0, fasting plasma insulin (mIU/L); Ins30, insulin 30 minutes after glucose intake (mIU/L); Cpep0, fasting plasma C-peptide (ng/mL); Cpep30, C-peptide 30 minutes after glucose intake (ng/mL); Glc0, fasting plasma glucose (mg/dL); Glc30, plasma glucose 30 minutes after glucose intake (mg/dL)
Data analysis
Among the NGT, preDM and T2DM groups, comparisons were conducted to determine the differences in clinical characteristics, insulin secretions and insulin resistance indices. Adjustments were made for the covariates of age, BMI and AC, and then another comparison was conducted.
After these comparisons were made, all study subjects were divided according to 1) fasting glucose (F1: Glc0 ≤ 86 mg/dL, n = 72; F2: Glc0 87-95 mg/dL, n = 76; F3: Glc0 96-100 mg/dL, n = 81; F4: Glc0 101-105 mg/dL, n = 70; F5: Glc0 106-110 mg/dL, n = 81; F6: Glc0 111-114 mg/dL, n = 73; F7: Glc0 115-119 mg/dL, n = 68; F8: Glc0 120-126 mg/dL, n = 71; F9: Glc0 127-136 mg/dL, n = 63; F10: Glc0 137-148 mg/dL, n = 73; F11: Glc0 149-184 mg/dL, n = 73; F12: Glc0 ≥ 185 mg/dL, n = 72), 2) post loading 2 hour plasma glucose (P1: Glc120 ≤ 112 mg/dL, n = 76; P2: Glc120 113-132 mg/dL, n = 71; P3: Glc120 133-145 mg/dL, n = 73; P4: Glc120 146-161 mg/dL, n = 72; P5: Glc120 162-180 mg/dL, n = 74; P6: Glc120 181-200 mg/dL, n = 75; P7: Glc120 201-226 mg/dL, n = 70; P8: Glc120 227-246 mg/dL, n = 71; P9: Glc120 247-273 mg/dL, n = 73; P10: Glc120 274-305 mg/dL, n = 74; P11: Glc120 306-353 mg/dL, n = 73; P12: Glc120 ≥ 354 mg/dL, n= 71) and 3) glycosylated hemoglobin (H1: A1c ≤ 5.0%, n = 67; H2: A1c 5.1-5.2%, n = 51; H3: A1c 5.3-5.4%, n = 68; H4: A1c 5.5-5.7%, n = 96; H5: A1c 5.8-5.9%, n = 78; H6: A1c 6.0-6.1%, n = 59; H7: A1c 6.2-6.4%, n = 77; H8: A1c 6.5-6.8%, n = 70; H9: A1c 6.9-7.4%, n = 62; H10: A1c 7.5-8.2%, n = 66; H11: A1c 8.3-10.0%, n = 68; H12: A1c ≥ 10.1%, n = 69). According to these parameters, each group was subdivided into 12 subgroups, each of similar size.
Changes in early phase insulin secretion were evaluated among these subgroups. However, in comparing early phase insulin secretion according to variations in glucose tolerance, the possibility exists that many variations could occur, depending on individual differences in insulin resistance. Based on previous studies, comparisons were conducted using the values calculated by dividing IGI and ACR by HOMA-IR (IGI/HOMA-IR, ACR/HOMA-IR) [16,27].
Statistical analysis
Statistical analysis and data management were conducted using the SPSS version 13.0 (SPSS Inc., Chicago, IL, USA). In order to confirm the statistical significances among subgroups, Student's t-test, one-way ANOVA, and the chi-square tests were used. To adjust for the effects of covariates, such as age, gender, BMI, and AC, the ANCOVA model was utilized. In order to confirm the relationships among IGI/HOMA-IR, ACR/HOMA-IR and the clinical variables associated with glucose tolerance, a linear regression analysis was conducted, and multiple linear regression analysis was performed to adjust for the effects of confounders.
RESULTS
Clinical characteristics
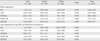
Among the 873 enrolled subjects, 102 were diagnosed with NGT, 307 were diagnosed with preDM and 464 were diagnosed with T2DM according to OGTT. Characteristics were compared among the three groups. Compared with the NGT group, subjects diagnosed with preDM and T2DM has significantly higher values for the majority of the variables such as age, BMI, AC, systolic and diastolic BP, TC, HDL-C, TG, A1c, Ins0 and Glc0. These parameters evidenced a progressive tendency to increase as glucose tolerance was aggravated (Table 1). However, we noted no significant differences in gender or LDL-C among the three groups.
Comparisons of the insulin secretion and insulin resistance indices depending on the variations in glucose tolerance
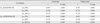
Compared with the NGT group, indices for insulin secretion such as IGI, ACR and HOMAβ were significantly reduced in the preDM and T2DM groups. As glucose tolerance aggravated, these indices progressively decreased (Table 2). Insulin resistance indices also evidenced progressive and significant variations depending on the aggravation of glucose tolerance. Compared with that of the NGT group, the HOMA-IR was significantly increased in the preDM and T2DM groups and the QUICKI was significantly reduced. After adjustment for covariates such as age, BMI and AC, the statistical significances did not change.
IGI/HOMA-IR and ACR/HOMA-IR
Early phase insulin secretion indices, such as IGI/HOMA-IR and ACR/HOMA-IR, for which the indices for insulin resistance were adjusted, were also noted to change significantly depending on glucose tolerance status. After linear regression analysis, the log-transformed values of IGI/HOMA-IR and ACR/HOMA-IR had higher correlation coefficients with Glc0, Glc120, and HbA1c. Following adjustment for various confounders via multivariate analysis, no changes in the statistical significances were noted (Table 3).
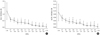
The changes in early phase insulin secretion depending on Glc0
Subjects were divided into 12 subgroups according to Glc0, by which the changes in IGI/HOMA-IR and ACR/HOMA-IR depending on Glc0 were assessed. As a result, according to the increased value of Glc0, IGI/HOMA-IR and ACR/HOMA-IR displayed a tendency to gradually decrease (Fig. 1).
Comparisons were made based on the F1 group and demonstrated that the decreased IGI/HOMA-IR values were significantly different from those of subgroup F3. A comparison was also conducted based on the F2 group, and a statistically significant difference from subgroup F4 was noted (Fig. 1A). On the other hand, in the case of ACR/HOMA-IR, a significant difference from subgroup F4 was noted in both the F1 and F2 groups (Fig. 1B). In the F4 subgroup, the mean value of IGI/HOMA-IR was 29.4% for F1 and 61.1% for F2, and the mean value of ACR/HOMA-IR was 36.3% and 57.9%, respectively. These results show that early phase insulin secretion was reduced by approximately 4% when Glc0 was increased by 1 mg/dL in subgroups F1 to F4.
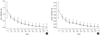
The changes in early phase insulin secretion depending on Glc120
The subjects were divided into 12 subgroups depending on Glc120, by which the changes in IGI/HOMA-IR and ACR/HOMA-IR were evaluated depending on the increased value of Glc120. As a result, IGI/HOMA-IR and ACR/HOMA-IR evidenced a gradual tendency to decrease (Fig. 2).
As compared with the P1 group, the reduced IGI/HOMA-IR values were statistically significantly different from those of subgroup P3. A comparison was also conducted based on the P2 group, and this demonstrated a statistically significant difference from that of the P4 subgroup (Fig. 2A). Based on the P1 group with regard to ACR/HOMA-IR, the decreased ACR/HOMA-IR value reached statistical significance from subgroup P3. Based on subgroup P2, ACR/HOMA-IR was decreased to a statistically significant from subgroup P4 (Fig. 2B). In subgroup P4, the mean value of IGI/HOMA-IR was 33.2% for P1 and 53.6% for P2, the mean value of ACR/HOMA-IR value was 27.5% and 44.8%, respectively. These results show that early phase insulin secretion was reduced by approximately 1.5% when Glc120 was decreased by 1 mg/dL in subgroups P1 to P4.
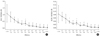
The changes in early phase insulin secretion depending on A1c
The subjects were divided into 12 subgroups depending on A1c, by which the changes in IGI/HOMA-IR and ACR/HOMA-IR were evaluated depending on the increased A1c value. As a result, according to the increased A1c values, IGI/HOMA-IR and ACR/HOMA-IR tended to gradually decrease (Fig. 3).
Based on subgroup H1, the decreased IGI/HOMA-IR value reached statistical significance with respect to subgroup H4. Based on the H2 subgroup, a statistically significant difference was noted with respect to subgroup H4 (Fig. 3A). Based on the H1 group with regard to ACR/HOMA-IR, the decreased ACR/HOMA-IR value reached statistical significance from subgroup H5. Based on subgroup H2, ACR/HOMA-IR was decreased to a statistically significant from subgroup H4 (Fig. 3B). In subgroup H4, mean IGI/HOMA-IR was 39.4% for H1 and 51.4% for H2, and mean ACR/HOMA-IR values were 44.0% and 53.6%, respectively. These results show that early phase insulin secretion decreased by approximately 10% when A1c was increased by 0.1% in subgroups H1 to H4.
DISCUSSION
In this study, we assessed the changes in early phase insulin secretion depending on variations in glucose tolerance based on the results of OGTT, performed in a relatively large Korean sample. In particular, subjects without a medication history that would affect glucose tolerance and in whom the duration of hyperglycemia was within a selected duration. Attempts were made to minimize the confounders and to reflect the results that were closest to the actual effects of the diseases. Additionally, to effectively adjust for the effects of insulin resistance on individual changes in insulin secretion, the changes in beta cell dysfunction could be accurately confirmed with the use of IGI/HOMA-IR and ACR/HOMA-IR [16,27].
As a result, in subjects with a 100 mg/dL Glc0, 145 mg/dL Glc120 and > 5.8% A1c, early phase insulin secretion was reduced to < 50% of that of the control group. Compared with the changes measured thereafter, the changes in insulin secretion during this period were the most abrupt. Based on current diagnostic criteria, people who were identified as having NGT exhibited a dramatic deterioration of beta cell function. Based on the assumption that substantial elevation of blood glucose concentration is dependent on beta cell dysfunction, these results show that a preventive approach to beta cell dysfunction might be mandatory prior to the period we currently refer to as 'prediabetes'.
The current diagnostic criteria for T2DM are based on the time point at which the risks of developing microvascular complications increase in association with fasting plasma glucose, based on the results of a study which included Pima Indians, Egyptians and the National Health and Nutrition Examination Survey III [10-14]. Therefore, strictly speaking, these criteria may prove useful in predicting the occurrence of complications. However, they do not directly reflect beta cell dysfunction, a rudimentary pathophysiological mechanism of T2DM. The management aim of T2DM is to prevent diabetes-related chronic complications. Accordingly, a sufficient degree of validity with the current criteria appears to exist. However, under the definition that 'prediabetes' is a period during which the risks of developing T2DM are increased and thus preventive efforts are accordingly necessary, the results of the current study illustrate that the current 'prediabetes' criteria should be modified. On the other hand, according to the International Expert Committee, the use of A1c for the diagnosis of T2DM, has been recommended. In association with this, and in consideration of the results of the current study, the A1c reference value can be proposed as an assessment criterion for subjects at high risk for T2DM [28].
Our study had several limitations. The study was conducted following the recruitment of a relatively large number of subjects, but was conducted at only one center. Thus, the extension of the results of our subject population to all Korean people in association with the pathophysiology of T2DM is somewhat problematic. Also, in this study, the subjects were cross-sectionally analyzed; accordingly, no prospective analysis could be conducted to assess individual changes depending on disease progression. The indices used in this study, IGI, ACR, HOMA-IR, IGI/HOMA-IR and ACR/HOMA-IR are not gold standards for the evaluation of early phase insulin secretion and insulin resistance. Errors associated with these uses, then, cannot be eliminated. Additionally, the measurements for insulin secretion used in the current study were based on oral glucose loading; therefore, the possibility remains that errors may have been generated depending on the effect of incretin.
Despite these limitations, this study is significant in that it provides baseline information by evaluating the effects of changes in decreased early phase insulin secretion on the pathogenesis of T2DM in Koreans. Furthermore, from the perspective of beta cell dysfunction, a new consideration of a high-risk group for T2DM is necessary. It has been well-established that a variety of studies are necessary to demonstrate the validity of this definition. Furthermore, it has been determined that the effects of incretin on abnormality in the early stage in association with glucose metabolism are not relatively greater and may have no serious effects on the results of the current study [29]. In Korea, large-scale, prospective, multi-center cohort studies such as the Korean National Diabetes Project (KNDP) are currently underway. It is, therefore, expected that the pathophysiology of early-phase diabetes in the Korean population will be a subject for a great deal of future discussion.
 XML Download