

 PDF
PDF ePub
ePub Citation
 Print
Print


Introduction
It has generally been accepted that body fat mass is one of the strongest predictors of bone mineral density (BMD)1), but the precise mechanism which explains this relationship remains unclear. The previous studies have shown that increased aromatization of androgen to estrogen2), decreased sex-hormone binding globulin3), augmentation of bone formation by high circulating levels of insulin4), mechanical effects of increased weight bearing5), and leptin6) could affect BMD in obese patients.
Leptin is an adipocyte-derived hormone produced by the ob gene7) and binds to its receptor in the hypothalamus, where the hormone acts to decrease fat mass through suppressing appetite with a reduction in food intake and enhancing energy consumption by a feedback mechanism8). This mechanism explains a positive correlation between plasma leptin level and body fat mass9). In addition to its adipostatic function, recent evidence suggests that leptin directly stimulates osteoblastic differentiation. In a previous experiment using immortalized human marrow stromal cell lines, human recombinant leptin stimulated differentiation of stromal cells to osteoblasts while inhibiting their differentiation to adipocytes10). Administration of leptin to leptin deficient ob/ob knockout mice caused an increase in the number of osteoblasts at the endocortical surface11). Previous studies have demonstrated that leptin has a positive effect on bone metabolism by enhancing osteoblast formation and inhibiting osteoclast generation12). Leptin given peripherally increased bone strength in mice and also increased proliferation of osteoblasts in vitro. Direct peripheral action of leptin on bone seems to be, therefore, rather anabolic13). However, the results are contradictory, when leptin is administered centrally. Ducy et al. found that mice with leptin deficiency (ob/ob) and leptin receptor deficiency (db/db) showed increased BMD, and the increase was reversed by intracerebroventricular administration of leptin in ob/ob mice14). This indirect action of leptin against bone formation by involving the hypothalamic relay was also documented in consecutive study15). A recent animal study has shown that ob/ob mice have low sympathetic activity, suggesting that the central effect of leptin on bone is mediated by the sympathetic nervous system16).
The exact role of circulating leptin levels on BMD in human is still contradictory. A previous study has shown that adult patients with congenital leptin deficiency have low BMD values despite their increased fat mass17). Goulding and Taylor have demonstrated that age-adjusted total body BMD values were positively correlated with plasma leptin in postmenopausal femles18). More recent clinical trial showed that plasma leptin levels are associated with BMD and the presence of vertebral fractures in postmenopausal women19).
There have been clinical reports supporting the negative effect of letpin on BMD. Increase in serum leptin concentration may reduce bone formation and decrease BMD in adult men20). Inverse correlation between levels of leptin and BMD in chronic liver disease was documented21).
Diabetes mellitus (DM) is a metabolic disease with a variety of morbidities and osteoporosis is one of the most important metabolic bone diseases affecting life quality. Osteopenia and osteoporosis in type 1 DM is rather a universal finding, in type 2 DM, however, a variety of adipocyte hormones and beta cell hormones are known to be interrelated, which contribute to bone microenvironment22). The leptin-BMD relationship seems, therefore, more complex. In clinical studies of patients with diabetes mellitus, Watanabe et al. demonstrated that a decrease in serum leptin levels by activation of peroxisome proliferator-activated receptor γ (PPARγ) is associated with preventing bone loss in type 2 diabetic patients23). Negative effect of leptin on bone mass after adjustment of fat mass was documented in the study of patients with type 1 diabetes24).
To understand the complex influence of leptin on bone mass in diabetic patients, we investigated the relationship between plasma leptin and bone mineral density in patients with type 2 diabetes.
Methods
1. Subjects
From January 2008 to April 2009, a total of 87 women with type 2 diabetes mellitus who met 2008 American Diabetes Association criteria27) and visited the diabetic clinic of Kyungpook National University Hospital, Daegu, Korea were recruited for this study.
Postmenopausal women aged 54 years and older were enrolled in this study to minimize the confounding effect of estrogen on bone mineral density. We excluded patients with coexistent illnesses such as sepsis, malignancies, hepatic failure, thyroid disease, secondary osteoporosis, infections, heart failure and acute metabolic complications. Subjects were also excluded if they were currently exposed to oral contraceptive pills (n = 3). At the entry of the study, no participants were receiving medications known to affect bone metabolism such as calcium, vitamin D, bisphosphonates and anabolic steroids. All except one subject were taking oral hypoglycemic agents. Current insulin users (n = 11) were not included in the study to achieve the homogeneity of leptin-insulin relationship. After exclusion, 60 females were evaluated in the study.
2. Biochemical Measurements
Blood was drawn from all patients in the morning following an overnight fast. Plasma samples used for leptin determination were stored at -20℃ and were not thawed until the leptin assay was performed. Serum leptin was measured using a commercial radioimmunoassay (Human leptin RIA kit, Linco Research co., St. Charles, U.S.A.). Glycosylated hemoglobin (HbA1c) was measured by the High Performance Liquid Chromatography (HPLC) method using VARIANT™ II (Bio-Rad Lab, CA, U.S.A.). The urinary albumin-creatinine ratio (ACR) was measured using a random spot urine sample. Total serum cholesterol was determined by an enzymatic calorimetric test, triglyceride levels by an enzymatic assay without the use of a glycerol blank. High density lipoproteins and low density lipoproteins were measured by an enzymatic selective protection method using a Hitachi Modular Analytics D2400 (Roche, Tokyo, Japan).
3. BMD and Anthropometric Measurements
At the onset of the study, all subjects underwent physical examinations including height (cm) and weight (kg), and then body mass indexes (kg/m2) were calculated. BMD at the lumbar vertebrae (L1-4), and femur (femoral neck, trochanter, and femur total) were measured by dual-energy X-ray absorptiometry (DXA) (Lunar Prodigy, General Electric Medical Systems, Milwaukee, Wisconsin, U.S.A.). Body fat mass was measured by a body composition analyzer (Inbody 3.0, Biospace, Seoul, Korea).
4. Statistical Methods
Statistical analysis was carried out using the SPSS 12.0 for Windows (SPSS, Inc., Chicago, Illinois). BMD values, demographic and biochemical parameters were presented as a mean ± the standard error of the mean (SEM). Serum leptin concentrations were transformed into a natural logarithm to normalize the skewed distribution. Pearson's correlation and partial correlation analysis was done to examine the associations between leptin, BMD and confounding factors. Multiple linear regression analysis was performed to look for independent associations between BMD and other variables. A value of P < 0.05 was considered significant.
Results
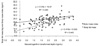
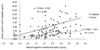
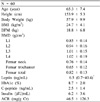
The anthropometric and biochemical characteristics of the subjects are shown in Table 1. The total number of subjects studied was 60. The ages of the patients ranged from 54 to 82 years (65.3 ± 7.4). In accordance with numerous previous studies, natural logarithm transformed serum leptin level was strongly correlated with body fat mass (r = 0.666, P < 0.001), and body mass index (r = 0.542, P < 0.001) (Fig. 1). Fig. 2 shows positive correlation between natural logarithm transformed serum leptin concentration and serum fasting insulin level (r = 0.533, P < 0.001) and fasting C-peptide level (r = 0.460, P < 0.001). Partial correlation analysis adjusted for body fat mass was performed to evaluate the relationship between serum natural logarithm transformed serum leptin and insulin level. But the adjustment eliminated the significant relationship (r = 0.196, P = 0.145, data not shown).
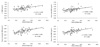
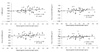
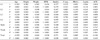
In the unadjusted analysis (Table 2), age showed a strong negative correlation with BMD, while height, body weight, and body fat mass tended to demonstrate positive correlations. On contrary to previous reports with non-diabetic patients, fasting insulin and C-peptide level did not correlate BMD except at femur total. Fig. 3 shows the significant relationship between BMD at various sites and body fat mass. As shown in Fig. 4, leptin level did not significantly correlate with BMD. Thus, partial correlation was performed to reevaluate the relationship between natural logarithm transformed serum leptin and BMD (Table 3). Age, body fat mass and fasting serum insulin level was adopted as controllers according to the results of Pearson correlations. Natural logarithm transformed leptin level showed a significant negative correlation between the BMD of the femoral neck, trochanter, and total. Although statistically insignificant, the BMD of L1 to L4 vertebrae tended to be negatively associated with natural logarithm transformed serum leptin. Multiple linear regression analysis was performed to clarify the contribution of natural logarithm transformed serum leptin levels and other anthropometric, biochemical parameters to BMD values.
As shown in Table 4, body fat mass independently correlated positively with BMD. Natural logarithm transformed leptin concentration was in negative correlation with BMD, consistent with finding of partial correlation. Age also partially predicted BMD after adjustment of other variables. Fasting serum insulin level, however, contributed little in BMD of the proximal femur.
Discussion
This study evaluated the relationship between leptin and the BMD of various sites in postmenopausal women with type 2 diabetes mellitus. We found that the BMD of the proximal femur was inversely correlated with natural logarithm transformed serum leptin concentration after adjustment for age, body fat mass and fasting serum insulin concentration in postmenopausal women with type 2 diabetes mellitus.
Previous studies demonstrated positive association between increased insulin dose and increased BMD in diabetic patients26,27). This relationship was observed even in young patients with recent onset type 1 diabetes, leading to the hypothesis that insulin is a cornerstone of bone anabolic factor28). Also, Streptozocin-induced diabetic mice showed bone-mineralization defect29), and in human study, the positive skeletal effect of intensive insulin therapy on bone metabolism was found in patients with type 1 DM30). In contrast to type 1 DM, type 2 DM is characterized by peripheral insulin resistance with variable degrees of hyperinsulinemia, resulting in different phenotype of bone metabolism. BMD values in women with type 2 DM was reported to be 11% higher at the femoral neck and 8% higher at the lumbar spine compared to controls31). Nevertheless, BMD in type 2 DM is still an important clinical issue, because an increased fracture risk despite a higher BMD at the femoral neck and the lumbar spine is reported in a large clinical trial32). The clinical difference between type 1 DM and type 2 DM with respect to bone density is believed to be associated with the insulin concentration. Besides, adipocyte hormones such as resistin33), adiponectin34), and beta cell hormones such as amylin35) are suggested to play a crucial role in bone metabolism. Theses hormonal factors are interrelated, and interpretation of the relationship between leptin and BMD may be hampered especially in circumstance of metabolic derangement such as type 2 DM.
A previous study on subjects with type 2 diabetes showed that insulin treatment leads to higher leptin level compared to with BMI-matched subjects treated with other therapies36). We failed to find a significant positive association between natural logarithm transformed serum leptin concentration and insulin level in a fat mass -adjusted model. Furthermore, serum insulin showed no strong correlation with BMD when natural logarithm transformed serum leptin concentration and fat mass were selected as dependent variables. Therefore we cannot exclude the possibility that leptin mediates bone mineral density via different mechanisms other than insulin.
Previous clinical studies in human without diabetes mellitus have shown diverse results on leptin - BMD relationships; some of them showed positive relationships23,24), while some showed negative correlations19,20). Likewise, consensus on the leptin-BMD relationship is not achieved in diabetic patients. In young type 1 diabetic patients, serum leptin showed a negative correlation with total bone mineral content and Z-score24). A recent study showed that in obese insulin-resistant premenopausal women, high plasma leptin level no more correlated to higher BMD37).
A recent experiment with tail-suspended mice has proposed the idea that a balance between negative and positive leptin effects on bone is dependent on a bimodal threshold that is triggered by serum leptin concentration, i.e., the experiment showed that intraperitoneal administration of low dose leptin compensated tail suspension-induced BMD loss, while administration of high dose of leptin inhibited femoral bone growth and reduced bone mass38).
This dose-dependent bimodal effect on BMD of leptin is expected to partially explain the diverse leptin-BMD relationship, but cut-off value of serum leptin concentration on opposing two bone phenotypes is not established in human studies yet. In our study, we hypothesized that serum leptin level might be increased compared to normal controls, thereby contributing to negative trend for bone mineral density. But this was an observational study, and patients with normal glucose tolerance were not enrolled in the study. Moreover, to our knowledge, the definition of leptin resistance is not established in human studies, and the degree of insulin resistance was not included in our study design.
No statistical significance was detected in the relationship between L-spine BMD and leptin in our study, but there is a chance of attenuation of the relationship due to small sample numbers. Moreover, according to Hamrick39), in ob/ob mice models, bone mass varied significantly between the axial and appendicular region, and these differences were mainly due to different proportions of trabecular and cortical bone content between the two regions. Lumbar spine BMD was higher due to increased trabecular bone mass, but appendicular BMD was lower because of decrease in cortical bone. There is a possibility that this discrepant effect of leptin on bone between axial and appendicular region might have induced this preferential leptin effect on femoral BMD in our study.
There were several limitations to our study, the most prominent being the small sample size. Furthermore, the study was cross-sectional, observational study, so no direct relationship between leptin and BMD could be determined. Insulin sensitivity index such as HOMA-IR was not considered in the study design. Biochemical markers of bone formation and bone resorption were not measured.
In conclusion, we postulate that leptin is suggested to play a negative role on the BMD of femur neck and trochanter of postmenopausal diabetic women. The elucidation of the precise mechanism was not achieved in this study, though a few possible mechanisms can be suggested as follows; first, resistance to leptin is known to be related with increased age and obesity40). The mean BMI of the patients were 24.7 ± 4.1 and there is a possibility that postmenopausal old and obese diabetic patients were exposed to higher chance of leptin resistance. A second explanation for our findings is that agreement with previous animal study which demonstrated the bimodal effect of leptin on bone mass, and diabetes and obesity might have contributed to increase the serum leptin concentration to the level that could decrease the bone formation rate and increase the bone resorption rate. Further studies would be needed to provide a new insight into the action of leptin on bone and elucidate the mechanism.

 XML Download