

 PDF
PDF ePub
ePub Citation
 Print
Print


Abstract
Background
Methods
Results
Figures and Tables
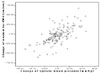 | Fig. 1Correlation between change of maximal baPWV and change of SBP. There was significant positive correlation between change of maxima baPWV and change of SBP (r = 0.636, P < 0.001).
|
Table 1
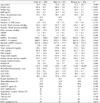
Data are mean ± SD. P value < 0.05 were considered significant. BMI, body mass index; DM, diabetes mellitus; ABI, ankle brachial index; baPWV, brachial-ankle pulse wave velocity; Rt, right; Lt, left; HbA1c, hemoglobin A1c; LDL, low density lipoprotein; HDL, high density lipoprotein; HOMA-IR, homeostasis model assessment of insulin resistance; hsCRP, high sensitive C-reactive protein; AST, aspartate aminotransferase; ALT, alanine aminotransferase; γGTP, gamma glutamyltransferase; PLT, platelet; ACE, angiotensin converting enzyme; CCB, calcium channel blocker; HTN, hypertension.
![]()
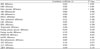
Table 2
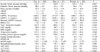
Data are mean ± SD. P value < 0.05 were considered significant. ABI, ankle brachial index; baPWV, brachial-ankle pulse wave velocity; Rt, right; Lt, left; HbA1c, hemoglobin A1c; LDL, low density lipoprotein; HDL, high density lipoprotein; HOMA-IR, homeostasis model assessment of insulin resistance; hsCRP, high sensitive C-reactive protein; AST, aspartate aminotransferase; ALT, alanine aminotransferase; γGTP, gamma glutamyltransferase.
![]()
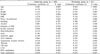
Table 3
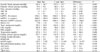
Data are mean ± SD. p value < 0.05 were considered significant. ABI, ankle brachial index; baPWV, brachial-ankle pulse wave velocity; Rt, right; Lt, left; HbA1c, hemoglobin A1c; LDL, low density lipoprotein; HDL, high density lipoprotein; HOMA-IR, homeostasis model assessment of insulin resistance; hsCRP, high sensitive C-reactive protein; AST, aspartate aminotransferase; ALT, alanine aminotransferase; γGTP, gamma glutamyltransferase.
![]()
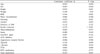
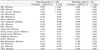
Table 5
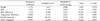
P value < 0.05 were considered significant. SBP, Systolic blood pressure; DBP, Diastolic blood pressure; ABI, ankle brachial index; baPWV, brachial-ankle pulse wave velocity; Rt, right; Lt, left; HbA1c, hemoglobin A1c; LDL, low density lipoprotein; HDL, high density lipoprotein; HOMA-IR, homeostasis model assessment of insulin resistance; hsCRP, high sensitive C-reactive protein; AST, aspartate aminotransferase; ALT, alanine aminotransferase; γGTP, gamma glutamyltransferase.
![]()
Table 6
![]()
Table 7
P value < 0.05 were considered significant. SBP, Systolic blood pressure; DBP, Diastolic blood pressure; ABI, ankle brachial index; baPWV, brachial-ankle pulse wave velocity; Rt, right; Lt, left; HbA1c, hemoglobin A1c; LDL, low density lipoprotein; HDL, high density lipoprotein; HOMA-IR, homeostasis model assessment of insulin resistance; hsCRP, high sensitive C-reactive protein; AST, aspartate aminotransferase; ALT, alanine aminotransferase; γGTP, gamma glutamyltransferase.
![]()

 XML Download