

 PDF
PDF ePub
ePub Citation
 Print
Print


Abstract
Background
Type 2 diabetes mellitus is a common, chronic and costly disease. Its prevalence is rapidly increasing worldwide. Diabetes has big economic burden mainly because of its chronic complications. We analyzed the annual direct medical costs of type 2 diabetic patients, including the costs associated with its complications in Korea retrospectively.
Methods
We enrolled 531 type 2 diabetic patients who had been treated in the 3 Tertiary Hospital in 2005. Clinical characteristics, duration of diabetes, modality of glycemic control, and presence of microvascular and macrovascular complications were assessed by the review of medical records. The annual direct medical costs were assessed using the hospital electronic database and included insurance covered and uncovered medical costs.
Results
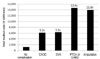
The annual direct medical costs of type 2 diabetic patients without any complications was 1,184,563 won (95% CI for mean: 973,006~1,396,121 won). Compared to diabetic patients without complications, annual total medical costs increased 4.7-fold, 10.7-fold, and 8.8-fold in patients with microvascular complications, macrovascular complications and both complications, respectively. Hospitalization costs largely increased by 78.7-fold and 61.0-fold in patients with macrovascular complications and both complications, respectively. Major complications to increase medical costs were kidney transplantation (23.1-fold), dialysis (21.0-fold), PTCA or CABG (12.4-fold), and leg amputation (11.8-fold). The total medical costs dramatically increased according to the stage of diabetic retinopathy and nephropathy.
Figures and Tables
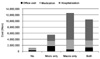 | Fig. 1Annual medical costs per patient according to the diabetic complication groups. The total medical costs increased 4.7-fold, 10.7-fold and 8.8-fold in patients with microvascular complications, macrovascular complications and both complications compared to diabetic patients without complications, respectively. Both, both microvascular and macrovascular complications; Macro only, macrovascular complications only; Micro only, microvascular complications only; Office visit, total office visit costs except medication costs.
|
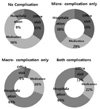 | Fig. 2Proportion of sub-costs on total medical costs per patient according to the diabetic complication groups. Hospitalization costs largely increased and accounted for 65~70% of the total medical costs in patients with macrovascular complications. Micro-complication only, microvascular complications only; Macro-complication only, macrovascular complications only; Both complications, both microvascular and macrovascular complications; Micro only, microvascular complications only; Office visit, total office visit costs except medication costs.
|
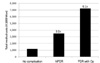 | Fig. 3Annual total medical costs per patient according to the stage of diabetic retinopathy. The total medical costs increased 3.0-fold and 6.1-fold in patients with NPDR and PDR who had been treated with operation compared to diabetic patients without complications. NPDR, non-proliferative diabetic retinopathy; PDR, proliferative diabetic retinopathy.
|
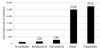 | Fig. 4Annual total medical costs per patient according to the stage of diabetic nephropathy. The total medical costs dramatically increased according to the stage of diabetic nephropathy.
|
 | Fig. 5Annual total medical costs per patient according to the diabetic macrovascular complications. The total medical costs increased 12.4-fold and 11.8-fold in patients with PTCA or CABG and leg amputation compared to diabetic patients without complications. CABG, coronary artery bypass graft; CAOD, coronary artery occlusive disease; CVA, cerebrovascular accident; PTCA, percutaneous transluminal coronary angioplasty.
|

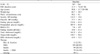
Table 3
Annual direct medical costs according to the diabetic complication groups (Unit: won)
Both, both microvascular and macrovascular complications; CI, confidence interval; Macro only, macrovascular complications only; Micro only, microvascular complications only; Office visit, total office visit costs except medication costs; SD, standard deviation. *P value, compared with no complication group by independent samples t-test.
![]()
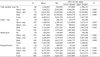
Table 4
Annual direct medical costs per patient according to the diabetic complications (Unit: Won)
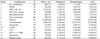
CABG, coronary artery bypass graft; CAOD, coronary artery occlusive disease; CVA, cerebrovascular accident; DM, diabetes mellitus; NPDR, non-proliferative diabetic retinopathy; Office visit, total office visit costs except medication costs; PDR, proliferative diabetic retinopathy; PTCA, percutaneous transluminal coronary angioplasty.
![]()
References
1. Bjőrk S. The cost of diabetes and diabetes care. Diabetes Research and Clinical Practice. 2001. 54:suppl.1. S13–S18.

2. WHO. World Health Report. 1997.
3. King H, Aubert RE, Herman WH. Global burden of diabetes, 1995-2025: prevalence, numerical estimates, and projections. Diabetes Care. 1998. 21:1414–1431.
5. Diabetes Atlas. International diabetes Federation. 2003. 2nd ed.
6. Stratton IM, Adler AI, Neil HA, Matthews DR, Manley SE, Cull CA, Hadden D, Turner RC, Holman RR. Association of glycaemia with macrovascular and microvascular complication of type 2 diabetes (UKPDS 35): prospective observational study. BMJ. 2000. 321:405–412.
7. Vijan S, Stevens DI, Herman WH, Funnel MN, Stanford CJ. Screening, preventing, counseling, and treatment for the complications of type II diabetes mellitus: putting evidence into practice. J Gen Intern Med. 1997. 12:567–580.
8. The Diabetes Control and Complications Trial research Group. The effect of intensive treatment of diabetes on the development and progression of long-term complications in insulin-dependent diabetes mellitus. N Engl J Med. 1993. 329:977–986.
9. UK Prospective Diabetes study (UKPDS) Group. Intensive blood-glucose control with sulphonylureas or insulin compared with conventional treatment and risk of complications in patients with type 2 diabetes (UKPDS 33). Lancet. 1998. 352:837–853.
10. Chodosh J, Morton SC, Mojica W, Maglione M, Suttorp MJ, Hilton L, Rhodes S, Shekelle P. Meta-analysis, chronic disease self-management programs for older adults. Ann Intern Med. 2005. 143:427–438.
11. Stefan B. The cost of diabetes and diabetic care. Diabetes research and clinical practice. 2001. 54:suppl.1. S13–S18.
12. Brown JB, Pedula KL, Bakst AW. The progressive cost of complication in type 2 diabetes mellitus. Arch intern med. 1999. 159:1873–1880.
13. Williams R, Van-Gaal L, Lucioni C. Assessing the impact of complications on the costs of type 2 diabetes. Diabetologia. 2002. suppl 45. S13–S17.
14. Borch-Johnsen K. The costs of nephropathy in Type II Diabetes. Pharmacoeconomics. 1995. 8:40–45.
15. Cox DJ, Gonder-Frederick L. Major developments in behavioural diabetes research. J Consult Clin Psychol. 1992. 60:628–638.
16. Michael B, Ray B, Honghong Z, Bahman P, Barbara RKS, Morton BB, Deanna M, William HH. The Direct Medical Cost Of Type 2 Diabetes. Diabetic care. 2003. 26:2300–2304.
17. Amie TJ, Diane T, John MI, Alexander P, Soma N, Daniel AO, Shiva S, Charles MA, Evguenia J. End stage renal disease-associated managed care costs among patients with and without diabetes. Diabetes Care. 2004. 27:2829–2835.
18. Rippin JD, Barnett AH, Bain SC. Cost-effective strategies in the prevention of diabetic nephropathy. Pharmacoeconomics. 2004. 22:9–28.
20. Boulton AJM. Pickup JC, Williams G, editors. Foot problems in patients with diabetes mellits. 1997. vol.2. Oxford, U.K: Blackwell Science;58.1–58.20.
24. American Diabetes Association. Economic costs of Diabetes in the U.S in 2002. Diabetes Care. 2003. 26:917–932.
25. Andrea M, Patrizia B, Stefania L, Renzo G, Dario V, Paola PC, Lorenzo GM. Major complications have an impact on total annual medical cost of diabetes: Results of a database analysis. Journal of Diabetes and its complication. 2006. 20:163–169.
 XML Download