

 PDF
PDF ePub
ePub Citation
 Print
Print


Introduction
Pulmonary function test is one of the basic and essential tests for diagnosis and assessment of pulmonary diseases such as pulmonary dysfunction, chronic obstructive pulmonary disease (COPD) and asthma1,2. Factors affecting pulmonary functions include age, body weight and height, and gender. Since those factors are significantly associated with pulmonary functions, they are used for equation of regression calculating predicted normal values of pulmonary functions test. Correlation between body composition such as body mass index (BMI), waist measure, fat mass and pulmonary functions has been studied since later 1950s. However, study results of correlation between pulmonary functions and body composition have been different from each other. In addition, since the mechanism of body composition affecting pulmonary functions has not been fully understood, body composition is not used as a factor for equation predicting pulmonary function2,3.
According to Maiolo et al.4, correlation between forced vital capacity (FVC) and BMI, waist measurement and fat mass is more significant than that between forced expiratory volume at 1 second (FEV1) and BMI, waist measurement and fat mass. Fat accumulation in thoracic and abdominal cavities arise changes in respiratory function including sluggish thoracic movements and pulmonary compliance in thoracic cavity, reduced inspiratory capacity and falling of diaphragm4. Waist-hip ratio (WHR) which is associated with body fat distribution also has a correlation with pulmonary function5. Compared with females who usually have an intensive peripheral fat distribution, central obesity is common in males. As a result, difference in correlation according to changes in body composition is larger in males then in females6.
Fat free mass (FFM) is mainly composed of muscles, and is associated with physical activities and accordingly, pulmonary function can be enhanced through physical efforts7. As a result of a large-scale study on the correlation between hand grip strength, and FVC and FEV1, a significant positive correlation was confirmed. This means that FFM can independently affect respiratory muscles regardless of physical activities8. Low FFM reduces FEV1, and reflects reduction in respiratory muscle mass5. FFM index and FFM/height2 (fat-free mass index [FFMI]) are values calculating FFM based on the consideration of body size.
In the present study, we confirmed whether use of values of body composition and fat distribution in the body in addition to factors such as age, body weight, height and gender is useful or not for predicting results of pulmonary function test, and investigated effects body composition and fat distribution on pulmonary function.
Materials and Methods
1. Subjects
Males and females in their 20s through 70s of age who underwent pulmonary function tests and body composition analysis (BCA) at Yeungnam University Hospital Health Promotion Center between April 2009 and June 2009 participated in the present study. Excluding candidates who have history of hypertension, diabetes, malignant tumor, heart diseases and respiratory diseases such as acute respiratory infection, tuberculosis, COPD, asthma, pulmonary fibrosis, bronchiectasis, and pleural diseases, a total of 291 subjects were finally selected for the present study. Numbers of male and female subjects were 152 and 139, respectively, with a mean age of 46.
2. Methods
Pulmonary function test was conducted by measuring FVC, FEV1 and mean forced expiratory flow during the middle half of the FVC (FEF25-75) at a forced expiratory curve using a spirometry (Vmax 229; Sensor Medics, Yorba Linda, CA, USA).
Through a bioelectrical impedance method using Inbody 2.0 (Biopass, Seoul, Korea), body composition values including body weight, height, BMI (kg/m2), body fat percentage (fat percentage, fat%, %), muscle mass (kg), FFM (kg), FFMI (FFM/height2) and WHR were measured.
3. Statistical processing
SPSS version 18.0 (SPSS Inc., Chicago, IL, USA) was used for statistical processing. Difference according to gender was investigated using unpaired independent t-test. In order to find out correlation between pulmonary function and body composition factors, mainly FVC, FEV1 and FEF25-75 were used. In addition, effects of body composition factors on pulmonary function were investigated using multiple linear regression. In order for correcting mutual functions among body composition factors, the factors which are highly associated with the result of pulmonary function test were investigated using stepwise selection upon consideration of multicollonearity in multiple linear regression and then, prediction on pulmonary functions test was indirectly calculated using body composition factors. Regresiveness was expressed using adjusted coefficient of determination r2. Statistical significance level was set at less than 0.05.
Results
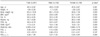
Mean age of the subjects was 46.3, and means of height and body weight were 1.64 m and 63.2 kg, respectively. No significant difference in age, WHR and FEV1 was found between males and females. Among body composition factors, females showed significantly higher level only in body fat percentage than males, while males showed higher levels in all the remaining factors such as muscle mass, FFM and FFMI (p<0.05) (Table 1).
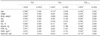
In both males and females, FVC showed positive correlations with age, gender and BCA, and negative correlations with age, body fat percentage and WHR. FEV1 showed significant negative correlations with age and body fat percentage. FEF25-75 showed correlations with BCA excluding BMI, and like FVC, showed negative correlations with age, body fat percentage. Therefore, factors associated with all of FVC, FEV1, and FEF25-75 were age and body fat percentage, and in cases of elderly subjects or higher body fat percentage, values of pulmonary function test results were lower showing negative correlations (Table 2).
In case of male, no significant correlations with FVC, BMI, and body fat percentage were found. Instead, positive correlations with muscle indexes such as muscle mass, FFM, and FFMI were found while significant negative correlations with WHR which is an obesity index were found. Both FEV1 and FEF25-75 did not show significant correlations with BMI and body fat percentage. FEF25-75 did not show a correlation with WHR, either. Accordingly, in case of male, FVC, FEV1, and FEF25-75 did not show significant correlations with BMI and body fat percentage (Table 3).
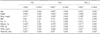
In case of female, factors associated with all of FVC, FEV1, and FEF25-75 were age, height, BMI, body fat percentage, muscle mass, FFM and WHR, and no significant correlation was found between body weight and FFMI (Table 4).
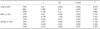
As a result of multiple linear regression, in terms of FVC in both males and females, most statistical significance was found in FFM followed by BMI and FFMI (p<0.05). Changes in FVC upon completion of correcting FFM and BMI could be explained by 66% through the changes in FFMI. In case of male, the most significance was observed in free mass followed by WHR and body fat percentage (p<0.05), while in case of female, FVC was most significantly observed in FFM followed by FFMI and body fat percentage. After correcting FFM and WHR in males, and correcting FFM and FFMI in females, changes in FVC occurred by changes in body fat percentage in males and females were 35% and 35%, respectively (p<0.05) (Table 5).
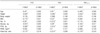
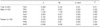
In terms of FEV1, body fat percentage was the only factor significantly associated with in both males and females. When body fat percentage increased by 1%, FEV1 decreased by 399 mL. Most significance in male was observed in FFM followed by WHR, body fat percentage and FFMI. After these 3 were corrected, and 1 unit of FFMI was increased, FEV1 increased by 162 mL or 48%. In case of females, most influence was observed in FFM followed by FFMI and WHR. When FFM and FFMI were corrected, FEV1 decreased by 89 mL with an increase in WHR by 0.01 (Table 6).
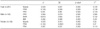
In terms of FEF25-75, most significance in both males and females was observed in muscle mass followed by FFMI and FFM: in males, in the order of FFM, WHR and BMI, and in females, same order as in both males and females (Table 7).
Not only body composition factors, but predicted values of pulmonary function test as well as height, body weight, age and gender were obtained as significant factors (p<0.05) using multiple linear regression, and progressiveness was expressed as adjusted coefficient of determination r2 (Table 8). In addition, adjusted coefficients of determination of pulmonary function test prediction equation reflecting height, body weight, age and gender, and adjusted coefficients of determination of body composition factors, and adjusted coefficients of determination including all factor were compared (Table 9).
Discussion
Pulmonary function test is a basic and essential test for diagnosis and assessment of pulmonary dysfunction, pulmonary diseases, and treatment effects. Predicted normal values of pulmonary functions test is calculated by an equation of regression reflecting gender, age, height, and body weight due to the significant correlation with pulmonary functions test values2. Since other body measures have also been reported to have correlations with the result of pulmonary functions test, studies to find an equation of regression of pulmonary functions values according to other body measures have continued1. Among body measures, body weight and BMI are conveniently used, but they are not differentiated by fat mass or muscle mass. In addition, application to males and people with low body weight is not appropriate compared with females and overweight people. Since fat distribution in the body is not considered in body weight and BMI, studies on correlation between pulmonary function and fat distribution in the body have also been conducted these days6,9.
Mengesha investigated correlations between pulmonary function and body composition in European males and females. In both males and females, age and height showed a significant correlation with FVC and FEV1, and in case of males, FVC and FEV1 showed correlations with body weight, body fat percentage and FFM, but in case of females, no significance was observed10. By comparison, significant correlation was observed in both males and females in the present study. In case of male, FVC and FEV1 showed significant correlations with muscle mass and FFM, FFMI and WHR, and FEF25-75 showed significant correlations with muscle mass, FFM and FFMI. In case of female similar to males, significant correlations were also observed with BMI and body fat percentage, and with a 1% increase in body fat percentage, 13 mL of FVC decreased.
In case of male, FFMI showed a positive correlation with FVC and FEV1, which is opposite to body fat percentage. Therefore, FFMI and body fat percentage are appropriate but BMI is not because BMI is expressed as the ratio of weight to the square of height. In case of female, FFMI shows same level of reverse effects on expiratory reserve volume and inspiratory capacity and accordingly, offset effects occur. Accordingly, BMI or body fat percentage can be used, not FFMI2,11. In case of male in the present study, FVC and FEV1 did not show correlation with BMI and body fat percentage, but showed significant correlation with FFMI. In case of female, correlation was found between BMI and body fat percentage, but no significant correlation with FFMI was found. This was because FFM composed most of the body weight in males, and body fat percentage of females was higher than that of males.
In accordance with the increasing attention on obesity, studies on correlation between the results of pulmonary functions test and obesity have been conducted. In particular, correlation between waist measure and WHR were investigated. As a result, waist measure showed negative correlation with FVC and FEV1, and with a 1 cm increase in waist measure, 13 mL and 11 mL reductions in FVC and FEV1, respectively were observed12,13. Distribution of body fat also affects pulmonary function: the larger the waist measure or WHR were meaning the more fat distribution in upper body, the less the pulmonary function was. With an increasing abdominal fat deposition, thoracic volume reduces and consequently, not only vital capacity but power of respiratory muscles decrease deteriorating mechanical efficiency of thorax. In addition, pulmonary capacity declines and as a result of shallow and rapid respirations, respiratory dead space increases, and eventually tracheal obstruction and partial atelectasis develop3. In addition, large WHR usually results in a high risk of developing visceral abdominal obesity. Levels of systemic inflammatory cells such as cytokine including leptin, C-reative protein and fibrinogen are high in obesity cells, and systemic inflammation is considered to be associated with deteriorating pulmonary functions14. In the present study, pulmonary function and WHR in case of male were confirmed to have negative correlation. In case of male, when WHR increased by 0.01, FVC decreased by 67.9 mL, FEV1 decreased by 72.4 mL and FEF25-75 decreased by 88.1 mL.
Multiple body composition factors were confirmed to have correlations with the results of pulmonary functions test. However, adjusted coefficient of determination was not high according to multiple linear regression excluding height, age and body weight (Tables 5~7). Pulmonary functions prediction formula was obtained using significant variables (p<0.05) by conducting a stepwise method of multiple linear regression on the variables including height, body weight, age and gender (Table 8). The pulmonary functions prediction formula which took into consideration of body composition factors did not have a higher adjusted coefficient of determination than the current pulmonary functions prediction formula which took into consideration of height, age, body weight and gender only (Table 9). In other words, correlation was found but the prediction formula based on the body composition factors did not show enough explicability to replace the current pulmonary functions prediction formula.
In the present study, only FVC, FEV1, and FEF25-75 were measured and accordingly, correlations with additional pulmonary functions test values such as total lung capacity, inspiratory capacity and functional residual capacity were not described. Correlation with smoking was also not discussed. Another limitation of the present study is that the waist-hip measures were not measured but calculated at Inbody and consequently, differences may exist.
In conclusion, not only age, gender and body weight, body fat percentage, muscle mass, FFM, FFMI and WHR also affect FVC, FEV1, and FEF25-75. In order to use these factors for a pulmonary functions prediction formula, additional studies may be required in the future.


 XML Download