

 PDF
PDF ePub
ePub Citation
 Print
Print


INTRODUCTION
Asthma has generally been defined as a chronic airway inflammatory disorder characterized by bronchial hyperresponsiveness (BHR) and recurrent airflow obstruction. However, asthma is a heterogeneous condition with distinct phenotypes and endotypes.1 In addition, wheezing in childhood is a heterogeneous condition, and 2 main phenotypes are atopic and non-atopic after the age of 6 years.2,3 Although a large majority of non-atopic children with wheeze spontaneously resolves in later childhood, atopic children with wheeze are more likely to develop chronic asthma.4 This suggests that children with non-atopic asthma (NAA) would be predicted to have a different pathophysiology from those with atopic asthma (AA) during childhood.
Clinical severity and lung function have been reported to be similar in both AA and NAA children.5,6,7 In addition, no difference was reported in the airway pathologic features of eosinophilic inflammation and remodeling in bronchial biopsies between children with AA and NAA.8 However, the exhaled nitric oxide (eNO) levels and BHR, especially to adenosine-5'-monophosphate (AMP), were found to be greater in AA.7,9 Moreover, the proportion of eosinophils in induced sputum is higher in children with AA.10,11
Bronchoprovocation challenge has been widely used for measuring BHR in patients with asthma, and stimuli used can be categorized as direct stimuli, such as methacholine, or indirect stimuli, such as AMP.12 BHR to methacholine is more closely associated with baseline forced expiratory volume in 1 sec (FEV1), whereas BHR to AMP is a better marker of airway inflammation in asthmatics.13,14 The eNO has been identified as a non-invasive marker of airway inflammation15 and found to have a significant correlation with BHR to AMP in adults with asthma.16 However, no previous study has compared the relationships between lung function, BHR to direct and indirect stimuli, and eNO as a possible way to differentiate AA from NAA in children.
The aims of this study were to compare lung function, BHR, and the eNO levels in children with AA and NAA and to then evaluate the relationship among these factors in each patient group to clarify any differences in the pathophysiology between AA and NAA.
MATERIALS AND METHODS
Subjects
One hundred and thirty-six children with asthma, aged 5-15 years, were recruited from October 2010 to May 2012 from the Childhood Asthma, Atopy Center at the Asan Medical Center Children's Hospital. All subjects had a history of recurrent wheezing and/or dyspnea within previous 12 months, and had been diagnosed on the basis of airway reversibility defined by an increased FEV1 of ≥12% after bronchodilator administration and/or symptom relief using a bronchodilator. Patients with severe comorbidities, including congenital heart disease, bronchiolitis obliterans, and malignancy, affecting lung function were excluded. Asthma severity was defined according to the National Asthma Education and Prevention Program (NAEPP) guidelines.17 Asthmatic children were classified as AA (n=100) or NAA (n=36) from skin prick test (SPT) results.
A non-atopic control (NAC) group of 40 children who visited our hospital over the same period for routine examinations and had no allergic diseases and a negative SPT were also recruited. Our study protocol was approved by the Institutional Review Board of Asan Medical Center, and all parents and guardians provided written informed consent following a detailed explanation of the study.
Measurement of lung function and BHR
Basal lung function, including measurements of FEV1, forced vital capacity (FVC), and forced expiratory flow at 25% to 75% of FVC (FEF25%-75%) was assessed prior to methacholine challenge; percentage predicted values (% pred) for FEV1, FVC, and FEF25%-75% were calculated based on previously determined reference values for healthy Korean children.18 The bronchial provocation test with methacholine followed by AMP was performed in all subjects on the same day. An AMP challenge was performed after recovery of FEV1 to within 5% of the baseline FEV1 of a methacholine challenge. All subjects were requested to stop using antihistamines, bronchodilators, and other medications for 48 hours and inhaled corticosteroids for 14 days before testing. None of our subjects had any symptoms of upper respiratory tract infections in the month preceding the tests.
Fresh preparations of methacholine and AMP were made in buffered saline solution at concentrations of 0.625 to 25 mg/mL for methacholine (0.625, 1.25, 2.5, 5, 10, and 25 mg/mL) and 3.125 to 400 mg/mL for AMP (3.125, 6.25, 12.5, 50, 100, 200, and 400 mg/mL). FVC and FEV1 values were determined at each time point in methacholine and AMP tests when there was a concentration change. A dose-response slope (DRS) was calculated to overcome the information limit arising from the censored value given to children with low BHR to methacholine or AMP. The slope was estimated by dividing the percentage fall from the post-saline FEV1 at the highest dose given by that final dose, and a constant was added to remove negative values that can occur in subjects with low BHR.19 These values are then log transformed to normalize the distribution. The formula we used is as follows:
Measurement of eNO
The eNO fraction was measured using a Niox Mino device (Aerocrine, Solna, Sweden). The measurements were performed at an expiratory flow rate of 50 mL/sec, and the duration of exhalation was at least 6 seconds to ensure a stable NO level. Three measurements were obtained for each subject, and the mean value was recorded as the level of eNO.
Measurement of atopy
The SPT was performed on the backs of the children using standard methods.20 Commercial extracts of the following common allergens were used: mites (D. pteronyssinus and D. farina), molds (Alternaria, Aspergillus, Cladosporium, and Penicillium), pollens (grasses, trees, weeds, ragweed, mugwort, oak, beech, nettle, willow, elm, pine, hop, elder, hazel, oats, lambs quarter, ash, alder, birch, timothy, and rye grass), animal dander (dog, and cat), and cockroach. Histamine and isotonic saline were used as positive and negative controls. A positive SPT was defined as a mean wheal diameter of ≥3 mm and greater than that of the positive control. Atopy was defined as the presence of at least 1 positive SPT result. In addition, the degree of atopy was measured by sum of wheal diameters of positive allergens tested.
Blood eosinophils and serum total IgE
Blood eosinophil counts were measured using an automated blood analyzer. Serum total IgE levels were measured with a fluorescence enzyme immunoassay using the UniCAP system (ThermoFisher Scientific Inc., Uppsala, Sweden).
Statistical analysis
Data are presented as the mean±SD or as the geometric mean with a range of 1 SD. The levels of total IgE, blood eosinophil counts, and sum of wheals, and DRS AMP and methacholine were log-transformed before analysis to normalize their distributions. The variables were then compared using Student's t test or analysis of variance (ANOVA), and the frequencies were compared using the χ2 test. Correlations between variables were analyzed using Pearson's correlation test with controls for sex and height as they affect each of these variables in bivariate correlation analysis. A P value of 0.05 or less was considered significant. SPSS version 19 was used for the analysis.
RESULTS
Characteristics of the study subjects
The characteristics of the children analyzed in this study are listed in Table 1. Although children with NAA tended to be younger and shorter than those with NAC, there were no differences in age, sex distribution, height, weight, and body mass index between the 2 asthma groups. The asthma groups did not show any differences in age at the onset of symptoms or the severity of asthma. The prevalence of parental asthma history was significantly higher in the NAA group than in NAC group. However, there was no statistical difference between both asthma groups (Table 1).
Comparison of lung function, BHR, and eNO between the AA and NAA groups
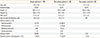
We examined lung function and BHR in all the 3 study groups. While there were no significant differences in FEV1 % pred and FVC % pred values between the 3 groups, the FEV1/FVC and FEF25%-75% % pred levels were significantly reduced in both asthma groups compared to the control group (P<0.05). However, there were no differences in FEV1/FVC and FEF25%-75% % pred values between both asthma groups.
Both asthma groups showed higher DRS methacholine levels than the NAC group (P<0.01), without significant differences between both asthma groups. The DRS AMP levels were higher in the AA group than the NAA or NAC group (P<0.01 for each). The DRS AMP levels in the NAA group did not differ from those in the NAC group.
The eNO levels were significantly higher in the AA group than in the NAA or NAC groups, respectively (P<0.01 for each). These differences were not observed between the NAA and NAC groups. The AA group showed the highest blood eosinophil counts among the 3 study groups (AA vs NAA, P<0.05; AA vs NAC, P<0.01). The NAA group showed a higher blood eosinophil level than the NAC group (P<0.05). Likewise, the serum total IgE levels were higher in the AA group than either the NAA or NAC group, respectively (P<0.01 for each). The serum total IgE levels in the NAA group did not significantly differ from those in the NAC group (Table 2).
Relationships between lung function, BHR, and eNO levels in the AA group
In the AA group, the FEV1 % pred measurement showed a significant negative correlation with DRS methacholine (r=-0.280, P<0.01), a marginally significant negative correlation with DRS AMP (r=-0.192, P=0.064). The levels of FEF25%-75% % pred had a significant negative correlation with DRS methacholine (r=-0.301, P<0.01) and a significant negative correlation with DRS AMP (r=-0.206, P<0.05). Moreover, the eNO levels showed a significant negative correlation with FEV1/FVC (r=-0.246, P<0.05), but not with FEV1 % pred (r=-0.108) or FEF25%-75% % pred (r=-0.150).
In our analyses of the association between the eNO levels and BHR indices, we found significant positive correlations with DRS methacholine (r=0.259, P<0.05) and DRS AMP (r=0.357, P<0.001).
In the association of the BHR indices and eNO with atopic markers, the DRS AMP values showed a significant correlation with the sum of wheals (r=0.378, P<0.001), but not with serum total IgE (r=-0.008). DRS methacholine did not have a significant correlation with atopic inflammatory markers (sum of wheals, r=0.164; serum total IgE, r=0.033). The levels of eNO showed a significant positive correlation with the serum total IgE (r=0.291, P<0.01) and a marginally significant correlation with the sum of wheals (r=0.186, P=0.073) (Table 3).
Relationships between lung function, BHR, and eNO in the NAA group
In the NAA group, the lung function parameters showed no significant correlation with BHR indices or the eNO levels with the exception of FEF25%-75% % pred. The FEV1 % pred values had no significant correlation with any BHR indices (DRS methacholine, r=-0.259; DRS AMP, r=-0.201). The levels of FEF25%-75% % pred were found to have a marginally significant negative correlation with DRS methacholine (r=-0.354, P=0.051), but no significant correlation with DRS AMP (r=-0.158).
The levels of eNO did not correlate with any of the lung function parameters tested (FEV1 % pred, r=0.186; FEV1/FVC, r=0.122; FEF25%-75% % pred, r=0.231) or any BHR indices (DRS methacholine, r=0.291; DRS AMP, r=0.217).
When we evaluated the association of the BHR index and eNO with the atopic markers, BHR to methacholine or AMP had no significant correlation with serum total IgE (DRS methacholine, r=0.116; DRS AMP, r=0.087). The eNO levels had no significant correlation with serum total IgE (r=0.146) (Table 3).
DISCUSSION
In our study, children with AA and NAA were found to share some common features including reduced small airway function, and increased BHR to methacholine challenge. However, the children with AA showed higher BHR to AMP and eNO levels than the NAA children. When relationships among airway inflammation, BHR, and lung function were evaluated, the AA group showed significant relationships between lung function, BHR to AMP or methacholine, and the eNO levels. However, the NAA group showed only an association between small airway function and BHR to methacholine.
In this study, BHR to AMP was found to be higher in children with AA than with NAA. In contrast, BHR to methacholine was found not to differ between the 2 groups. Moreover, AMP responsiveness was also associated with the degree of atopy in children with AA. Recently, Suh et al.9 have reported that BHR to AMP is greater in children with AA than in those with NAA and associated with the degree of atopy, whereas BHR to methacholine does not differ between the 2 groups, which is consistent with our findings. These results collectively suggest that children with AA have airways that are more responsive to AMP than to methacholine and that this response increases with the degree of atopy in a dose-dependent manner. However, the pathogenesis of methacholine responsiveness may involve mechanisms other than atopy. In this study, children with AA also showed higher levels of eNO and blood eosinophils than those with NAA. Increased eNO levels and sputum eosinophils were previously shown to be detected in AA, not in NAA.7,11 In addition, previous studies have reported that eNO levels are related to eosinophil counts in sputum and lavage fluid.21,22 These results suggest that eosinophilic airway inflammation could be responsible for higher NO production in children with AA.
In our AA cases, BHR to methacholine was found to be associated with eNO levels, as well as baseline FEV1 and FEF25%-75%. BHR to methacholine, a direct stimulus, has been considered to have 2 components: variable and fixed.23 Whereas variable components can be the eNO level, a marker of airway inflammation, fixed components can be baseline FEV1 and FEF25%-75% values, indices that reflect airway structural and functional changes in this study. Similarly, BHR to AMP, an indirect stimulus, was also found to be associated with baseline lung function as well as eNO levels in patients with AA. In addition, eNO levels were associated with the degree of atopic parameters, such as serum IgE levels in patients with AA. These findings collectively suggest that there are interactions between key features of atopic asthma, including atopy, inflammation, and BHR. Previous findings that the relationship between eNO and BHR was only found in atopic children24,25 were consistent with our results in this regard.
In contrast to the aforementioned findings in patients with AA, children in our NAA group showed only an association between small airway function and BHR to methacholine. No relationship in the NAA cases was found among airway inflammation and BHR to methacholine or AMP in contrast with the findings in the AA cases. We thus speculate that mechanisms other than atopic airway inflammation underlie the pathogenesis of BHR to methacholine in patients with NAA. Mochizuki et al.26 have previously reported that the speed of bronchoconstriction to methacholine is higher in children with NAA than in those with AA, which suggests the mechanism of BHR may differ between those with AA and NAA. As another mechanism, we can speculate that certain harmful stimulations like lower respiratory tract infections in early childhood can alter the airway structure leading to airway remodeling processes that are considered to induce airway tone regulation failure and airway obstruction, regardless of eosinophilic airway inflammation, which was demonstrated by previous epidemiologic studies.3,27 Skevachi et al.28 have demonstrated that rhinovirus can induce basic fibroblast growth factors and stimulate lung fibroblast proliferation, which may contribute to airway remodeling. Piedimonte has proposed that respiratory syncytial virus (RSV) infection in early life increases nerve growth factors and neurotrophin receptor expression that cause abnormal remodeling of neuronal networks in the respiratory tract resulting in BHR and airway obstruction.29 Finally, neutrophilic airway inflammation in induced sputum has recently been reported to be a main feature in children with NAA,10 and this inflammation may not be represented by BHR to AMP or eNO. The findings in these previous studies can explain why our patients with NAA have a similar degree of BHR to methacholine, but a lower degree of BHR to AMP, compared to those with AA and show only an association of BHR to methacholine with small airway function, but not with the eNO levels in our study.
Different associations of lung function, bronchial hyperresponsiveness, and exhaled nitric oxide between subjects with AA and NAA may be caused by a selection bias. However, we did not select children with AA and NAA separately. Subjects with asthma were recruited irrespective of atopic status during study periods and then classified into those with AA and NAA based on SPT results. The proportion of atopy in those with asthma was 73.5% (36/100), which is similar to proportions of of 72.7%-73.0% found in previous hospital-based studies in Korean children with asthma.30,31 However, it is too simple to classify asthma phenotypes into NAA and AA on the basis of SPT results as most previous studies6,10 and our study used. Childhood NAA may comprise a more heterogeneous group of disorders than AA, which may have structural changes in the airway after viral infection during early childhood, eosinophilic airway inflammation similar to AA, and non-eosinophilic (neutrophilic) airway inflammation as mentioned above. Further research is needed to classify asthma endotypes during childhood on the basis of the mechanism.
An AMP challenge was performed after a methacholine challenge on the same day in our asthmatic children. It is unlikely that the methacholine challenge influenced the results of the AMP challenge, because we performed the AMP challenge when the baseline FEV1 had recovered to within 5% of the methacholine challenge baseline without any respiratory symptoms suggestive of airway obstruction. Hence, the baseline airway calibers after the methacholine challenge may not have hexerted an effect on the PC20 of the AMP challenge. In these experiments, baseline FEV1 values in the 2 challenges were not significantly different (data not shown).
To our knowledge, our study is the first to report that relationships between lung function, BHR to direct or indirect stimulus, and airway inflammation differ between children with AA and NAA. Relationships were clearly evident between lung function, airway inflammation, and BHR in children with AA. However, these relationships were not found in children with NAA, with the exception of small airway function and BHR to methacholine. Our findings thus suggest that there is a different pathophysiology between AA and NAA in terms of relationships between lung function, airway inflammation, and BHR, which may have implications for the selection of therapeutic strategies, such as inhaled steroids, in these children. However, further studies are needed to clarify whether response to the same therapeutic strategy is different between AA and NAA before possible clinical implications can be drawn.


 XML Download