

 PDF
PDF ePub
ePub Citation
 Print
Print


Introduction
Adlay (Coix lacryma-jobi) (AD) is widely appreciated as a health food supplement [1,2]. AD consumption effectively decreases serum cholesterol, triglycerides, and low-density lipoprotein cholesterol, increases high-density lipoprotein cholesterol, lowers liver lipids, prevents fatty liver, and increases lipid excretion [3]. Buckwheat (Fagopyrum esculentum) (BW) contains large amounts of protein, starch, and vitamins. The proteins in BW consist of well-balanced amino acids with a high biological value, and BW is an excellent grain supplement [4]. In addition, BW contains more rutin than most other plants, which exhibits antioxidative, antihemorrhagic and blood vessel protecting properties [5]. Barley (Hordeum spp.) is gaining renewed interest as an ingredient for functional foods due to its bioactive compounds, such as β-glucans and tocols [6,7]. Barley has broad genetic variation among cultivars, and an important genetic trait is the presence of genotypes varying in the amylase-amylopectin ratio [7]. Glutinous barley (GB) contains additional soluble fiber, which could be of interest in relation to glucose and lipid metabolism [8].
Several reports have shown that whole grains are nutritionally comparable or even superior to white rice (WR) [9]. Whole grains also contain micronutrients such as vitamin E, folate, phenolic acids, zinc, iron, selenium, copper, manganese, carotenoids, betaine, choline, sulfur amino acids, phytic acid, lignins, lignans, and alkylresorcinols, which all may have potential antioxidant effects [9]. However, the bran fraction plays a more important role due to the germ released during cereal processing.
In general, whole grains tend to improve the antioxidant status of animals, and this effect seems to be more pronounced under oxidative stress conditions (high fat diet, hypercholesterolemic and Apo E-deficient mice) [10]. A high fat diet was used in the present study to induce obesity in rats. Diets with the different grains were consumed to observe the effects of the experimental grains on oxidative stress produced by the high fat diet. Among the experimental grains, WR is a staple food of Koreans. The present study was carried out to evaluate and compare the nutritional quality, particularly with respect to fiber and antioxidant components, of AD, BW, and GB with WR. Dietary fiber and phenolic compounds, which are present in large amounts in whole grains, stimulate digestion by enhancing the activities of enzymes that participate in digestion and secretion of bile-rich bile acids [11].
We also examined how these grains affect the duration of residence of food in the gastrointestinal tract and hepatic enzyme activities in the rats fed different combinations of grains. Although each grain has different lipid and caloric contents, we used natural grains, because the intention of this study was to measure the effect of natural grains that are commonly consumed.
Materials and Methods
Animals and diet
Male Sprague-Dawley rats (n = 40; age, 4 weeks; weight, 50 g) were obtained from the Animal Center of Samtako, South Korea. All animals were cared for in accordance with the National Research Council's Guide for the Care and Use of Laboratory Animals.
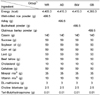
The 40 rats were adapted to their surroundings for 1 week before the study. The rats were then raised for 4 weeks on a high fat diet based on the American Institute of Nutrition-93G (AIN-93G) [12] diet containing 1% cholesterol and 20% dietary lipids to induce obesity. Subsequently, they were divided into four groups of 10 each using a randomized complete block design, and each group was fed one of the experimental diets for 4 weeks. The groups were assigned randomly to create similar body weights at the start of the trial. The experimental diets were prepared by modifying the AIN-93M diet [12] so that cereal powders accounted for 50% of the experimental diets instead of cornstarch (Table 1). All diet compositions except the grain powders were the same to evaluate the differences in the functions of the various grains. Referring to food values (Nutrient Composition Table for Foods, 2009) [13] published by The Korean Nutrition Society, the lipid contents of the experimental grains were 1.0% in WR (Kyungi, Nonghyup), 3.2% in AD (Kyungi, Nonghyup), 3.1% in BW (Kyungi, Nonghyup) and 1.0% in GB (Kyungi, Nonghyup) and calories per 100 g were 372, 374, 374 and 360 kcal, respectively. Accordingly, the energy contents were 4,405.3 kcal/kg in the WR diet, 4,415.3 kcal/kg in the AD diet, 4,415.3 kcal/kg in the BW diet, and 4,365.3 kcal/kg in the GB diet. The difference in energy content resulted from the differences in the composition of each grain.
Rats were housed in standard stainless steel cages at 24℃ in a humidity-controlled (60 ± 10%) room with a 12 h light and dark cycle (artificial light from 07:00-19:00). Rats received water and food ad libitum. At the end of the experiment, all rats were deprived of food overnight and sacrificed under ether anesthesia. The major organs of each rat were harvested, washed with ice-cold isotonic saline, and the weighed tissue samples were stored at -70℃ until analysis.
Measurement of dietary fiber
Grains were soaked in three volumes of citric buffer (pH 5.5) with continuous stirring for 2 hr in a 55℃ water bath, washed with deionized water, freeze-dried, ground to pass through an 80-mesh sieve (150 µm), and defatted with hexane. Dietary fiber from grains was analyzed by the AOAC method with modifications. Soluble (SDF) and water-insoluble dietary fiber (IDF) was prepared. One-hundred g of defatted grain powder was mixed with 500 mL phosphate buffer (pH 6.0) and treated with heat-stable α-amylase (Sigma Chemical Co., St. Louis, MO, USA) at 95℃ for 15 min with shaking every 5 min. The samples were then cooled, pH-adjusted to 7.5 ± 0.2 with 0.275 N NaOH, digested sequentially with amyloglucosidase (Sigma Chemical) at 60℃ for 30 min, then pH adjusted to 4.0-4.6 with 0.325 M HCl. Protease (Sigma Chemical) was added to the samples to remove protein and starch. Subsequently, the samples were reacted at 60℃ for 30 min and precipitated overnight with 95% ethanol at room temperature.
They were then filtered through a glass filter. The residue left was the IDF, and the filtrate was the SDF. After analyzing undigested protein and ash content, IDF content was determined as the value of the residual from which the amounts of the protein and ash content were subtracted. As to SDF, the residual liquid filtered through crucible was left after 90% ethanol was added, and then filtered again to be washed with ethanol and acetone. Then, the residues were treated using the same method as IDF to quantify SDF. Total dietary fiber (TDF) was determined as the added value of IDF and SDF.
Measurement of gut transit time
Gut transit time was monitored by including brilliant blue dye (0.5%) in all diets as an unabsorbable marker. The animals consumed their respective marker-containing diets immediately after a 3 hr-abstinence from their normal food between 16:00 and 19:00 to ensure that the food consumption habits of these nocturnal animals were not disturbed. The marker-containing diets were given at 19:00. The time of appearance of the first colored fecal pellet was recorded thereafter. This activity was monitored throughout the night to the next morning until the appearance of the first colored pellet. White filter paper sheets were spread underneath the cages to facilitate easy identification of the blue-colored feces.
Measurement of hepatic thiobarbituric acid reactive substance
The concentration of the lipid peroxide products of hepatic thiobarbituric acid reactive substance (TBARS), mainly malondialdehyde (MDA) [14], was measured by a method modified from Sinnhuber and Yu [15] using thiobarbituric acid, 1,1,3,3-tetraethoxy-propane (Aldrich Chemical Co., Seoul, Korea) as the standard. TBARS values were expressed as nmol per mg protein. Protein determination was performed by the Bradford method [16] using bovine serum albumin (Sigma Aldrich Korea Ltd., Seoul, Korea) as the standard. All assays were carried out in triplicate using a Beckman-Coulter DU 400 spectrophotometer (Fullerton, CA, USA).
Measurement of hepatic antioxidant enzyme activities
Superoxide dismutase (SOD, EC 1.15.1.1) activity was measured using a commercial kit (OXIS International Inc., Beverly Hills, CA, USA). The method is based on the SOD-mediated increase in the rate of autoxidation of 5, 6, 6a, 11b-tetrahydro-3, 9, 10-trihydroxybenzo [c]fluorine in aqueous alkaline solution to yield a chromophore with maximum absorbance at 525 nm.
Glutathione (GSH) level, glutathione peroxidase (GPx, EC 1.4.1.9), glutathione S-transferase (GST, EC 2.5.1.18) and glutathione reductase (GR, EC 2.5.1.18) activity were measured with a commercial kit (OXIS International). The GSH measurement is based on a chemical reaction that proceeds in two steps. The first step leads to the formation of substitution products (thioethers) between a patented reagent, 4-chloro-1-methyl-7-trifluromethyl-quinolinium methyl sulfate, and all mercaptans present in the sample. The second step is β-elimination, which occurs under alkaline conditions. The reaction is mediated by 30% NaOH, which transforms the substitution product (thioether) obtained with GSH into a chromophoric thione with a maximal absorbance wavelength at 400 nm. The GPx activity assay is based on a direct measurement of c-GPx activity. Oxidized glutathione (GSSG), produced upon reduction of an organic peroxide by c-GPx, is recycled to its reduced state by GR. The oxidation of NADPH to NADP+ is accompanied by a decrease in absorbance at 340 nm.
Statistical analysis
Statistical analyses were performed using SPSS/PC 11.0 (SPSS, Inc, Chicago, IL, USA). Data are expressed as mean ± standard error. Significant differences among mean values were assessed by one-way analysis of variance (ANOVA) coupled with Duncan's multiple range test. A P < 0.05 was considered significant.
Results
Dietary fiber contents of the experimental grains are presented in Table 2. TDF, SDF, and IDF contents in the experimental grains were highest in the GB group.
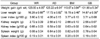
Weight gain and major organ weights are shown in Table 3. After completing 4 weeks of the high fat diets, the body weight gain was 125.00 ± 4.05 g in the WR group, 125.22 ± 6.01 g in the AD group, 113.67 ± 3.84 g in the BW group, and 101.90 ± 5.34 g in the GB group. The weight gain in the GB group was significantly lower than that in the WR and AD groups, whereas the BW group only tended to be slightly lower. Weight gain was higher in the WR and AD groups than that in the other groups. Accordingly, liver weight was significantly higher in the AD group than that in the BW and GB groups.
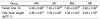
Gut transit time (time of appearance of the first colored fecal pellet) was shorter in the GB rats than that in the other groups (Table 4). Gut transit time corresponded to the dietary fiber contents of the experimental grains and was 9.40 h in the WR, 7.40 h in the AD, 7.89 h in the BW, and 5.80 h in the GB groups. Cumulative fecal weight over 72 h was highest in the GB group, whereas the WR, AD, and BW groups showed similar fecal weights.
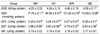
Oxidant and antioxidant status in liver tissue of the four groups is presented in Tables 5 and 6. No significant differences in the liver TBARS levels were found among the groups. SOD and GR did not differ among the four groups. GSH, GPx, and GST activities were higher in the GB and BW groups than those in the WR group.
Discussion
The role of whole grains in nutrition and health has been documented. Whole grains are recognized sources of several physiologically active components and health promoters [17]. It is also well known that bioactive substances occur in grains at different concentrations depending upon grain type.
Increased fiber intake generally increases fecal weight, but the effects of fiber on fecal weight cannot be explained by a single mechanism, as water-holding capacity, stimulation of bacterial proliferation, decreased transit time, and increased gas production all affect fecal weight [18]. Increased bulk in the colon due to undigested fiber and microbial proliferation decreases transit time, which, in turn, results in decreased water absorption [19]. Thus, fecal water and weight increase [20]. The differences in the gut transit time results seemed to be dependent on the difference in dietary fiber content. Corresponding to dietary fiber contents in the experimental grains (2.4% in WR, 4.3% in AD, 8.0% in BW, and 13.6% in GB), gut transit time was shortest in the GB rats and increased in order of BW, AD, and WR. In addition, the accumulated shortest transit time was highest in the GB group.
Gut transit time affects weight gain and major organ weight, as it is closely related to the nutrient absorption. Nutrient absorption is believed to be associated with food residence time in the small intestine, although the degree to which transit time or contact time normally limits absorption had not been established. Absorption of food depends on the rate at which nutrients can be taken up from the lumen and the length of time nutrients are in contact with the absorptive epithelium [11]. The WR group showed the highest weight gain and liver weight and also showed longer gut transit time than that in the other groups.
In previous studies regarding colored rice consumption, there were changes in antioxidant markers as liver total antioxidant capacity and erythrocyte SOD increases whereas liver reactive oxygen species and aortic MDA decreases [21,22]. Digestion increases the antioxidant capacity of cereal products [23,24]. The acidic conditions in the stomach and enzymatic hydrolysis in the duodenum are likely to increase the solubility and activity of cereal polyphenols [24]. Therefore, digestion appears to be an important factor potentiating the antioxidant capacity of high-bran, whole-grain, and refined cereal products [25]. For these reasons, we measured the effect of natural grains that people consume. Nagah and Seal [26] also demonstrated a significant influence of in vivo gastrointestinal digestion on increased antioxidant release from whole-grain cereal foods. The digestion of starch and protein may also increase the release of polyphenols. The antioxidant capacities of cereal and cereal products are quite high, particularly those of colored rice, AD, BW, barley, corn, and sorghum [27,28]. It is even equal or higher than those of some fruits and vegetables [27,29]. Nevertheless, the antioxidant potential of cereal products has long been neglected. TBARS are the most commonly used oxidation markers. In this study, the level of liver TBARS tended to be higher in rats in the order of rats fed WR, AD, BW, and GB, but the differences were not significant. This result indicates that the other grains tended to decrease oxidative stress in vivo more than that of WR. Simultaneously, consumption of AS, BW, and GB resulted in an improved antioxidative system and decreased peroxidative processes and oxidative stress damage. The GSH, GPx, and GST levels in the AD, BW, and GB groups were significantly higher than those in the WR group.
Diets with different grains were consumed to observe the effects of experimental grains after oxidative stress was generated by the high fat diet. Increased fiber intake generally increases fecal weight. The different gut transit time results observed seemed to be dependent on the difference in the dietary fiber contents. These results show the potential to moderate several health risk factors through changes in food without changing energy intake. In conclusion, reduced colonic transit time has been implicated in a reduction in the incidence of colon cancer, as evidenced by populations consuming diets rich in fiber [30]. Whole grains such as AD, BW, and GB may contribute to supply significant antioxidants to prevent oxidative stress, as grains are used as a staple food. Our results could have a direct impact on grain consumption by increasing consumer awareness of the health benefits of grains.


 XML Download