

 PDF
PDF ePub
ePub Citation
 Print
Print


Introduction
Although they originated in Asia, noodles have become one of the most popular foods in the United States. Growth in the domestic food use of wheat has accelerated during the last two decades and wheat flour is used to produce noodles. The U.S. market for pasta and noodles increased at a compound annual growth rate of 6.7% between 2003 and 2008, and the dried pasta/noodles category led the pasta and noodles market, accounting for 76.9% [1].
Japanese style (e.g., udon) and Chinese-type noodles (e.g., ramen) as well as spaghetti are frequently consumed in restaurants and at home. However, the effects of noodle consumption on the diet patterns and eating habits of Americans have not been studied in detail.
Examining patterns of food group consumption has emerged as an important focal point for understanding the role of diet in disease risk [2-4]. Instead of determining single nutrients, stratifying the food groups is more likely to reflect habitual food intake, and embody characteristics of the total dietary intake [2,4,5], and embody characteristics of the total diet, including all nutrient interactions.
However, in the case of noodles, little is known about noodle consumption patterns and the contribution that noodle provide in the American diet. Dietary patterns and food groups reflect different ethnic eating traditions [5]. Mediterranean and Asian diets are widely known to incorporate higher intakes of legumes, fish, vegetables, and fruits, contrasted with the American dietary pattern consisting of higher intakes of deep-fried fast foods, refined grains, processed meats, commercially baked products, and sweets. Understanding these ethnic differences in food group consumption becomes increasingly significant in the United States as the US Census Bureau has reported that, from 1990 to 2000, the foreign-born population increased by 57% to represent 13% of the total US population [6].
Bui and Small [7] analyzed the thiamin contents of white salted, yellow alkaline, and instant noodles that were manufactured differently. Fu [8] categorized noodle types by manufacturing methods and Miskelly [9] studied the historical aspects of noodles.
Noodle studies have focused on manufacturing methods or composition analysis, or have been confined to food and cultural studies, but there is little data on the effects of noodle consumption on diet and health status [10-28].
This article provides information on current noodle consumption patterns in the United States and the dietary intake of noodles by consumers in general. It also offers analyses of noodle consumers by income, race, and ethnicity. The primary objective of the research was to gain a better understanding of noodle consumption in the United States and whether consuming noodles has a beneficial effect on total diet, in which they may play a role in healthful eating. The contribution of economic, social, and demographic factors related to noodle consumption were examined. The differences in noodle consumption by income level and ethnic background provide insights into the factors that affect food selection among these groups. The results provide useful information for designing food programs and planning national food supply strategies.
Subjects and Methods
Data and procedures
We used data collected in the National Health and Nutrition Examination Survey (NHANES) 2001-2002 [29], conducted by the National Center for Health Statistics (NCHS) of the Centers for Disease Control and Prevention. Each survey was a stratified, multistage, national probability sample of the civilian noninstitutionalized population of the United States. The subjects surveyed in NHANES 2001-2002 were of all ages. All surveys collected dietary information with the use of a 24-h recall administered by trained dietary interviewers, and the dietary recalls collected for the NHANES 2001-2002 survey years used a computer-assisted dietary interview that included a 4-step multiple pass approach. In NHANES 2002, the dietary data were collected using a 5-step multiple pass approach with dietary recall methods that are part of the integrated US Department of Agriculture and NHANES protocol "What We Eat in America" [30].
Identification and classification of noodle consumers
The noodle consumers were identified and classified based on the intake of noodles consumed in food items. Information from the NHANES code book was used to identify foods that contained noodles. Foods containing noodles, spaghetti, macaroni, and pasta were included. Noodles from other sources (chicken noodle soup, etc.) were not counted in the selection. The classification of "noodle consumer" was assigned to individuals who reported eating noodles during one day, and other individuals were classified as non-consumers.
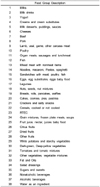
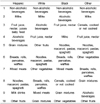
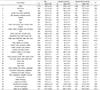
The food groups were classified according to USDA food group classifications and were regrouped as 38 food groups, including noodles (noodles, macaroni, pasta, spaghetti) (Table 1).
Statistical analysis
We examined the associations between noodle consumption variables and socioeconomic characteristics such as gender, age, income, and ethnicity. All statistical analyses were adjusted for the sample weights and the complex sample design of NHANES by using SAS (release 9.13, SAS Institute Inc., Cary, NC) and SUDAAN (release 10.1, Research Triangle Institute, Research Triangle Park, NC) [31]. All data sets were weighted to be nationally representative and standard errors were calculated by Taylor linearization variance estimation. Comparison of noodle consumption by gender was tested using t-tests, and Bonferroni multiple t-tests were used to analyze the differences in noodle intake by several ethnicity and income groups. The other ethnic groups such as "White", "Black", "others" were statistically compared with Hispanics. The Chi-square test was used to compare noodle consumption with age, gender, income, and ethnicity (The result of Chi-square test were not showed in table).
Results
The analysis and results based on the NHANES 2001-2002 data include basic information on noodle consumption as well as comparisons across other food groups showing the comparative importance of noodles in the diets of Americans.
Consumption of noodles and comparisons across demographic groups
To determine the positioning of noodles in the dietary patterns of Americans, we investigated the vast quantity of consumed food groups using NHANES data. The NHANES 2001-2002 data showed that noodle consumers (NC, 23.3%), those who had eaten noodles on one day of observed data, included 2,035 persons with 975 (47.9%) males and 1,060 females (52.1%). All others were classified as non-consumers (noodle non-consumers: NNC, 76.7%).
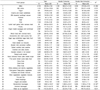
First, we researched the ranking of noodles for noodle consumers among the vast quantity intake foodstuffs. When the average amounts of consumption for the entire age ranges were considered, the ranking of noodles among the vast quantity intake foodstuffs was 5th, which included noodles, macaroni, pasta, and spaghetti. The consumption amount of non-alcoholic beverages was highest, followed by milk, alcoholic beverages, and fruit juices, in order (Table 2).
The results of NHANES 2001-2002 showed a total number of 2,035 individuals consumed noodles during the survey period. Among them there were 975 males and 1,060 females, indicating that the noodle consumption frequency of females was higher than that of males. The average amount of noodles consumed was 304.1 g a day. The average amount of noodles consumed by the males was 344.3 g, which is significantly higher than that of the females at 268.0 g (P < 0.01). As a result of chi-square tests; however, the relationships between gender and noodle consumption patterns were not significant.
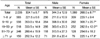
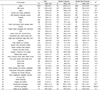
Across age groups, the highest noodle consumption was in 9-18 year-olds, with 353.0 g, followed by 19-50 year-olds with 333.5 g, 51-70 year-olds with 280.4 g, 71 years old and above with 252.3 g, and 1-8 year-olds with 221.5 g. In the case of males, the highest ratio of noodle consumers was for those between 19-50 years old. For both males and females, 9-18 year-olds consumed the highest amounts of noodles. Except for the 1-8 year-old consumers, males had higher noodle consumption than females across all age levels, where those who were 9-18 years old (P < 0.05), 19-50 years old (P < 0.01), and 70 years old and above (P < 0.05) had significantly higher intakes compared to the females (Table 3).
Table 3 shows the ranking of quantitatively consumed food groups by age. Noodles, including macaroni, pasta, and spaghetti, ranked in 5th place for individuals under age 8, 14-18, and 19-50 years old. Noodles ranked 4th for 9-13 year-olds and 9th for individuals over age 51. Population aged over 50 showed lower noodle consumption than the other age groups.
According to gender, noodle intake ranked 5th among the vast quantity food items for both males and females, and no difference in ranking appeared. In terms of quantity, non-alcoholic beverages were the most highly consumed food group for both men and woman. This was followed in the order of alcoholic beverages, milk, and fruit juice for the men, and milk, fruit juice, and fruit for the women.
After comparing the intakes of two age groups of consumers, those under 18 years old and 19 years old and above, significant relationships between age and noodle consumption (P < 0.0001) were found. Comparisons across males and females separately also resulted in significant relationships between age and noodle consumption. In addition, when comparing intake levels among 7 age groups: under 1 year old, 1~8 years old, 9~13 years old, 14~18 years old, 19~50 years old, 51~70 years old, and 71 years old and above, significant relationships between age and noodle consumption (P < 0.0001) were found. Furthermore, comparisons across age levels by dividing the subjects by gender revealed significant relationships between age and noodle consumption, except for those who were under 1 year old.
Income, ethnicity, and noodle intake
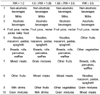
In order to examine the association between noodle consumption and the social/economic status, the PIR (Poverty Income Ratio) was used. The PIR refers to the poverty level ratio (or poverty threshold), which determines income or poverty. If PIR is 1.0, for instance, it implies living at the poverty level, and if PIR is 0.5, it indicates a living status at half under the poverty level. According to the U.S Census Bureau, a PIR of 0.5 means "severely poor", and a PIR 1.25 means "near poor". In accordance with the U.S PIR standards, we distinguished the groups into 4 categories: "below 1.0", "1.0-1.84", "1.85-3.5", and "above 3.5" to explore the rankings of food consumption by income level. For PIRs below 3.5, noodle intake ranked 5th without notable differences among the three PIR categories. On the other hand, in the higher income group with a PIR above 3.5, noodle intake ranked 8th and showed differences from other the three PIR groups. In the group with PIRs above 3.5, the 5th and 6th ranked food groups were fruits and vegetables, respectively, and the 8th was breads, rolls, pancakes, and waffles (Table 4).
The results of noodle intake by income showed that the ratio of noodle consumers was highest in the group with PIRs below 1.0, but it was concluded that noodle consumption was not significantly related to income. The relationships between noodle intake amounts and income levels did not show consistent outcomes (Table 5).
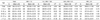
Differences in food consumption patterns are not only influenced by culture but also by ethnicity. In order to examine noodle consumption patterns by ethnicity, we categorized the groups into Hispanic, non-Hispanic White, non-Hispanic Black, and others. After analyzing the food groups most consumed according to ethnicity, noodles ranked at remarkably different positions (Table 6). Noodle intake ranked 8th for Hispanics, 6th for non-Hispanic Whites and 5th for non-Hispanic Blacks and others. Therefore, non-Hispanic Blacks and others consumed the most noodles while Hispanics consumed the least. Different from the other ethnic groups, ready-to-eat cereals ranked within the top 10 most consumed foods in those classified as "others", whereas the consumption of alcoholic beverages was less than those of the other ethnic groups.
The ratios of noodle consumers and intake amounts by ethnicity are shown in Table 7. The "other" ethnic group showed the highest noodle intake amount with 366.1 g, followed by Hispanics with 318.7 g, non-Hispanic whites with 298.6 g, and non-Hispanic Blacks with 289.5 g. The average noodle intake amount of White age 1-8 years old was 196.2 g, which was significantly lower than 254.9 g for Hispanics' of the same age (P < 0.01). According to the chi-square test results, the relationships between ethnicity and noodle intake were not significant.
Comparison of food consumption patterns between noodle consumers and non-consumers
After dividing the subjects by noodle consumers and non-consumers, we compared food consumption amounts for the 37 food groups for studying food group consumption pattern.
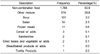
Based on re-categorized foods, we analyzed additional food items that noodles were consumed with, which showed a variety of ranges (Table 8). Those who ate only noodles without other foods accounted for 64%, while the remaining 36% consumed noodles with other foods. Those who dipped noodles in soup or mixed them with salad represented 3% and 2.5%, respectively. The results also indicate that frozen meals, ready-to-eat cereals, sandwiches, dried beans and vegetables, bread/baked products, and tortilla products were added when consuming noodle.
In all age groups, the noodle consumers showed significantly higher intakes of beef (P < 0.05), poultry (P < 0.05), sandwiches (P < 0.05), legumes (P < 0.01), breads (P < 0.01), ready-to-eat cereals (P < 0.05), grain mixtures (P < 0.01), white potatoes (P < 0.01), vegetable mixtures (P < 0.05), and nonalcoholic beverages compared to the non-consumers. On the other hand, the noodle consumer group tended to consume more milk, milk desserts, fish, tropical fruit, tomatoes, and alcoholic beverages, but there were no significant differences except for tomatoes (P < 0.05) (Table 9). In the noodle non-consumer group, those under 18 years old consumed more food from all food groups. The noodle non-consumers had significantly higher intakes of cream (P < 0.01), cheeses (P < 0.01), beef (P < 0.05), mixed meat with non-meat items (P < 0.01), ready-to-eat cereals (P < 0.05), grain mixtures (P < 0.05), fruit juice (P < 0.05), and beverages (P < 0.01). The noodle consumers seemed to consume more milk, meats, such as lamb, veal, game, and other meats, as well as tomatoes than the non-consumers (Table 10). In adults older than 19 years of age, the noodle non-consumers ate significantly more sandwiches (P < 0.05), legumes (P < 0.01), breads (P < 0.01), grain mixtures (P < 0.05), other fruits (P < 0.05), other vegetables (P < 0.05), and white potatoes (P < 0.05). The adult noodle consumers had a tendency to consume more milk, yogurt, fish, citrus fruit, and tomatoes (Table 11). From the results, the noodle consumers consumed more milk, fish, and fruits, and the non-consumers consumed more meat, legumes, breads, and beverages.
Discussion
This study provides information on noodle consumption in the United States and shows similarities and differences in the dietary sources of those who consume noodles compared to those who do not. The research focused on examining noodle consumers, understanding any differences in noodle consumption according to demographic factors, and analyzing how the food intake of noodle consumers differed from that of non-noodle consumers.
Even though noodles and ramen are not consumed frequently by all consumers in the United States, noodles are a main dietary source, especially for some ethnic groups. Moreover, the noodle consumers differed from the non-noodle consumers in their food intake. When the two groups were compared, the noodle consumers showed food choices that contained more tomatoes and less beef, poultry, sandwiches, legumes, breads, ready-to-eat cereals, grain mixtures, white potatoes, and vegetable mixtures. While a causal relationship was not found, noodle consumption was associated with the choice of other food groups that were consumed with noodles.
Age exerted a significant influence on noodle consumption, indicating that noodle intake may differ by demographic factors. Noodle intake also differed by ethnicity, showing cultural background to be an important factor for differences in food group intake and can affect the nutritional status of different ethnic groups. There were significant differences between ethnic groups in their rankings of the vast quantity intake foodstuffs as compared to other demographic factors such as gender, age, and PIR. Differences in noodle consumption among age and racial groups explain changes in both food preferences among the age groups and the different populations. In the case of the "other" ethnic group, including Asians, noodles and ready-to-eat-cereals held especially high rankings in the vast quantity intake foodstuffs. These results are due to Asian culture where noodles are a staple food. There are, however, a number of problems that remain to be explored. In this study, the source of data lacked accurate demographic information. NHANES data make no distinction between "other" ethnic groups. Therefore, it is difficult to research the actual conditions of noodle intake in various racial and ethnic groups belonging to the "other" category. Another limitation of our analysis is there was no consideration for eating location (at home or away from home).
The current study indicated that individuals consuming more noodles showed higher consumption of tomatoes. It is probable that the major sources of noodles are pasta and spaghetti. On the other hand, the noodle consumers had a tendency of consuming less amounts of vegetables, beans and domestic fowl as compared to those of non-noodle consumers. The inclusion of noodles in planning menus for school lunch programs or food assistance programs may further encourage the consumption of a varied diet that contains more vegetables, legumes, poultry, and beef. In addition, noodle consumers may benefit from new recipes in which noodles, particularly nutrient fortified noodles, are used in combination with vegetables and legumes. Finally, further research is necessary to examine shifts in noodle consumption by passage of time and demographic factors.


 XML Download