

 PDF
PDF ePub
ePub Citation
 Print
Print


Introduction
Obesity is the most prevalent health problem in developed countries and is a growing problem in developing countries. It serves as a high risk factor for morbidity and mortality from metabolic disorders such as type-2 diabetes, dyslipidemia, hypertension, coronary heart disease, atherosclerosis and numerous types of cancer (Gregoire et al, 1998). Excess fat mass, characterizing obesity, is usually caused by excessive energy storage over a prolonged period of time. At the cellular level, increases in adipose tissue occur as the result of lipid accumulation within pre-existing adipocytes or differentiation of vascular stromal cells within the adipose tissue into adipocytes (Rosen & Spiegelman, 2000).
To identify regulatory molecules which play key roles in the development of obesity, which in turn may serve as better therapeutic targets for obesity and related diseases, numerous investigations have focused on the adipocyte differentiation process. From these studies, adipogenic transcription factors and adipocyte-specific genes such as members of the CCAAT/enhancer binding protein (C/EBP), peroxisome proliferator-activated receptor (PPAR) families, sterol-regulatory element binding proteins (SREBPs) have been identified. In addition to studies using traditional cloning and gene identification techniques in a "gene by gene" manner, several investigations using microarray were performed on differentiation process of 3T3-L1 preadipocytes into adipocyte (Soukas et al., 2001). As a result of these genome-wide studies, many genes associated with the cell cycle, DNA replication, metabolism, signal transduction, cytoskeleton, protein turnover and splicing factors as well as some genes involved in transcriptional regulation were identified as genes differentially regulated during adipocyte differentiation (Burton et al., 2002; Guo & Liao, 2000; Ron & Habener, 1992; Soukas et al., 2001). Despite of a mountain of gene expression profiles, an understanding of the complete mechanism by which precursor cells become adipocytes is far from complete and the genetic regulatory network underlying adipogenesis has not yet been fully understood. For example, many genes that mark the differentiated adipocyte were expressed with different kinetics than SREBPs, C/EBPs, and PPARs. Genes known to have a PPARγ response element in its promoter, such as insulin-like growth factor-II, b3-adrenergic receptor and the phosphoenolpyruvate carboxykinase, are expressed only late in differentiation at day 4 and maximally at day 28, which is not consistent with the initial expression pattern of PPARγ (Soukas et al., 2001). Cytochrome coxidase VIIIH, glucose-6-phosphate isomerase and phosphofructokinase I also demonstrated a similar pattern of expression, however, their pattern differed from the expression profile of the aforementioned transcription factors. These observations lead to the speculation that potentially many other regulatory networks are involved in regulating their expression.
In this study, we investigated the transcriptional profiles in 3T3-L1 cells at the early stage of differentiation and analyzed the promoter sequences of differentially regulated genes for identifying common transcription regulators. This approach might provide useful information to establish genetic regulatory network from gene expression profiles.
Materials and Methods
Materials
All tissue culture materials were purchased from Gibco (Grand Island, NY, U.S.A.). Insulin, dexamethasone and MIX were from Sigma (St. Louis, MO, U.S.A).
Cell culture
3T3-L1 preadipocytes (A.T.C.C., Manassas, VA, U.S.A.) were cultured in Dulbecco's modified Eagle's medium (DMEM) with 10% (v/v) foetal bovine serum (FBS), 1% (v/v) penicillinstreptomycin (100 units/ml penicillin, 100 µg/ml streptomycin in 0.85% saline) and 1% (v/v) 100 M pyruvate at 37℃ in 95% air, 5% CO2. To induce differentiation, 2-day postconfluent 3T3-L1 preadipocytes (day 0) were stimulated for 72 h with 0.5 mM MIX, 0.5 M dexamethasone and 10 µg/ml insulin (MDI) added to DMEM/10% FBS culture medium. On day 3, the MDI medium was replaced with DMEM/10% FBS, which was changed every 2 days thereafter until analysis.
Oil Red O staining
3T3-L1 preadipocyte and adipocyte cells were stained with Oil Red O essentially as described by Ramirez-Zacarias, Castro-Munozledo, and Kuri-Harcuch (Ramirez-Zacarias et al., 1992). Briefly, the 3T3-L1 cells were fixed in 10% formalin for 90 min. After washing thoroughly with distilled water, cells were incubated with a working solution of Oil Red O for 3 h. The staining of lipid droplets in 3T3-L1 preadipocyte and adipocyte cells was quantified using a phase-contrast microscope and Image-Pro Plus software from Media Cybernetics (Carlsbad, CA).
Quantitative analysis of intracellular triglyceride (TG) accumulation
For analysis of the intracellular TG content, the cells were washed with PBS and harvested using lysis buffer (50 mM Tris, 1 mM EDTA, 1 mM beta-mercaptoehtanol, 10 mM MgCl2, 0.15 mM NaCl, and 1 mM phenylmethylsufonyl fluoride, pH 7.5). Subsequent to sonicating the samples, spectroscopic quantification of TG was performed using the enzyme coupled glycerol assay kit 337 (Sigma Diagnostics, Deisenhofen, Germany). The protein content was determined by the method of Bradford using bovine serum albumin (BSA) as the standard (Bradford, 1976). TG content was expressed as µg TG per g protein.
Microarray analysis
Mouse 10K cDNA microarray used in this study consisted of 10,336 spots, as previously described (Ahn et al., 2004). It included 6531 transcripts from the National Institute of Aging (NIA), 1243 transcripts from the Brain Molecular Anatomy Project (BMAP), 2060 transcripts from InCyte Pharmaceuticals (Fremont, CA, USA), and yeast DNA and housekeeping genes as negative control.
Total RNA was prepared from cells using Trizol (Invitrogen, Carlsbad, CA, USA). Fluorescence-labeled cDNA probes were prepared from 20µg of total RNA by using an amino-allyl cDNA labeling kit (Ambion, Austin, Texas, USA). At least four replicates were performed, and two of these were repeated with the fluorophores reversed to eliminate false-positive results. The Cy5 and Cy3 probes were mixed, and hybridization was performed at 55℃ for 16 h, as previously described (Ahn et al., 2004).
The two fluorescent images (Cy3 and Cy5) were scanned separately by a GMS 418 Array Scanner (Affymetrix, Santa Clara, CA, USA), and the image data were analyzed using ImaGene 4.2 (Biodiscovery, Santa Monica, CA, USA) and MAAS (Gaiagene, Seoul, Korea) software (Kim et al., 2001). For each hybridization, emission signal data were normalized by multiplying the Cy3 signal values by the ratio of the means of the Cy3 and Cy5 signal intensities for all spots on the array. The criteria to eliminate unreliable data were previously described (Kim et al., 2004).
In this analysis, we calculated the median value of gene expression ratio from four independently repeated microarray experiments. We used the modified t-tests, SAM method to evaluate statistical significance of changes in gene expression (Tusher et al., 2001). We took the genome-wide significance level at the SAM (δ)=0.66 and adopted a cutoff of 2.0-fold change based on our experiences. Genes showing significant differences in expression levels were classified into different functional categories, based on Gene Ontology (GO) with modifications.
Real-time quantitative PCR analysis and melting curve analysis
Four micrograms of total RNA was reverse-transcribed in 25 µl of reaction mixture, containing 2.5 U MuLV reverse transcriptase, 1 U RNAse inhibitor, 5 mM MgCl2, 50 mM KCl, 10 mM Tris HCl (pH 8.3), 2.5 µM oligo (dT) primer, and 1 mM dNTPs. The reaction mixture was heated to 42℃ for 60 min and then denatured at 85℃ for 5 min. cDNA was amplified with ICycler (BioRad, Hercules, CA, USA) in 50 µl of reaction mixture containing AmpliTaq DNA polymerase (0.04 U/µl, Perkin Elmer, Shelton, Connecticut), 50 mM Tris (pH 8.3), 3 mM MgCl2, 0.25 mM dNTPs, 1/50,000 dilution of SYBR Green I (Molecular Probes, Eugene, OR), and 0.25 µM appropriate sense and antisense PCR primers. The sequences of the primers were as follows: fatty acid synthase (Fasn) forward, 5'-TCC ACC TTT AAG TTG CCC TG-3', reverse, 5'-TCT GCT CTC GTC ATG TCA CC-3' aldolase1 forward, 5'-CTA CAA GGC TCT GAG CGA CC-3', reverse, 5'-ACA GGA AAG TGA CCC CAG TG-3' carnitine palmitoyltransferase 2 (Cpt2) forward, 5'-CAC AAC ATC CTG TCC ACC AG-3', reverse, 5'-CAT TGC AGC CTA TCC AGT CA-3' peroxisome proliferator-activated receptorγ (Pparg) forward, 5'-CAA GAC TAC CCT TTA AGT GAA-3', reverse, 5'-CTA CTT TGA TCG CAC TTT GGT-3' Iroquois related homeobox 5 (Drosophila) (Irx5) forward, 5'-CTG TCC CGG CCT CTT TAT TAC A-3', reverse, 5'-ACC GTC TGG TTT AAT CCA TTG A-3' transforming growth factor, beta 3 (Tgfb3) forward, 5'-CCT GGC CCT GCT GAA CTT G-3', reverse, 5'-GAC GTG GGT CAT CAC CGA T-3' Transforming growth factor, beta receptor II (Tgfbr2) 5'-CCG CTG CAT ATC GTC CTG TG-3', reverse, 5'-AGT GGA TGG ATG GTC CTA TTA CA-3' Mitogen-activated protein kinase 6 (Mapk6) 5'-CAT GGA CTT AAA ACC ATT GGG CT-3', reverse, 5'-TGA GGA CAA TTT TCT TGA TGG CT-3' Metallothionein 1 (Mt1) 5'-AAG AGT GAG TTG GGA CAC CTT-3', reverse, 5'-CGA GAC AAT ACA ATG GCC TCC-3' Metallothionein 2 (Mt2) 5'-GCC TGC AAA TGC AAA CAA TGC-3', reverse, 5'-AGC TGC ACT TGT CGG AAG C-3' Caveolin, caveolae protein 1 (Cav1) 5'-ATG TCT GGG GGC AAA TAC GTG-3', reverse, 5'-CGC GTC ATA CAC TTG CTT CT-3' Fatty acid binding protein 4, adipocyte (Fabp4) 5'-AAG GTG AAG AGC ATC ATA ACC CT-3', reverse, 5'-TCA CGC CTT TCA TAA CAC ATT CC-3' Serine (or cysteine) peptidase inhibitor, clade F, member 1 (Serpinf1) 5'-GCC CTG GTG CTA CTC CTC T-3', reverse, 5'-CGG ATC TCA GGC GGT ACA G-3' Serine (or cysteine) peptidase inhibitor, clade E, member 2 (Serpine2) 5'-CAC ATG GGA TCG CGT CCA TC-3', reverse, 5'-CAG CAC TTT ACC AAC TCC GTT TA-3' Activating transcription factor 4 (Atf4) 5'-ATG GCG CTC TTC ACG AAA TC-3', reverse, 5'-ACT GGT CGA AGG GGT CAT CAA-3' Activating transcription factor 5 (Atf5) 5'-CTT CTC TGA TTG GAT GAC TGA GC-3', reverse, 5'-CCT TCT TGA GTA GGG ATG CCA T-3' Early growth response 1 (Egr1) 5'-GTT ATC CCA GCC AAA CGA CTC-3', reverse, 5'-GGT TCA GGC CAC AAA GTG TT-3' β-actin forward, 5'GGG TCA GAA GGA CTC CTA TG-3' reverse, 5'GTA ACA ATG CCA TGT TCA AT-3' The following cycling conditions were used: one denaturing cycle at 95℃ for 5 min, followed by 30 cycles of 95℃ for 30 s, 60℃ for 45 s, and 72℃ for 1 min. Relative RNA levels were determined by analyzing the changes in SYBR Green I fluorescence during PCR according to the manufacturer's instructions. β-actin was amplified in parallel and the results were used for normalization. The correct size of PCR product was confirmed by electrophoresis on a 2% agarose gel stained with ethidium bromide. Purity of the amplified PCR products was determined by melting point analysis using the ICycler software.
Promoter analysis
Promoter analysis was performed using PAINT v3.0 as previously described (Addya et al., 2004). PAINT v3.0 contains a database of promoters (UpstreamDB) constructed for all the annotated genes (known and putative) in the Ensembl genome database for Mus musculus, containing 24,261 genes (Clamp et al., 2003). Promoter analysis for putative TREs, i.e., binding sites for known transcription factors (TFs) was performed by MATCH tool using TRANSFAC database version 7.2. For each gene, 2,000 base pairs (bp) upstream (5' to the transcription start site) were analyzed. For each group of genes analyzed, the P values for significance of enrichment of each TRE in that group were calculated using hypergeometric distribution, by comparing the abundance of each TRE to that from a reference set of randomly selected genes.
Results
Histological and biochemical analysis of adipocyte differentiation
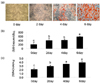
The 3T3-L1 preadipocytes differentiated to adipocytes in response to the administration of dexamethasone, indomethacin, 3-isobutyl-1-methyl-xanthine, and insulin as previously described (Pittenger et al., 1999). As shown in Fig. 1(a), a few cells accumulating lipid vesicles were observed at the 2nd day following stimulation, and then the lipid droplet-containing cell population was increased in a time-dependent manner up to day 6. Accumulation of triglycerides in cells was also increased in a time-dependent manner up to day 6 (Fig. 1(b)).
Identification of genes differentially regulated during 3T3-L1 preadipocyte differentiation
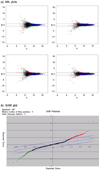
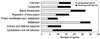
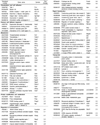
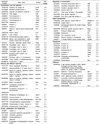
To identify genes differentially regulated during 3T3-L1 preadipocyte differentiation, about 10,000 gene expression levels in differentiation cocktail treated 3T3-L1 cells were compared with those of vehicle-treated cells as control. Only the genes, whose mRNA levels were changed 2.0-fold or higher and detected as significant change by SAM method, were designated as differentially expressed genes (Fig. 2). By these criteria, 161 genes were found to have significant changes in expression at the 2nd day following treatment with differentiation cocktail (Table 1, 2). Of these 161 transcripts, 86 transcripts were up-regulated and 75 transcripts were down-regulated. The 161 transcripts were classified into 10 categories according to their functional roles: cytoskeleton, cell adhesion, immunity, defense response, metabolism, protein modification, protein metabolism, regulation of transcription, signal transduction and transporter (Fig. 3).
Verification of the microarray results with Real-time RT PCR
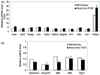
To validate the differential gene expression revealed by cDNA microarray-based profiling of 3T3-L1 adipogenesis, real-time quantitative RT-PCR was carried out for several selected genes; fatty acid synthase (Fasn), aldolase1, carnitine palmitoyltransferase 2 (Cpt2), peroxisome proliferator-activated receptorγ (Pparg), Iroquois related homeobox 5 (Drosophila) (Irx5), transforming growth factor, beta 3 (Tgfb3), Transforming growth factor, beta receptor II (Tgfbr2), Mitogen-activated protein kinase 6 (Mapk6), Metallothionein 1 (Mt1), Metallothionein 2 (Mt2), Caveolin, caveolae protein 1 (Cav1), Fatty acid binding protein 4, adipocyte (Fabp4), Serine (or cysteine) peptidase inhibitor, clade F, member 1 (Serpinf1), Serine (or cysteine) peptidase inhibitor, clade E, member 2 (Serpine2), Activating transcription factor 4 (Atf4), Activating transcription factor 5 (Atf5) and Early growth response 1 (Egr1). These genes were chosen from the metabolism, transcriptional regulation, signal transduction and protein modification categories based on the GO terms because these cellular processes have been reported to be important in adipogenesis (Gregoire et al., 1998; Heath et al., 2000; Ntambi & Kim, 2000; Rosen et al., 2000; Soukas et al., 2001; Yoon et al., 2001). The expressions of Fasn and Cpt2 involved in metabolism were increased by 4.6- and 2.4-fold during adipocyte differentiation, respectively. Transcription factors, Pparg and Irx5 were also increased by 3.5- and 4.2-fold. Several genes that play roles in signal transduction and transport also showed expression patterns similar to those described above Tgfb3 (3.5-fold), Tgfbr2 (2.2-fold), Mapk6 (2.2-fold), Mt1 (1.7-fold) Mt2 (3.3-fold), Cav1 (2.1-fold) and Fabp4 (27-fold). On the other hand, Serpinf1, Serpine2, Atf4, Atf5 and Egr1 were decreased after treatment with differentiation cocktail by 28, 19, 28, 40, and 35% (Fig. 4).
In general, when gene expression profiles obtained by both microarray analysis and RT-PCR were compared, their patterns were very similar with regards to the direction (up- or down-regulation) and degree of differences in expression. These observations confirmed that the microarray data were reliable.
Promoter analysis
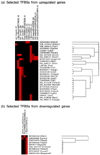
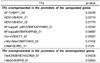
Promoter analysis was performed for the up- or down-regulated genes using PAINT v3.0 to identify biologically relevant transcription factor binding sites or TFBSs, found in the regulatory regions of these genes. For each gene differentially expressed during adipocyte differentiation, the regions which fell within 2000 base pairs (bp) upstream of the transcription start site (TSS) were analyzed. Table 3 shows TFBSs overrepresented in the promoters of the up- or down-regulated genes and P-values. We adopted P-value cutoff of 0.05 to select over-represented TFBSs. The binding sites of AP-1, HEN1, NF-kappaB (p65), NF-kappaB, Oct-1, c-Myc-Max and c-Rel were selected as over-represented TFBSs for genes increased during adipocyte differentiation. NGFI-C, Tax/CREB and v-Myb binding sites were selected as over-represented TFBSs for genes decreased during adipogenesis (Table 3, Fig. 5).
Discussion
Differentiation toward adipocytes in differentiation cocktailtreated 3T3-L1 cells was evidenced by lipid accumulation in the cells coupled with up-regulation in mRNAs characteristic of adipocytes [Lipase, hormone sensitive (Lipe), Fatty acid synthase (Fasn), Pparg, and CCAAT/enhancer binding protein (C/EBP), alpha (Cebpa)] (Gregoire et al., 1998; Heath et al., 2000; Ntambi & Kim, 2000; Rosen et al., 2000; Soukas et al., 2001; Yoon et al., 2001).
At the early differentiation stage, genes involved in cytoskeleton and cell adhesion were affected. Talin 1 (Tln1), Myosin Vb (Myo5b), Keratin complex 1, acidic, gene 10 (Krt1-10), Kelch-like 2, Mayven (Drosophila) (Klhl2), Integrin beta 1 binding protein 1 (Itgb1bp1), Glycoprotein 5 (platelet) (Gp5) and Chondroitin sulfate proteoglycan 2 (Cspg2) were up-regulated over 2-fold. Otherwise, Thrombospondin 1, 2, and 3, Caldesmon 1, Calponin 1 and 2, Procollagen I, III, V, and XI, and tissue inhibitor of metalloproteinase 2 (Timp2) were down-regulated over 2-fold during early adipogenesis. The differentiation of 3T3-L1 cells involves a dramatic alteration in cell morphology from a flattened fibroblast to a spherical adipocyte. Therefore, dynamic changes in expression of genes involved in cytoskeleton and cell adhesion are not unexpected during the differentiation process.
Genes associated with immune and defense response were also differentially regulated; Superoxide dismutase 2, mitochondrial (Sod2), Lipopolysaccharide binding protein (Lbp), Interferon activated gene 203 (Ifi203) and Chemokine (C-X-C motif) ligand 13 (Cxcl13) increased over 2-fold. Heme oxygenase (decycling) 1(Hmox1), Histocompatibility 2, D region locus 1 (H2-D1), Serine (or cysteine) peptidase inhibitor, clade E, member 2 (Serpine2), Serine (or cysteine) peptidase inhibitor, clade F, member 1 (Serpinf1), Serine (or cysteine) peptidase inhibitor, clade H, member 1 (Serpinh1), Beta-2 microglobulin (B2m), Complement component 1, r subcomponent (C1r) and Complement component 1, s subcomponent (C1s) decreased.
Genes involved in metabolism, such as Triosephosphate isomerase 1 (Tpi1), Transaldolase 1 (Taldo1), Sterol carrier protein 2, liver (Scp2), Stearoyl-Coenzyme A desaturase 1 (Scd1), Pyruvate kinase, muscle (Pkm2), Pyruvate carboxylase (Pcx), Phosphoglycerate mutase 1 (Pgam1), NAD(P) dependent steroid dehydrogenase-like (Nsdhl), Myo-inositol 1-phosphate synthase A1 (Isyna1), Glutamate-cysteine ligase, catalytic subunit (Gclc), Diacylglycerol O- acyltransferase 1 and 2 (Dgat1, Dgat2), carnitine palmitoyltransferase 2 (Cpt2) and acyl-CoA synthetase long-chain family member 1 (Acsl1), showed increased expression patterns. Increase in expression levels of Scd1, Pcx, Lipe, Fasn and Pparg genes is consistent with the previous reports (Heath et al., 2000; Soukas et al., 2001).
In addition to Pparg and Cebpa mentioned above, 13 genes involved in regulation of transcription were affected during early adipogenesis; TSC22 domain family 3 (Tsc22d3), NMDA receptor-regulated gene 1 (Narg1), Myelocytomatosis oncogene (Myc), Iroquois related homeobox 5 (Drosophila) (Irx5), Forkhead box B2 (Foxb2), Alpha thalassemia/mental retardation syndrome X-linked homolog (human) (Atrx) were up regulated over 2.0-fold. Increases in gene expression and activities of Pparg, Cebpa and Myc have been known to induce many lipogenic genes and their regulators playing pivotal roles in adipogenesis (Heath et al., 2000; Pulverer et al., 2000). Activating transcription factor 4 and 5 (Atf4, Atf5), Interferon regulatory factor 8 (Irf8), Nuclear factor I/B (Nfib), Twist gene homolog 1 (Drosophila) (Twist1), Early growth response 1 (Egr1) and Four and a half LIM domains 2 (Fhl2) were down-regulated over 2-fold. Activating transcription factor 2 was previously shown to be decreased during adipogenesis (Burton et al., 2004). The roles of transcription factors previously unappreciated in the
generation of differentiated adipocytes remain to be determined.
Many genes involved in signal transduction exhibit dynamic changes in expression. One of the most interesting results was that genes in the transforming growth factor, beta (TGFβ) signal pathway were expressed an average 2.5-fold higher in the 3T3-L1 cells at the early differentiation. Transforming growth factor, beta 3 (Tgfb3), and transforming growth factor beta receptor II and III (Tgfbr2, Tgfbr3 ) were increased by 2.5-, 1.2 and 1.2-fold during adipocyte differentiation. Regulator of G-protein signaling 2 (Rgs2) (up-regulated by 5.2-fold), Metallothionein 1 and 2 (Mt1 and Mt2) (up-regulated by 1.3- and 2.0-fold), Insulin-like growth factor binding protein 4 (Igfbp4) (up-regulated by 2.5-fold) showed similar expression patterns. Rgs2 was previously isolated as a gene which is induced at the earliest stage of adipocyte differentiation (Imagawa et al., 1999; Nishizuka et al., 2001). Induction of Rgs2 was stage-specific, occurring in the confluent cells but not in the proliferating cells, indicating that the expression of Rgs2 is closely related to adipocyte differentiation. MTs are also induced in 3T3-L1 mouse fibroblasts during adipocyte differentiation and suggested to play a role in adipocyte differentiation (Schmidt & Beyersmann, 1999; Traythurn et al., 2000a; Traythurn et al., 2000b). The level of MT-2A mRNA in subcutaneous fat tissues was found to be significantly higher in obese subjects (Do et al.,2000). Our results were consistent with these previous reports.
Genes coding for transporter proteins were also affected. Fatty acid binding protein 4 (Fabp4), adipocyte increased (18-fold) during adipogenesis, as previously reported (Burton et al., 2004). Annexin A5 was decreased by -2.1-fold, which is consistent with a previous report (Burton et al., 2004).
Regulatory regions in promoters of differentially expressed genes provide insight into potential coordinate regulation of gene expression. PAINT analysis identified binding sites for transcription factors known to serve important roles in cell proliferation, differentiation and developmental processes in other systems; AP-1, HEN1, NF-kappaB family, Oct-1, c-Myc/Max, Tax/CREB, and v-Myb. Rapid and transient induction of AP-1 was shown during the conversion of 3T3-L1 cells to adipocytes (Ishida et al., 1988). Up-regulation of c-Myc during adipose differentiation was observed in our microarray analysis. In addition, increases in gene expression and activities of Myc have been shown in previous studies (Heath et al., 2000; Pulverer et al., 2000). Adipogenesis is associated with changes in amount and subunit composition of the NF-kB complexes. NF-kB subunits p65 (RelA), p68 (RelB), and IkB were shown to be up-regulated during fat cell differentiation. Correspondingly, basal NF-kB nuclear gel shift and luciferase reporter assays were also shown to be induced in parallel during differentiation (Berg et al., 2004). Oct-1 was shown to be involved in TNFα-induced decreases in adipocytes differentiation and LPL gene transcription (Morin et al., 1995).
It is noteworthy that TFBS for HEN1 not known to be expressed during adipocyte differentiation were found to be significantly enriched in this promoter analysis (see Table 3).
HEN1 was originally discovered because of its homology within the bHLH motif to the hematopoietic transcription factor and oncogene SCL (Begley et al., 1992). HEN1 expression is confined to the nervous system, and has been observed to be induced throughout embryonic development (Begley et al., 1992). The roles of HEN1 in the generation of differentiated adipocytes remain to be determined.
In summary, we investigated the transcriptional profiles in 3T3-L1 cells at early stage of differentiation and analyzed the promoters of differentially regulated genes using bioinformatics. This information will be useful for establishing the regulatory network among genes involved in adipogenesis. Further studies of promoter occupancy and transcription factor perturbation are now required to provide a functional validation of the TFBSs identified in this study, as well as the TFs that bind to them.
 XML Download