

 PDF
PDF ePub
ePub Citation
 Print
Print


INTRODUCTION
Curry rice is a popular dish in many countries, including Korea. The distinct yellow color of curry or turmeric, is primarily derived from a polyphenolic compound, curcumin [1,7-bis(4-hydroxy-3-methoxyphenyl)-1,6-heptadien-3,5-dione]. The potential health-beneficial effect of turmeric and its active component, curcumin, has been recognized; as such, there is an increasing interest in turmeric and turmeric-enhanced products [1].
A number of preclinical studies have demonstrated that curcumin exerts various biological activities, including anti-inflammatory, lipid-lowering, and anticancer properties [234567]. In addition, clinical studies indicate that curcumin enhances cardiovascular health and insulin sensitivity [89101112]. However, the dose required to achieve these biological activities may vary, depending on existing disease conditions [1]. For example, the anticancer effect of curcumin may require high concentrations (1.5 to 4 g/day) [1314], whereas less than 0.5 g of curcumin may be effective in treating some inflammatory conditions [1516].
Turmeric has been commonly used for flavoring and color in food preparation, and for the treatment of inflammatory conditions in South Asia [17], leading to the high consumption in these regions. In most other countries, including Korea, where turmeric is not a main ingredient for food preparation, the consumption rate for turmeric is low [1]. In these countries, curry may be the major curcumin-containing food. Previous studies indicate that regular curry consumption may be beneficial especially in the elderly, who have dysregulated physiological functions [10], although the consumption level observed is not as high as in South Asia. Therefore, it might be valuable to evaluate whether curcumin consumption through ordinary diet can exert any health-beneficial effects in a population where turmeric is not a popular ingredient.
In this study, the consumption level of curry, a major curcumin-containing food, was assessed using the Korea National Health and Nutrition Examination Survey (KNHANES) Food Frequency Questionnaire (FFQ). This study evaluated whether the consumption of curry in the typical Korean diet can affect the blood glucose and lipid levels that are dysregulated in older individuals.
SUBJECTS AND METHODS
Study design
This study evaluated the relationship between curry consumption and blood lipid levels, blood glucose levels, and glycated hemoglobin (HbA1c), using the data obtained from KNHANES, a nationwide survey program conducted by the Korea Center for Disease Control and Prevention to access the health and nutritional status of Koreans. KNHANES collected information on the socioeconomic status, health-related behavior, quality of life, anthropometric measure, biochemical and clinical profiles of approximately 10,000 individuals, aged one and older, every year [118].
Estimation of curry consumption
The curry consumption was estimated using the KNHANES FFQ data conducted in 2012 and 2013 where the food consumption of individuals aged 19 to 64 was collected. Curry rice was the only curry-related food among the food items surveyed. The midpoint of each category was taken from the pre-coded frequency category, and converted into the frequency of consumption per month. The frequency of curry consumption per month was multiplied by the self-reported portion size, to derive the monthly mean intake of curry. According to the frequency of their curry consumption, subjects were divided into three groups: the low consumption group (LC; "almost never", or "once a month"), the moderate consumption group (MC; "2-3 times a month" or "once a week"), and the high consumption group (HC; "2-4 times per week", or "5-6 times per week").
Statistical analysis
SAS software (version 9.3, SAS Institute Inc., Cary, NC) was used for the data preparation and statistical analyses. Two years (2012 and 2013) of KNHANES data were combined to assess the characteristics of individuals, according to the level of curry consumption, and to evaluate the relationship between curry consumption and blood glucose levels or lipid profiles. A multistage sampling design was considered for all data generation and analysis. Since only 48 individuals were included in the HC, they were excluded from the statistical analysis. Chi-squared tests and t-tests were performed to determine the differences in the demographics and health-related characteristics between the LC and MC groups. The resulting p-values less than 0.05 were considered significant.
Individuals aged 30 and over were subjected to a comparison of their health-related characteristics. For the comparison of blood test measurements according to their curry consumption level, individuals were further stratified to control for the known confounding factors of age (young: 30 to 44; old: 45 to 64), sex (male/female), and body mass index (BMI; underweight: < 18.5; normal: 18.5 to 24.9; overweight: ≥ 25). Since the BMI in the underweight category was less (i.e. certain age-sex subgroups contained less than 10 individuals), these individuals were eliminated from the statistical analysis. Potential confounding variables other than age, sex, and BMI were examined using an analysis of covariance; they included dietary supplement use (yes, no), hypertension (yes, no, borderline hypertension), diabetes (yes, no, prediabetes), dyslipidemia (yes, no), instant noodle consumption (low: "almost never", "once a month", or "2-3 times per month"; high: "one time per week", "2-4 times per week", or "5-6 times per week"), tobacco use (never, past, current use), and physical activities (low: "never", or "one day per week"; intermediate: "2", "3", or "4 days per week"; high: "5", "6", or "7 days per week"). Non-responders for the above variables were excluded from the analysis. A multivariate analysis was conducted for the identified confounders, and adjusted means were estimated for each blood test measurement. A significance level was set at p-values less than 0.05.
RESULTS
Estimation of curry consumption by FFQ
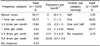
Curry rice, simply "curry", was the only curry-related food item surveyed. Half of the population almost never consumed curry over the course of a single year (Table 1). Individuals who consumed curry mostly had it once a month, or 2-3 times a month, with very few (< 1%) having it more than once a week (Table 1). Nobody reported consuming curry more than once in a day. The majority of subjects (80%) reported the intake of 1 serving of curry each time (Table 1). The monthly curry consumption was lower at the age of 50 and over (0.51 servings per month) compared to the younger ages (about 1 serving per month) among those individuals who consumed curry (Table 2).
Demographic and health-related characteristics of individuals with different levels of curry consumption
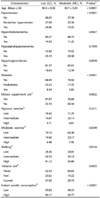
Subjects were divided into three groups according to their frequency of curry consumption. Their demographic characteristics are described in Table 3. The estimated mean curry consumption was 0.33, 2.80, and 13.70 servings per month in the LC, MC, and HC, respectively. These were equivalent to the consumption of less than 0.01, 0.05, and 0.26 g of turmeric per day, respectively. A high frequency of curry consumption occurred in the younger age group; individuals between the ages of 30 and 39 were frequent in the MC (32.1%), while individuals between the ages of 19 and 29 were frequent in the HC (45.2%). In comparison, these age groups comprised less than 23% of the LC. The HC resembles the MC more than the LC in its demographic characteristics, with the exception of the type of residence and education level (Table 3). Due to the low frequency (only 48 individuals), the HC was eliminated from the statistical analysis. The MC included more females (53.4%) than the LC (48.9%). Individuals in the MC more frequently resided in non-apartment residences (47.6%) and had a lower education (54.3% in the "university or above" category) in comparison to 41.5 and 63.4%, respectively, in the LC. There were no significant differences in the residential area and individual income between the two groups (Table 3).
Subjects aged 30 and older were examined for their health-related characteristics (Table 4). The mean age was significantly lower in the MC (42.7) compared to the LC (46.3). Significantly more individuals had diagnoses of hypertension (24.9), hypercholesterolemia (14.4%), hypertriglyceridemia (18.6%) and diabetes (8.3%) in the LC than the MC (19.3, 11.3, 12.4, and 5.8%, respectively) (Table 4). The MC had a significantly higher frequency of dietary supplement use (53.7%), moderate exercise (30.6%), and walking (80.0%) compared to the LC (47.7, 25.9, 75.7%, respectively), whereas non-tobacco users were more frequent in the MC (60.1%) compared to the LC (52.3%). The frequency of instant noodle consumption was significantly higher in the MC (50.8%) than the LC (40.2%) (Table 4).
Anthropometric and blood test measurements of individuals with different levels of curry consumption
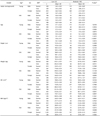
Subjects aged 30 and older were stratified into 12 groups, according to their age, sex, and BMI. Those who were underweight (BMI < 18.5) were eliminated due to the low numbers. Tables 5 and 6 describe the anthropometric and blood test measurements in the remaining groups. The mean age was not significantly different according to the curry consumption level except for the old-female-normal weight subgroup (Table 5). The anthropometric measurements were not significantly different according to the curry consumption level. However, in the old-male-overweight subgroup, individuals in the MC had lower (P = 0.0591) waist circumferences than the individuals in the LC (Table 5). The total cholesterol level was significantly higher in the old-female-normal weight subgroup, while the triglyceride (TG) level was significantly lower in the old-male-overweight subgroup, according to curry consumption (Table 6). The level of HbA1c was lower (P = 0.0548) according to the curry consumption in the young-male-normal weight subgroup. There were no significant differences in blood levels of glucose and HDL cholesterol according to the curry consumption in any of the subgroups (Table 6). The compliance rate for the measurement of LDL cholesterol was very low; therefore, its statistical significance could not be considered (data not shown).
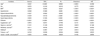
Since blood levels of glucose and lipids are influenced by disease conditions (e.g. diabetes and dyslipidemia), physical activity, and tobacco use, an analysis of covariance was conducted to identify potential covariates for each blood measurement. The diagnosis of diabetes and moderate exercise were confounders for both the glucose and HbA1c levels (Table 7). Additionally, glucose levels were confounded by hypertriglyceridemia, and HbA1c levels were modulated by hypercholesterolemia and tobacco use (Table 7). The TG levels were confounded by the diagnoses of all tested disease conditions (hypertension, dyslipidemia, and diabetes) and tobacco use (Table 7). The total cholesterol level was similarly influenced as observed in the TG levels except for the tobacco use (Table 7). The HDL cholesterol level was modulated by the diagnosis of all tested conditions except hypertension, tobacco use, and instant noodle consumption (Table 7). The use of dietary supplements, vigorous exercise, and walking did not significantly affect the levels of any of the tested measurements (Table 7). After the adjustments for the identified confounding variables, the difference in the glucose levels according to curry consumption became significant, while the difference in the TG levels between the two curry consumption groups became insignificant in the old-male-overweight individuals (Table 8). Adjusted means of TG levels were significantly lower according to the curry consumption in the young-female-overweight subgroup (Table 8). HDL levels in the old-female-overweight subgroups were significantly lower in the MC compared to the LC after the adjustment (Table 8). The adjusted p-values for the differences in the blood glucose and HbA1c levels according to the curry consumption were 0.0646 and 0.0490, respectively, in young-male-normal individuals, which are lower than they were when they were unadjusted. On the other hand, the difference in the total cholesterol level in the old-female-normal weight subgroup according to the curry consumption became insignificant after the adjustment (Table 8).
DISCUSSION
Curry is the major curcumin-containing food in the Korean diet [1]. Although, only a few individuals were included in the HC, their mean daily turmeric intake was about 0.26 g (Table 3). The demographic characteristics of the study subjects in the higher curry consumption groups resemble the curcumin consumers retrieved by the 24-hour recall data obtained from the KNHANES of years 2008-2012 [1]. The higher curry consumption groups more frequently included younger individuals and non-apartment residents (Table 3), as previously reported [1]. Therefore, information on food consumption surveyed through 24-hour recall and FFQ is comparable when the curry consumption is considered.
Compared to the LC, more individuals in the MC reported being in better health; they had less diagnoses of hypertension, dyslipidemia, and diabetes. The MC group also included more individuals who had healthier behaviors, as more of them used dietary supplements, exercised, and were non-smokers (Table 5). Therefore, healthier individuals might consume curry more often. In contrast, individuals in the MC more frequently consumed instant noodles that are considered an unhealthy food choice (Table 5). This may reflect the more frequent use of convenience foods by individuals in the MC which, correlates with the fact that curry is a convenient food. Alternatively, the health related behaviors observed simply represents the behavior of younger individuals as the mean age of the MC was lower compared to the LC. Since the two groups exhibited different health-related behaviors and diagnostic histories, it was critical to evaluate whether these factors confounded the blood measurements in this study.
All of the blood measurements were confounded by the BMI, which is a known correlate of the blood lipid and glucose levels [1920]. The blood glucose, HbA1C, and cholesterol levels were influenced by age as well (Table 7). The blood TG and HDL levels were also affected by sex (Table 7), as reported previously [2122]. Interestingly, diabetes was a confounding factor for TG, total cholesterol, as well as HDL cholesterol (Table 7). Hyperglycaemia is associated with adverse lipid profiles [23], suggesting that the dysregulation of the glucose levels may affect lipid metabolism. Similarly, hypertriglyceridemia but not hypercholesterolemia influenced the blood glucose levels (Table 7).
Curry consumption may be beneficial in overweight (BMI ≥ 25) individuals who have high levels of blood glucose or TG. The difference in the glucose and TG levels according to the curry consumption became significant in the old-maleoverweight and young-female-overweight subgroups, respectively, after adjusting for the identified confounding variables (Table 8). Blood glucose and TG levels are associated with insulin sensitivity [24]. Therefore, the lower levels of both the blood glucose and the TG in the MC may indicate that individuals with higher consumption of curry may have better insulin sensitivity than individuals in the LC. Unfortunately insulin levels were not assessed in the KNHANES conducted in 2012 and 2013. Unexpectedly, the blood HDL level adjusted for the confounding variable was significantly lower in old-female-overweight individuals in the MC compared to the LC. However, in this subgroup, the difference of the HDL level is less than 3 mg/dL, and the tight standard deviation within this subgroup may contribute to a significant difference.
Previous preclinical studies demonstrated that curcumin exhibits a hypolipidemic effect and enhances insulin sensitivity. Dietary curcumin (less than 0.05%) improves insulin resistance and lowers total cholesterol, free fatty acid, and TG levels in the blood of high-fat fed rodents [25]. Feeding curcumin also reduces the blood glucose levels as well as the lipid levels and enhances insulin sensitivity in diabetic mice [26] and diabetes-induced rats [27]. Therefore, studies indicate that dietary curcumin modulates the lipid and carbohydrate metabolism, subsequently lowering the blood levels of glucose, total cholesterol, and TG. However, this effect only occurs in diabetic mice or high-fat fed animals, where the blood levels of glucose and lipids are elevated. Dietary curcumin does not affect the blood glucose or the glucose-regulating enzyme activities in non-diabetic mice [2627]. In addition, the cholesterol lowering effect is only observed in old rats with high cholesterol levels [5]. This may be why the effect of curry consumption only occurred in overweight individuals, who had higher levels of glucose and TG, in this study. However, the total cholesterol level was not altered by the curry consumption in any subgroups, and moderate curry consumption did not affect the blood glucose and lipid levels in young-male-overweight or old-female overweight individuals, who also had high blood levels of glucose and TG (Table 8). This may be because moderate curry consumption might not be enough to reduce the glucose and lipids in all individuals.
Glycated hemoglobin (HbA1c) is used as a marker that estimates average blood glucose levels over a period of months [28]. Moderate curry consumption decreases glucose, but not HbA1c, in old-male-overweight individuals. The HbA1c levels were in the normal range (4-5.9%) in all subgroups (Table 8), which might cause no significant difference according to the curry consumption. In contrast, moderate curry consumption significantly decreased the HbA1c, but not the glucose levels in young-male-normal individuals. However, in this subgroup, the difference of the HbA1c is only 0.1% and, more than likely, the very tight standard deviation within this subgroup may be attributed to a significant difference.
Sources of turmeric other than curry were not included in the FFQ conducted by KNHANES in 2012 and 2013. However, the primary source of turmeric in the Korean diet is curry, and other sources of turmeric intake are rare [1]. In addition, other types of curry consumption could not be estimated in this study. However, the usage of curry other than "curry rice" was very rare in spite of its use in batter for frying or sauce [1]. Although curry was not classified by turmeric content in the FFQ, this may not cause misclassification of the curry consumption groups since the turmeric content is similar between products made by different manufacturers, and turmeric enhanced products are less common in the market. The accuracy of the self-reported levels of curry consumption could not be determined in this study; however, curry is usually consumed as a main dish, and a recall bias might be insignificant. The MC might include more individuals with higher total energy consumption. However, this likelihood may not be very high, since difference tests were performed within the defined BMI categories and the self-reported portion size for curry was mostly one serving (Table 1).
A major obstacle in this study was that few individuals consumed curry with high frequency. In addition, the effect of curry consumption could not be evaluated in individuals with a prior history of diabetes or dyslipidemia, due to the limited number of individuals with diabetes or dyslipidemia in each age-sex-BMI subgroup. Nevertheless, it is noteworthy that a moderate level of curry consumption (2 to 4 times per month) is related to lower blood levels of glucose and TG in overweight individuals who have high blood lipid and glucose levels, after estimates were adjusted for the confounding factors. Curry is a major curcumin-containing food in most countries other than South Asia, where turmeric consumption is not high. Although it is possible that healthier individuals may consume curry more often, these results are suggestive of the potential health benefits stemming from the consumption of curcumin through an ordinary diet; this should be confirmed in a longitudinal study in the future.


 XML Download