

 PDF
PDF ePub
ePub Citation
 Print
Print


Abstract
Purpose
This study explored influencing factors on quality of life (QoL) above middle-aged women in relation to demographic factors, health-related factors, menopausal status, metabolic syndrome (MS) and its risk factors.
Methods
This study was secondary data analysis from the Sixth Korea National Health and Nutrition Examination Survey 2013~2015 that utilized a complex, multi-stage probability sample design. Study sample of 2,310 was inclusive of (28.8%) of women who were over 40. To evaluate the factors that would influence an impaired quality of life, χ2 test, GLM, and logistic regression analysis were done.
Results
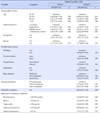
Level of quality of life was lower in women with late post-menopause(over 10 years since menopause) than women with pre-menopause. Factors influencing impaired QoL were as follows: graduated middle school and elementary school or less (OR=2.43, 4.42, respectively, p<.05), no job (OR=1.92, p<.001), stress (OR=1.92, p=.001), depression (OR=1.93, p=.001), insufficient sleep (OR=1.64, p=.003), late post-menopause (OR=2.61, p=.044) and over 85cm of waist circumference (OR=1.76, p=.01).
Conclusion
These results suggest that late post-menopause may be an independent factor influencing an impaired QoL. To promote post-menopausal womens' health, a nursing strategy is required to teach women how to manage levels of stress, depression, insufficient sleep, and abdominal obesity through health education, nutritional counselling, and physical activity program.
Figures and Tables
Table 1
Quality of Life and Related Factors associated with Menopausal Status
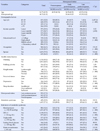
Table 2
Level of Quality of Life by Menopausal Status and Metabolic Syndrome
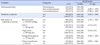
Table 3
Factors influencing on Impaired Quality of Life in Univariate Level
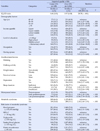
Table 4
Factors influencing on Impaired Quality of Life in Women Over 40 in Multivariate Level
Summary Statement
▪ What is already known about this topic?
Some studies have shown that transitioning through menopause have negatively impacted health-related quality of life, while others reported metabolic syndrome impacting quality of life for menopausal women. Moreover, quality of life is related to biological(age, obesity), psychological(stress, depression), and social(having spouse and jobs) factors.
▪ What this paper adds?
Women with postmenopausal status with metabolic syndrome and its risk factors obtained worse scores in quality of life. With multivariate analysis, being late postmenopause, higher waist circumference, increased stress, depression, and insufficient sleep were significant influencing factors.
▪ Implications for practice, education and/or policy
There is a need to develop nursing strategies to manage levels of stress, depression, insufficient sleep, and abdominal obesity through health education, nutritional counselling, and the need for physical activity programs developed for women who go through menopause.
References
1. Nam HS. South Korean time trade-off values for EQ-5D health states [Internet]. Seoul: Korea Center for Disease Control and Prevention;2007. cited 2016 May 16. Available from:http://www.cdc.go.kr/CDC/info/CdcKrInfo0301.jsp?menuIds=HOME001-MNU1132-MNU1138-MNU0037-MNU1380&cid=12449.
2. Statistics Korea. 2014 Life tables for Korea [Internet]. Daejeon: Statistics Korea;2014. cited 2016 January 8. Available from:http://kosis.kr/nsportalStats/nsportalStats_0102Body.jsp?menuId=6.
3. Ko HY, Lee JK, Shin JY, Jo EI. Health-related quality of life and cardiovascular disease risk in Korean adults. Korean J Fam Med. 2015; 36(6):349–356.

4. Mohamed HA, Lamadah SM, Zamil LG. Quality of life among menopausal women. Int J Reprod Contracept Obstet Gynecol. 2014; 3(3):552–561.
5. Leem GY. The study of menopause-related quality of life and management of climacteric in a middle-aged female population in Korea. Public Health Wkly Rep. 2013; 6(31):609–613.
6. Shyu YK, Pan CH, Lin WM, Hsueh JY, Hsu CS, Tasi PS. Health-related quality of life and healthcare resource utilization in Taiwanese women with menopausal symptoms: A nation-wide survey. J Nurs Res. 2012; 20(3):208–218.
7. Kim HS. The affecting factors of mental health and quality of life for the menopausal women[dissertation]. Gyeongbuk: Daegu Haany University;2015.
8. Park YR, Son YJ. Relationship of satisfaction with appearance, self-esteem, depression, and stress to health related quality of life in women across the lifespan. J Korean Acad Fundam Nurs. 2009; 16(3):353–361.
9. Kim JH, Kim KR, Cho KH, Yoo KB, Kwon JA, Park EC. The association between sleep duration and self-rated health in the Korean general population. J Clin Sleep Med. 2013; 9(10):1057–1064.
10. Han M. Metabolic syndrome emerging from menopause. J Korean Soc Menopause. 2011; 17(3):127–135.
11. Grundy SM, Brewer HB, Cleeman JI, Smith SC, Lenfant C. Definition of Metabolic syndrome: Report of the National Heart, Lung, and Blood Institute/American Heart Association conference on scientific issues related to definition. Arterioscler Thromb Vasc Biol. 2004; 24(2):e13–e18.
12. Bang SY, Cho IG. The effects of menopause on the metabolic syndrome in Korean women. J Korea Acad Ind Coop Soc. 2015; 16(4):2704–2712.
13. Lim S, Shin H, Song JH, Kwak SH, Kang SM, Yoon JW, et al. Increasing prevalence of metabolic syndrome in Korea: The Korean National Health and Nutrition Examination Survey for 1998-2007. Diabetes Care. 2011; 34(6):1323–1328.
14. Ben Ali S, Belfki-Benali H, Aounallah-Skhiri H, Traissac P, Maire B, Delpeuch F, et al. Menopause and metabolic syndrome in Tunisian women. BioMed Research International. 2014; 2014:457131. Article ID 457131.
15. Lee BG, Lee JY, Kim SA, Son DM, Ham OK. Factors associated with self-rated health in metabolic syndrome and relationship between sleep duration and metabolic syndrome risk factors. J Korean Acad Nurs. 2015; 45(3):420–428.
16. Jeon JH, Kim SH. Depression, stress and how they are related with health behaviors and metabolic syndrome among women over 40 years. J Korean Soc Matern Child Health. 2012; 16(2):263–273.
17. Han KS, Park YH, Kim SN, Lee SJ, Yang SH. Influencing factors on quality of life in patients with metabolic syndrome. Korean J Stress Res. 2013; 21(4):303–311.
18. Amiri P, Hosseinpanah F, Rambod M, Montazeri A, Azizi F. Metabolic syndrome predicts poor health-related quality of life in women but not in men: Tehran Lipid and Glucose Study. J Womens Health (Larchmt). 2010; 19(6):1201–1207.
19. Amiri P, Deihim T, Nakhoda K, Hasheminia M, Montazeri A, Azizi F. Metabolic syndrome and health-related quality of life in reproductive age and post-menopausal women: Tehran Lipid and Glucose Study. Arch Iran Med. 2014; 17(6):423–428.
20. So ES. Waist circumference and health-related quality of life by sex in the Korean elderly. J Aging Health. 2014; 26(6):887–899.
21. van Reenen M, Oppe M. EQ-5D-3L user guide: Basic information on how to use the EQ-5D-3L instrument version 5.1 [Internet]. Rotterdam: EuroQol Research Foundation;2015. cited 2016 January 16. Available from:http://www.euroqol.org/fileadmin/user_upload/Documenten/PDF/Folders_Flyers/EQ-5D-3L_UserGuide_2015.pdf.
22. The Korean Society of Menopause. Management of menopausal women. Seoul: Koonja;2007.
23. Jang YH, Kim SH, Kim YS, Jung SH, Park J. The relationship between walking exercise and quality of life for Korean adults. J Digit Converg. 2013; 11(5):325–334.
24. Choi H, Lee HK, Park HM. The Korean menopausal women’s attitudes and awareness on menopause: Results of Korean Gallup epidemiologic survey on menopause and HRT. J Menopausal Med. 2003; 9(1):36–43.
25. Joo JK, Son JB, Jung JE, Kim SC, Lee KS. Differences of prevalence and components of metabolic syndrome according to menopausal status. J Korean Soc Menopause. 2012; 18(3):155–162.
26. Polo-Kantola P. Sleep problems in midlife and beyond. Maturitas. 2011; 68(3):224–232.
27. Hess R, Thurston RC, Hays RD, Chang CC, Dillon SN, Ness RB, et al. The impact of menopause on health-related quality of life: Results from the STRIDE longitudinal study. Qual Life Res. 2012; 21(3):535–544.
28. Bang SY. The effects of metabolic syndrome on quality of life. J Korea Acad Ind Coop Soc. 2015; 16(10):7034–7042.
29. Vetter ML, Wadden TA, Lavenberg J, Moore RH, Volger S, Perez JL, et al. Relation of health-related quality of life to metabolic syndrome, obesity, depression and comorbid illnesses. Int J Obes (Lond). 2011; 35(8):1087–1094.
30. Koh CY, Yang JS, Choi IS. Study on women's quality of life during menopause and suggestions for policy support. Policy Study Report. Suwon: Gyeonggido Family & Women's Research Institute;2011.
 XML Download