

 PDF
PDF ePub
ePub Citation
 Print
Print


INTRODUCTION
Cephalometric radiographs were introduced in the 1940s, and they allowed analysis of malocclusion via measurement of the hard tissues of the craniofacial region.12345 Although cephalometric radiography has numerous advantages, it also has inherent limitations imposed by image enlargement, the two-dimensional (2D) nature of the scans, and the overlapping of structures.678 Most landmarks used in cephalometric analysis, such as A point, B point, pogonion, menton, and gonion, are artificial landmarks that are defined geometrically on the outline of the bone, probably to ease of identification.
With the introduction of three-dimensional (3D) cone-beam computed tomography (CBCT), anatomical structures such as the craniofacial foramen are now being used as landmarks for craniofacial analysis,910111213 with high reliability and accuracy.1112 Cutright et al.13 reported small but significant differences in the position of the infraorbital foramen (IOF) and the mental foramen (MTF) between Caucasian and African-American individuals and males and females. Some authors have used the mandibular foramen (MDF) and the MTF to analyze the mandibular morphology.910
In general, the growth of the brain and nerve tissues accelerates earlier than that of other tissues or organs like the tonsils, adenoids, muscles, skeleton, and genital organs, and bone structures adjacent to nerve tissues adhere to the neural pattern of growth.14 This is the reason why the cranial base is used as a superimposing area for craniofacial analysis. Since the foramen is a biological structure made for a nerve to pass through, it can be inferred that the foramen stabilizes earlier than other areas. In 1969, an implant study by Björk15 showed that the mandibular canal was relatively stable during the growth period, whereas marked bone resorption or apposition were observed on the gonial angle, below the symphysis, and on the condylar process. Recently, Captier et al.9 reported that the length of the mandibular canal (from the MDF to the MTF) was symmetric, while those of the ramus, condylar process, and mandibular notch were asymmetric, suggesting that the neural part of the mandible is more stable than the muscular part, which may show variations to adapt to the masticatory apparatus.
The trigeminal nerve is divided into three branches—the ophthalmic nerve, the maxillary nerve, and the mandibular nerve—and is widely distributed over the maxillomandibular region. As a result, there are many foramina for the trigeminal nerve in the cranial base, the maxilla, and the mandible. A few reports have used these foramina for craniofacial analysis in patients with different skeletal facial types.91013 The aims of this study were to (1) develop parameters based on the craniofacial foramina on CBCT images, (2) determine whether there are any significant differences in these parameters among Class I, Class II, and Class III malocclusion groups, and (3) establish the relationship between these parameters and the conventional cephalometric parameters. The null hypothesis of this study was that the parameters based on the foramina of the trigeminal nerve showed no differences in different facial skeletal types and showed no relationship with conventional cephalometric parameters.
MATERIALS AND METHODS
Samples
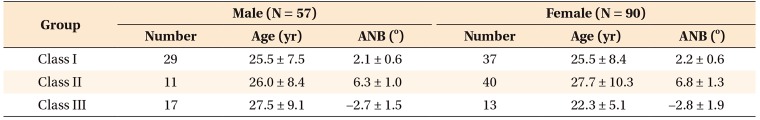
The samples were collected from the archive of patients who visited the Department of Orthodontics, Gangneung-Wonju National University Dental Hospital between December 2014 and January 2017. Inclusion criteria were (1) age over 18 years, (2) no craniofacial anomalies, (3) no facial asymmetry, (4) no history of orthodontic treatment, and (5) availability of cephalometric radiographs and CBCT scans including the cranial base. Patients with an A point-nasion-B point (ANB) angle of 1 to 3° were enrolled in the Class I group, those with an ANB angle of 5° or more were enrolled in the Class II group, and those with an ANB angle of −1° or less were enrolled in the Class III group. A total of 147 patients (57 males and 90 females; mean age, 26.1 years) were included in this study (Table 1). This study was approved by the Institutional Review Board of the Gangneung-Wonju National University Dental Hospital (IRB No. 2016-018).
Cephalometric analysis
Cephalometric radiographs used in this study were obtained using CX-90SP (Asahi Roentgen Ind., Kyoto, Japan) in the patients' habitual occlusion. Six angular and seven linear parameters were measured using Quick Ceph Studio software (Quick Ceph Systems, San Diego, CA, USA). The magnification ratio of the radiographs (110%) was not calibrated in the present study.
Cone-beam computed tomography analysis
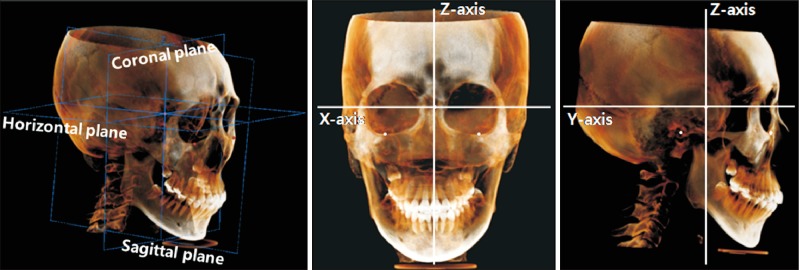
The CBCT scans used in this study were taken using Alphard-3030 (Asahi Roentgen Ind.) with a field of view of 200 × 179 mm and voxel size of 0.39 mm. 3D analysis of CBCT images was performed using OnDemand software (Cybermed, Seoul, Korea). Each CBCT image was oriented with three reference planes and three axes, and the origin (0, 0, 0) was set at the sella (Figure 1). The horizontal plane was parallel to the Frankfort horizontal (FH) plane, which consisted of the right porion and bilateral orbitales. The coronal and sagittal planes were perpendicular to each other and to the horizontal plane.
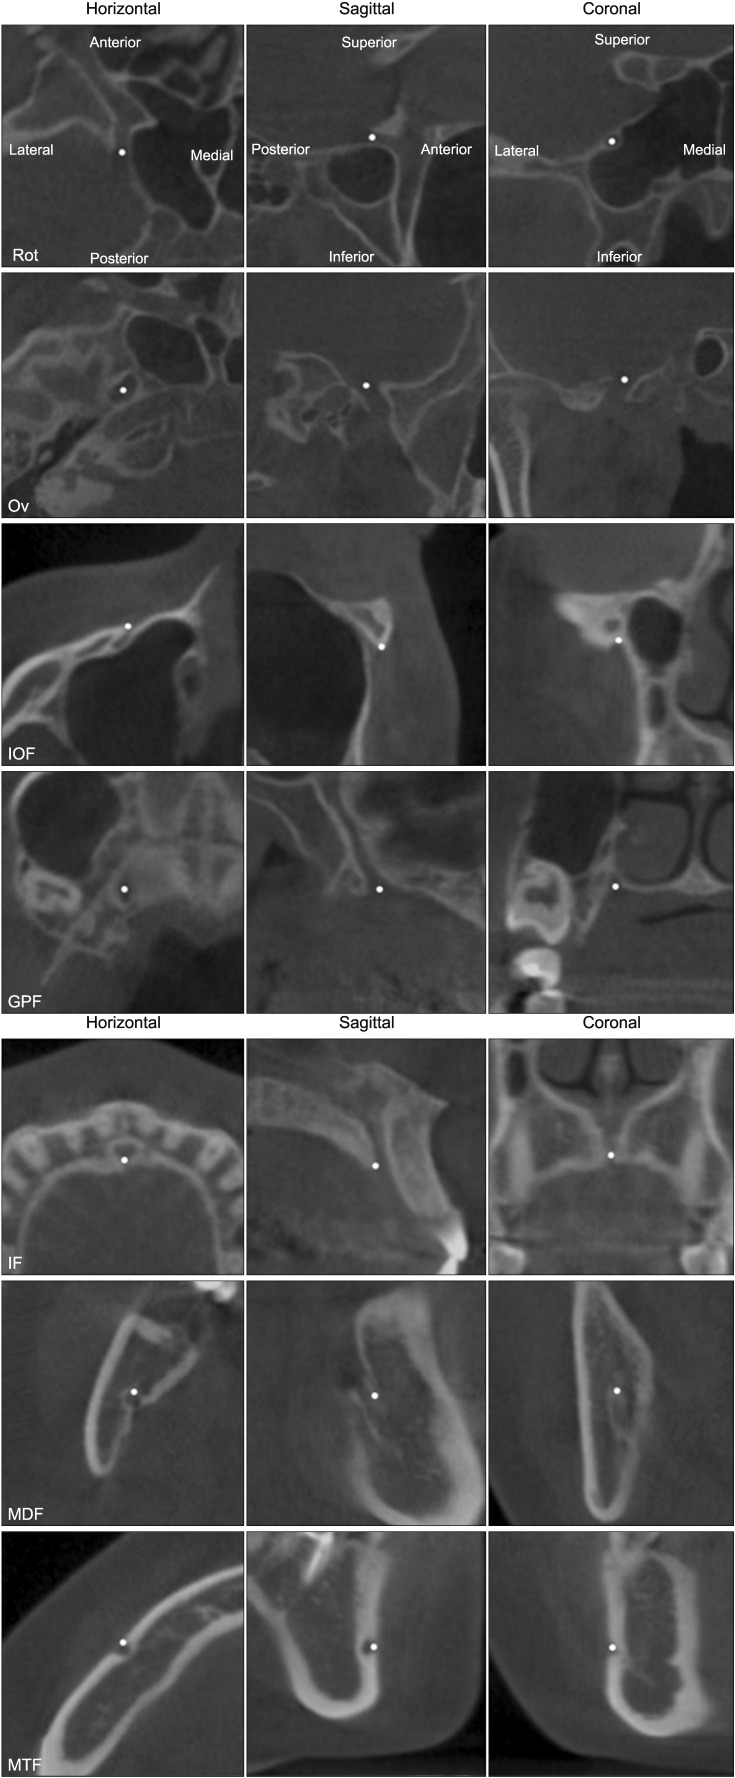
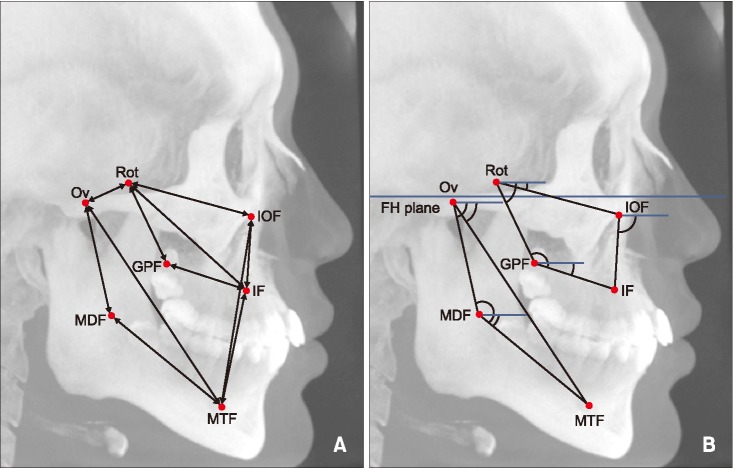
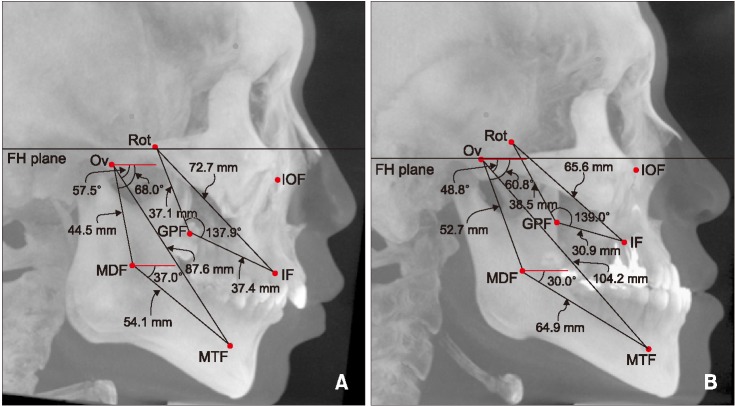
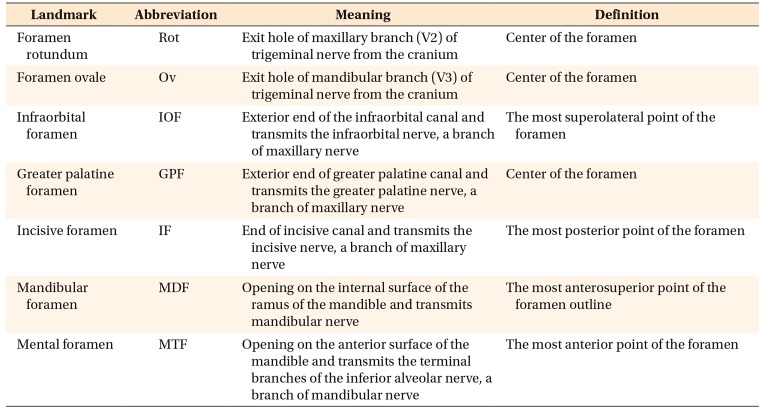
This study analyzed the foramina for the trigeminal nerve, which distributes into the maxilla and the mandible. Briefly, the maxillary nerve leaves the skull through the foramen rotundum (Rot), then distributes to the midface for sensation from the maxilla, nasal cavity, sinuses, and the palate. The infraorbital nerve, a branch of the maxillary nerve, emerges on the face through the IOF, and the greater palatine nerve and the incisive nerve emerge on the hard palate through the greater palatine foramen (GPF) and incisive foramen (IF), respectively. The mandibular nerve exits the cranial cavity through the foramen ovale (Ov), then distributes to the mandible through many branches. The inferior alveolar nerve, a branch of the mandibular nerve, enters the MDF and exits through the MTF.1617 In this study, seven landmarks—Rot, Ov, IOF, GPF, IF, MDF, and MTF—were identified three-dimensionally on CBCT images (Figure 2). The definitions for landmark identification are summarized in Table 2. To determine the method errors in landmark identification, ten CBCT images were randomly selected and the locations were evaluated by one examiner (B.D.L.) with a one-week interval. The method errors calculated by Dahlberg formula18 were less than 0.5 mm. Various linear, angular, and ratio parameters were created using the above anatomical landmarks (Figure 3). The average values were used in the case of bilateral measurements.
Statistical analysis
Since the Shapiro-Wilk test showed that the measurements did not follow a normal distribution (p > 0.05), a nonparametric test was used. The Kruskal-Wallis test was performed to assess for significant differences among the three groups. In addition, differences between two groups were examined using the Mann-Whitney U test. Statistical significance was established at p < 0.05, and Bonferroni correction was used to adjust the significance levels for the differences between two groups (p < 0.016). Some cephalometric parameters and CBCT parameters were selected for Spearman's correlation test, which assessed the relationship between the conventional cephalometric parameters and new CBCT parameters. Statistical analyses were performed using SPSS (ver. 18.0; SPSS Inc., Chicago, IL, USA).
RESULTS
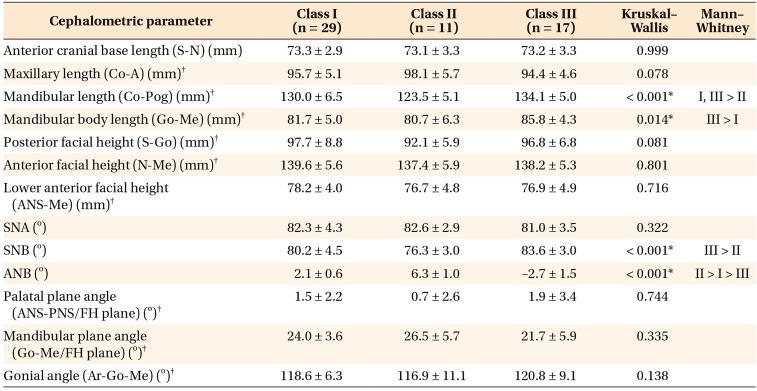
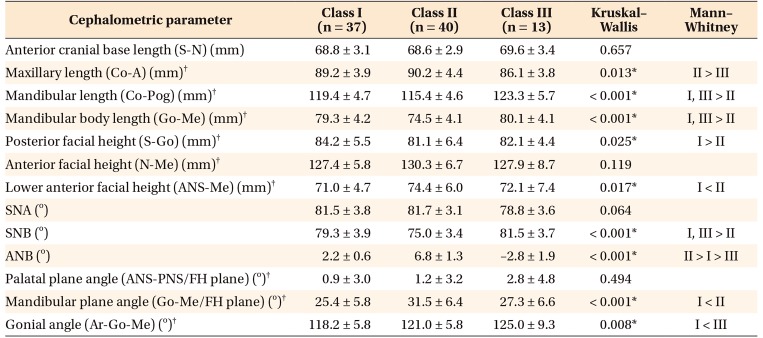
Tables 3 and 4 show comparison of the conventional cephalometric parameters among three groups in each sex. Briefly, the length of the S-N line measured at the cranial base showed no difference among groups, but the length of Co-A in female patients was shorter in Class III than in Class II cases (p = 0.013), while the length of Co-Pog in both genders was longer in Class III than in Class II cases (p < 0.01). There were also differences in vertical relation. Females in the Class II group showed shorter S-Go length and longer ANS-Me length and a larger Go-Me to FH plane angle, in comparison to those in the Class I group (p < 0.05).
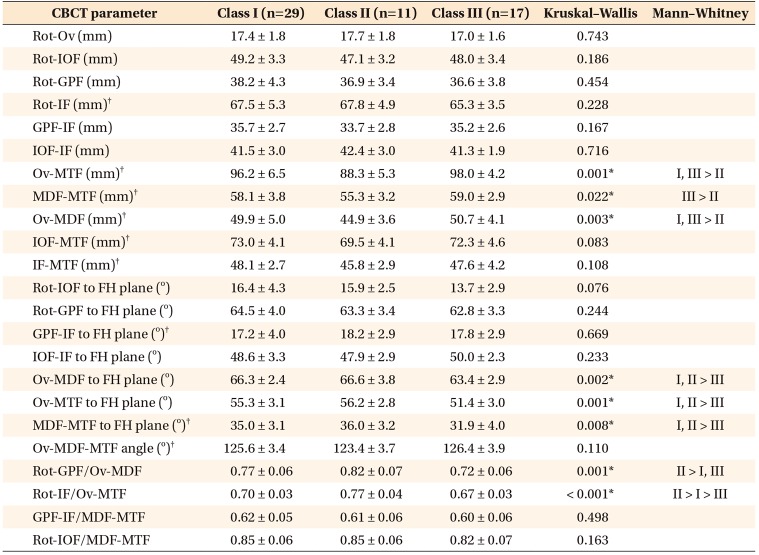
Table 5 shows the results of group differences of the new parameters using the foramina in male. In the linear measurements, Ov-MTF, MDF-MTF, and Ov-MDF were shorter in the Class II (88.3 mm, 55.3 mm, and 44.9 mm, respectively) than in the Class III group (98.0 mm, 59.0 mm, and 50.7 mm, respectively) (p < 0.05). In the angular measurements, Ov-MDF to FH plane angle, Ov-MTF to FH plane angle, and MDF-MTF to FH plane angle were smaller in Class III (63.4°, 51.4°, and 31.9°, respectively) than in Class I (66.3°, 55.3°, and 35.0°, respectively) and Class II (66.6°, 56.2°, and 36.0°, respectively) patients (p < 0.01). The Rot-GPF/Ov-MDF ratio was significantly higher in Class II (0.82) than in Class I (0.77) and Class III (0.72) patients (p < 0.01). The Rot-IF/Ov-MTF ratio was the highest in Class II (0.77) patients, followed by the Class I (0.70) and Class III groups (0.67) (p < 0.001).
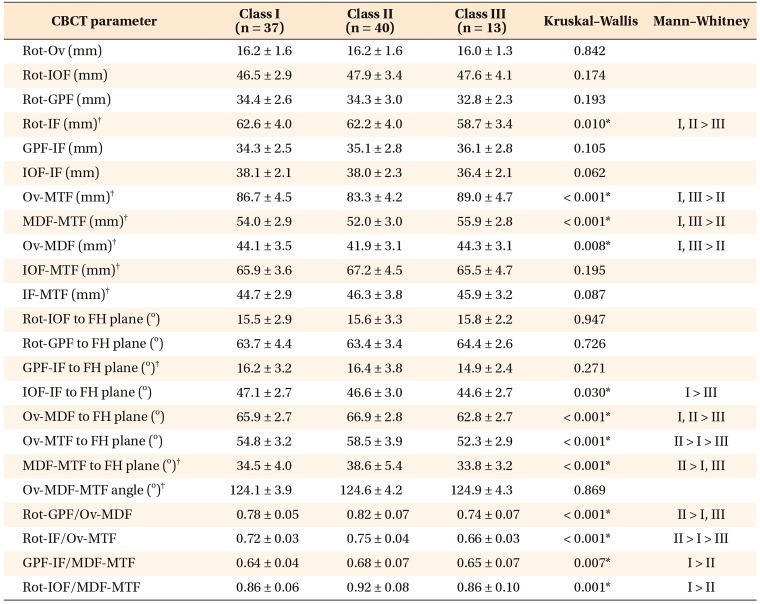
The differences between female groups shown in Table 6 were generally similar to those in the male groups. Ov-MTF, MDF-MTF, and Ov-MDF lengths were shorter in Class II than in the other groups (p < 0.01). Ov-MDF to FH plane angle, Ov-MTF to FH plane angle, and MDF-MTF to FH plane angle were also smaller in Class III than in the other groups (p < 0.01). The Rot-GPF/Ov-MDF ratio and the Rot-IF/Ov-MTF ratio were higher in the Class II group than in the Class III group (p < 0.001). Additionally, some parameters showed significant differences in female groups. The Rot-IF length was shorter in the Class III female group (58.7 mm) than in the Class I (62.6 mm) and Class II (62.2 mm) female groups (p = 0.01). The GPF-IF/MDF-MTF and Rot-IOF/MDF-MTF ratios were significantly larger in Class II (0.68, 0.92, respectively) than in Class I (0.64, 0.86, respectively) (p < 0.01).
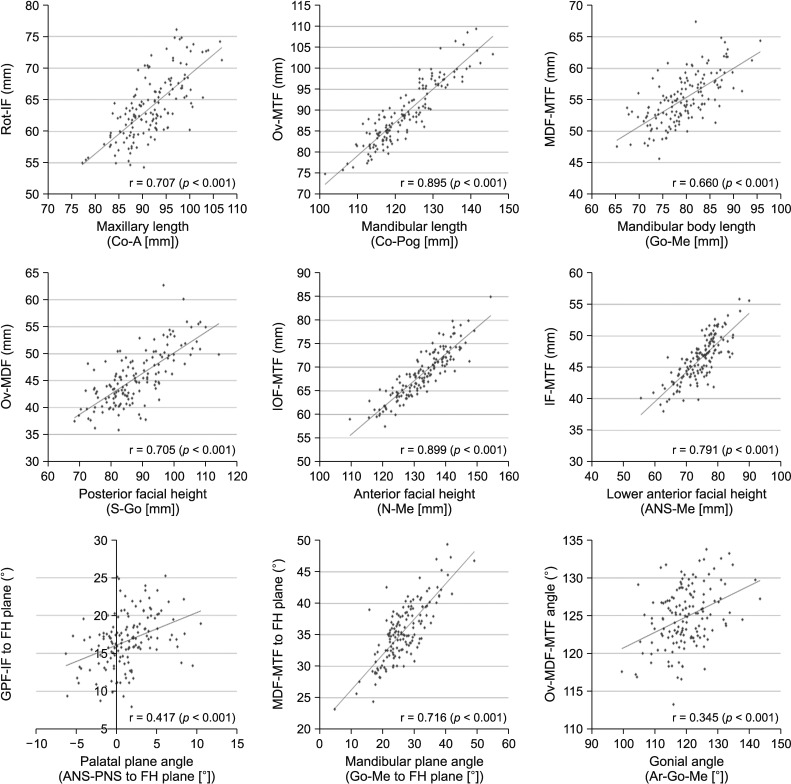
Figure 4 describes the results of Spearman correlation analysis between conventional cephalometric parameters and the new foramina-based CBCT parameters. There were moderate to high correlations between both parameters. Specifically, there was a high correlation between the mandibular length (Co-Pog) and Ov-MTF length (r = 0.895, p < 0.001) and between the anterior facial height (N-Me) and IOF-MTF length (r = 0.899, p < 0.001). Among the angular parameters, the mandibular plane angle (Go-Me to FH plane) showed a high correlation with MDF-MTF to FH plane angle (r = 0.716, p < 0.001); however, there was a relatively low correlation between the palatal plane angle (ANS-PNS to FH plane) and GPF-IF to FH plane angle (r = 0.417, p < 0.001) and between the gonial angle (Ar-Go-Me) and Ov-MDF-MTF angle (r = 0.345, p < 0.001). Description of the variables used in this study are depicted in Table 3.
DISCUSSION
Between the 1970s and 1980s, the trigeminal nerve received great attention from orthodontic researchers in relation to facial growth and development.192021222324 Moss2122 suggested the neurotrophic effect on orofacial growth in which the neural center regulates the growth of the peripheral tissues through non-impulse transmitting neural function. The control exerted by the trigeminal nerve on maxillomandibular growth was hypothesized at that point, however it was not supported by later animal studies that evaluated the growth of craniofacial bone after resection of the trigeminal nerve.192324 The aim of this study is not to rekindle the old controversy regarding the potential regulating activity of the trigeminal nerve in facial growth. However, the cranium and the cranial base grow earlier than other facial structures to adapt to the early growth of the brain.14 Therefore, we inferred that the craniofacial and maxillomandibular foramina through which the nerve passes may also show a neural pattern of growth, i.e., they may grow earlier than other areas of the bone. Therefore, the foramina may be more stable structures for craniofacial analysis, since Björk15 reported that the mandibular canal was relatively stable during the growth period. Furthermore, the foramen is not an artificial but an anatomical structure. Since there was no sufficient information about parameters based on the foramina, the present study tried various parameters to analyze the different skeletal facial types and compared them to the conventional cephalometric parameters as a gold standard.
As shown in Tables 3 and 4, the three groups showed different maxillo-mandibular morphologies, even though the length of the anterior cranial base did not significantly differ between groups. Kasai et al.25 reported no differences in the anterior cranial base lengths between Class I and Class II. As expected, the Class III group in the present study showed a shorter maxillary length, and the Class II group showed a shorter mandibular length. The Class II female group also showed a steeper mandibular plane angle. This downward and backward rotation of the mandible may reinforce the retrognathic mandible.2627 The Class III female group had a larger gonial angle than the other groups in the present study. The larger obtuse gonial angle would lead to a greater effect on the length of the mandibular body and ramus.28 The results confirmed that the overall sample selection was well performed for the different facial skeletal types, especially in female patients.
The distance between Rot and Ov did not differ significantly between groups (Tables 5 and 6), which meant that the Rot and the Ov through which the maxillary nerve and the mandibular nerve exit from the cranium may be located in a similar position regardless of skeletal facial type. However, this result may have been because of the lack of differences in the cranial base length between groups. Thus, the outcomes might be different in patients with severe anomalies of the cranial base.
The maxillary nerve and its branches run through the Rot, IOF, GPF, and IF. Five linear and four angular parameters were defined from these foramina to evaluate significant differences among the Class I, Class II, and Class III malocclusion groups. There were no significant differences in the male patients in the three groups. However, two parameters, Rot-IF length and IOF-IF to FH plane angle, were significantly smaller in female patients in the Class III group than in the Class I and Class II groups (Table 6). The Class III female group in this study showed a slightly small (Co-A length, 86.1 mm) and retruded (SNA, 78.8°) maxilla, and there was high correlation between the Rot-IF length and the effective maxillary length (r = 0.707). Therefore, these findings indicate that the location of the IF is closely related to the size and position of the maxilla. In other words, patients with a retrognathic maxilla probably have further backward IF, and possibly vice versa.
The parameters using the foramina for the mandibular nerve showed more significant differences between groups in both genders. This study's results showed that the lengths of Ov-MTF, MDF-MTF, and Ov-MDF were significantly shorter in the Class II group than in the Class I and Class III groups. Shorter lengths from the Ov to the MTF may be attributable to the small and retrognathic mandible of Class II patients. This relationship was also established in the correlation analysis, which presented a high correlation (r = 0.895) between the Ov-MTF length and the mandibular length (Co-Pog). The planes of Ov-MDF and Ov-MTF showed greater obtuse angles to the FH plane in Class II than in Class III. These findings indicate that the MDF and the MTF are probably located further backward in Class II patients with a retrognathic mandible. The MDF-MTF to FH plane angle was greater in Class II than in the other groups, and because this parameter showed high correlation with the mandibular plane angle (r = 0.716), Class II patients with a high angle (hyperdivergence) may be expected to have a steeper mandibular canal. However, unlike other parameters, the Ov-MDF-MTF angle was not significantly larger in Class III than in the other groups, although the Class III female group showed a larger gonial angle. Correlation analysis also presented a relatively low correlation (r = 0.345) between these two parameters. This mismatch between Ov-MDF-MTF angle and the mandibular shape represented by the gonial angle may be caused by superficial bone remodeling that may occur in the posterior region of the mandibular ramus due to the action of masticatory muscles.
Figure 5 shows representative examples of the skeletal Class II and Class III facial types. Notably, the IF and MTF are located at different positions depending on the skeletal morphology. With the results of this study we anticipate future application of new foramina-based parameters in analysis of skeletal malocclusion and in evaluation of the outcomes of orthopedic or surgical treatment. The present study examined only the parameters constructed by the landmarks itself, but additional 3D parameters constructed by projected points onto the three reference planes may be helpful for 3D analysis. The present study was conducted on adult patients, and studies on growing children may have yielded different results. Future studies will be required to identify longitudinal change patterns in these new parameters during the growth period and to compare them to the conventional cephalometric parameters. To date, cephalometric radiography has provided very useful data to establish treatment plans and evaluate treatment outcomes. Although the foramina-based parameters cannot replace 2D conventional cephalometric analysis in daily practice, these landmarks may be helpful in the research on the craniofacial growth and may be the key to early prediction of skeletal malocclusion. As mentioned by some previous researchers who used the foramina as landmarks for the evaluation of skeletal asymmetry,929 these parameters using the nerve foramina may have the potential to be used for certain analysis, such as maxillary and/or mandibular asymmetry, transverse discrepancy, vertical discrepancy, and sagittal discrepancy as well.
 XML Download