

 PDF
PDF Citation
 Print
Print


INTRODUCTION
Kidney plays key role in filtering the blood by excreting hydrophilic wastes through urine.1 When the function of the kidneys is impaired (estimated glomerular filtration rate [eGFR] < 90 mL/min/1.73 m2), patients are often exposed to drug-induced toxicity, even from drugs without renal metabolism.2 Previous studies suggested that this phenomenon may occur as a result of accumulation of uremic toxins such as indoxyl sulfate and p-cresyl sulfate in the blood due to impaired renal function3 and that such an increase affected the hepatic cytochrome P450 (CYP) 3A activity in stable kidney transplant recipients when measured using 4β-hydroxy (OH)-cholesterol as a metabolic marker.4 As a mechanism, Hanada et al.5 proposed non-competitive inhibition of CYP3A induced by indoxyl sulfate.
CYP is a phase I drug-metabolizing enzyme that is expressed in various human organs, including the liver, small intestine, and kidneys.6 Among CYPs, the CYP3A subfamily is most abundantly expressed in the liver, followed by the small intestine. More than 50% of all prescribed drugs are known to be metabolized by CYP3A.7 CYP3A activity has been reported to be influenced by renal function.8 Previous studies have hypothesized that indoxyl sulfate may interfere with transcriptional activation and down-regulate gene expression through pro-inflammatory cytokines, which could directly inhibit the activity of CYP and drug transporters.59 Additionally, we previously observed a significant difference in hepatic CYP3A activity according to the severity of renal impairment in phase I clinical trials of a CYP3A substrate, evogliptin, where metabolic markers were measured in samples collected before administration of evogliptin.10 Thus, drug-induced toxicity may occur in patients with renal impairment, not only because drug elimination by the kidneys is reduced, but also because plasma indoxyl sulfate could interfere with enzymes involved in hepatic drug metabolism.11
Patients with renal impairment are a vulnerable population, as they are exposed to toxicity from drugs because of reduced renal excretion and other factors such as uremic toxins that can affect hepatic metabolism.12 Thus, an ideal non-invasive marker with high specificity and sensitivity for predicting CYP3A activity is necessary for estimating possible drug toxicity from hepatic metabolism.13 To date, various approaches have been used to predict CYP3A activity, including CYP genotyping, measurement of CYP mRNA expression levels, and measurement of metabolic marker levels.141516 In a previous study, we utilized pharmacometabolomics approaches to validate a gas chromatography-mass spectrometry (GC-MS)-based method for quantifying urinary and plasma metabolic markers of CYP3A activity.17 Based on the validated method, we evaluated the distribution of CYP3A activity in the basal state based on age and sex using metabolic markers, and observed age-related down-regulation of CYP3A activity.18 Also, we have suggested the urinary metabolic ratio of 6β-OH-cortisol/cortisol, 6β-OH-cortisone/cortisone and the plasma concentration of 4β-OH-cholesterol as useful markers for CYP3A activity, which can be appropriately used as an alternative to probing drugs such as midazolam. This method consists of a relatively less invasive sampling strategy, using urine and plasma, and is most suitable for vulnerable subjects such as pregnant women and patients with renal impairment.18 In this study, we aimed to evaluate the impact of renal impairment severity-dependent accumulation of indoxyl sulfate on hepatic CYP3A activity using endogenous markers.
METHODS
Study samples
Patients above 18 years of age, who visited the Department of Nephrology, Seoul National University Hospital (SNUH, Seoul, Korea) and were subjected to a kidney biopsy due to glomerular disease, were included in the study. Samples from patients with a history of daily medication with CYP3A substrates were excluded. The patients were classified into three groups based on eGFR: mild, 60 to 90 mL/min/1.73 m2; moderate, 30 to 60 mL/min/1.73 m2; and severe, < 30 mL/min/1.73 m2. Plasma and urine samples from 66 patients with renal impairment were collected based on the severity of their renal impairment and stored in a freezer below −70°C until the analysis.
Clinical data were collected from electric medical records of SNUH. Demographic information and clinical laboratory test results included data on age, sex, height, weight, blood urea, creatinine, modification of diet in renal disease-estimated glomerular filtration rate (MDRD-eGFR), aspartate aminotransferase (AST), alanine aminotransferase (ALT), and urinalysis. Additional information on chief complaints, kidney biopsy finding, and concomitant diseases were not included.
Chemicals
All steroid reference standards and internal standards for quantifying steroids and indoxyl sulfate were obtained from Steraloids (Newport, RI, USA), Sigma-Aldrich (St. Louis, MO, USA), C/D/N Isotopes (Pointe-Claire, Quebec, ON, Canada), or Santa Cruz Biotechnology (Dallas, TX, USA). The internal standards used for quantifying the four corticosteroids and one cholesterol molecule examined were cortisol-d4 and 4β-OH-cholesterol-d7, respectively. 3-Indoxyl sulfate-d4 potassium salt was used as an internal standard for quantifying indoxyl sulfate. The Oasis HLB cartridge and solvents used for solid-phase extraction were obtained from Waters Corp. (Milford, MA, USA) and J.T. Baker Chemical Co. (Phillipsburg, NJ, USA), respectively. Escherichia coli β-glucuronidase was purchased from Roche Diagnostics (Basel, Switzerland). The trimethylsilylating agents N-methyl-N-(trimethylsilyl) trifluoroacetamide, NH4I, dithioerythritol, and 1 M potassium hydroxide in ethanol (1 N) were purchased from Sigma-Aldrich.
Endogenous steroids quantification
The concentration of five distinct endogenous steroids (four in urine and one in plasma samples) was quantified by gas chromatography and triple quadrupole mass spectrometry. The urine concentration of cortisol, 6β-OH-cortisol, cortisone, and 6β-OH-cortisone19 and the plasma concentration of 4β-OH-cholesterol20 were quantified using previously described protocols, with minor modifications.
For urine analyses, 2 mL of each sample was spiked with 20 μL of the internal standard (final concentration, 100 ng/mL). Subsequently, steroids were isolated and concentrated from the samples by solid-phase extraction using Oasis HLB cartridges. The resultant eluates were evaporated with an N2 evaporator and suspended in 1 mL of 0.2 M sodium phosphate buffer (pH 7.2) and 50 μL of β-glucuronidase. The resuspended samples were then incubated in an oven at 55°C for 1 hour, extracted with 2.5 mL of a 2:3 (v/v) mixture of ethyl acetate:n-hexane, evaporated at 40°C using an N2 evaporator, and dried completely in a vacuum desiccator with P2O5-KOH for at least 1 hour. After drying, 40 μL of N-methyl-N-(trimethylsilyl) trifluoroacetamide (TMS)/NH4I/dithioerythritol (500:4:2, v/w/w) was added to each sample, and the samples were incubated at 60°C for 20 minutes for derivatization. Finally, 3 μL of each derivatized sample was injected into a 7890B series gas chromatograph (Agilent Technologies, Santa Clara, CA, USA) coupled with a 7000B series triple quadrupole mass spectrometer (Agilent Technologies) and analyzed in the selected-ion monitoring mode.
For plasma analysis, 50 μL of each sample was spiked with the internal standard (final concentration, 10 ng/mL), saponified with 500 μL of commercially available ethanolic potassium hydroxide (1 M) for 30 minutes at 37°C, and extracted twice with n-hexane. The extracted samples were evaporated using an N2 evaporator at 37°C and derivatized with 30 μL TMS. Finally, 3 μL of each derivatized sample was analyzed using a GC-TQ-MS device.
All experimental procedures were validated thrice using a quality control system. All four urinary steroids were clearly separated by gas chromatography. Standard curves for the urine and plasma samples were obtained using distilled water and steroid-free plasma generated in-house.
The concentration range for the calibration curves of the five steroids was between 0.5 and 500 ng/mL, with r2 > 0.98. The precision and accuracy of the quality control samples were 3.61%–18.68% and 86.33%–112.4%, respectively, for the urine steroids and 8.49%–13.92% and 96.7%–101.0%, respectively, for the plasma steroids. The total plasma concentration of cholesterol was measured using an enzymatic colorimetric assay (Roche, Mannheim, Germany).
Plasma indoxyl sulfate quantification
The concentration of indoxyl sulfate was quantified by liquid chromatography (Agilent Technologies, 1260 infinite series) coupled with triple quadrupole mass spectrometry (Agilent Technologies, 6260 series). For plasma quantification, protein precipitation was performed using ACN. Later, the supernatant was mixed (1:1, v/v) with 10 mM ammonium acetate buffer.
CYP3A activity assessment
To evaluate CYP3A activity, 6β-OH-cortisol/cortisol and 6β-OH-cortisone/cortisone ratios were calculated. 4β-OH-cholesterol/cholesterol was used as a plasma metabolic marker.
Statistical analysis
Data are presented as the arithmetic mean ± standard deviation (SD). Statistical analyses were performed using GraphPad Prism 4.0 (GraphPad Software, Inc., San Diego, CA, USA). For renal severity, the differences in the levels of metabolomic markers among groups were compared using one-way analysis of variance (ANOVA) and Tukey's multiple comparison test. For continuous variables such as MDRD-eGFR and indoxyl sulfate concentration, correlations between variables and metabolomic marker levels were assessed by Pearson's correlation test. The Shapiro-Wilk normality test was performed for continuous variables. Differences with P < 0.05 were considered statistically significant.
Ethics statement
The biospecimens for this study were provided by the Seoul National University Hospital Human Biobank (Seoul, Korea), a member of the Korea Biobank Network supported by the Ministry of Health and Welfare. All samples from the National Biobank of Korea were obtained with informed consent under Institutional Review Board (IRB)-approved protocols. The protocol was reviewed and approved by the IRB of SNUH (IRB No. 1508-007-691).
RESULTS
Demographics
The mean ± SD for age and BMI was 59.7 ± 13.7 years and 25.1 ± 3.7 kg/m2, respectively. The number of older patients was higher in the moderate group than in the mild and severe groups (P = 0.018). There were significant differences among the three groups in blood urea nitrogen (BUN), creatinine, and MDRD eGFR (P < 0.001), but no significant difference in the levels of AST and ALT (Table 1).
Table 1
Demographic characteristics of the patients with renal impairment classified by renal impairment severity

All parameters are presented as the mean ± standard deviation.
BUN = blood urea nitrogen, MDRD = modification of diet in renal disease, eGFR = estimated glomerular filtration rate, AST = aspartate aminotransferase, ALT = alanine aminotransferase.
aP value using one-way analysis of variance; bPearson's χ2.
Correlation between eGFR and plasma concentration of indoxyl sulfate
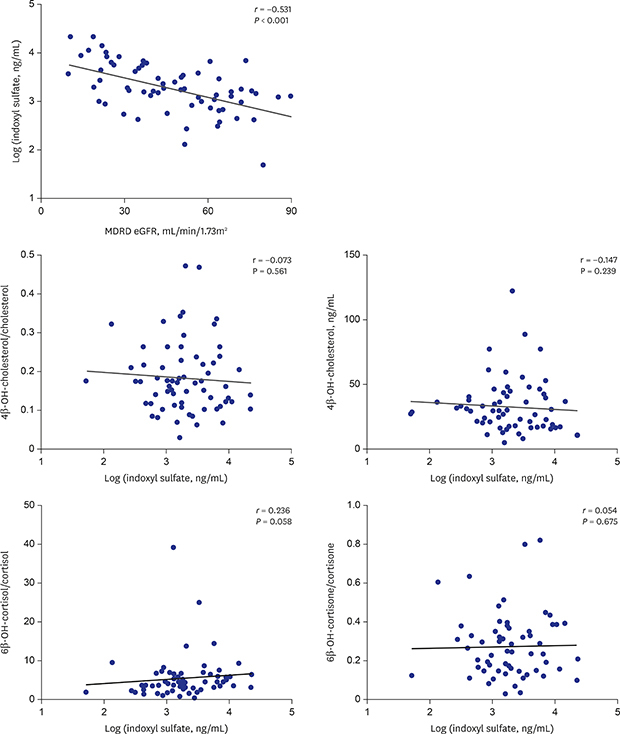
The plasma concentration of indoxyl sulfate increased as the eGFR level decreased. And the correlation was statistically significant (r = −0.531 and P < 0.001; Fig. 1).
Correlation between plasma metabolic markers, eGFR levels, and plasma concentration of indoxyl sulfate
The plasma concentration of 4β-OH-cholesterol and the ratio of 4β-OH-cholesterol/cholesterol were not significantly correlated with the plasma concentration of indoxyl sulfate and eGFR (Fig. 2 and Table 2).
Fig. 2
Correlation of plasma metabolic markers with eGFR level and plasma concentration of indoxyl sulfate. (A, C) eGFR level and (B, D) plasma concentration of indoxyl sulfate.
eGFR = estimated glomerular filtration rate, MDRD = modification of diet in renal disease.
Table 2
Levels of indoxyl sulfate and metabolic markers classified by renal impairment severity

Correlation between urinary metabolic markers, eGFR, and plasma concentration of indoxyl sulfate
DISCUSSION
In this study, we did not observe a correlation of 4β-OH-cholesterol and 4β-OH-cholesterol/cholesterol with eGFR and the plasma concentration of indoxyl sulfate. 4β-OH-cholesterol was reported to be mainly hydroxylated by CYP3A421; it is therefore considered as one of the major endogenous markers for CYP3A activity.22 4β-OH-cholesterol levels are often calculated as 4β-OH-cholesterol/cholesterol when there is a significant difference in the plasma concentration of cholesterol such as in patients with renal impairment.23 A major limitation of using 4β-OH-cholesterol or 4β-OH-cholesterol/cholesterol to measure drug-induced CYP3A inhibition is its relatively long half-life of 17 days.24 However, in this study, the patients were suffering from chronic kidney disease, not acute kidney disease; therefore, this particular limitation may not have any impact on the results.
In a previous study, Furuta et al.25 showed that 6β-hydroxylated steroids were excreted through the urine in an unconjugated form. Additionally, previous studies have shown the renal function-dependent clearance of cortisol, a major marker used in this study.26 Thus, urinary markers mentioned in this study could be affected by the renal function of individuals, even without the effect of uremic toxins. However, we had previously observed a significant difference in CYP3A activity among patients with renal impairment grouped by eGFR when the activity was assessed by 6β-OH-cortisol/cortisol and 6β-OH-cortisone/cortisone.10 Thus, we wanted to validate this result in a relatively larger cohort and in comparison with plasma markers for CYP3A activity. Also, there is no previous study showing differences in clearance among the 4 quantified urinary steroids: 6β-OH-cortisol, cortisol, 6β-OH-cortisone, and cortisone. Thus, we speculated that the use of the urinary metabolic ratio to assess CYP3A activity in patients with renal impairment is appropriate.
There are a few limitations that may have affected the results of this study. First, the samples were collected from patients with renal impairment when they visited the hospital. Thus, the collection time of the samples was not controlled and the metabolic markers may have been affected by diurnal variation. Secondly, the age of the patients were highly varied between 19 and 83 years, and the average age in the moderate group was significantly higher than that in the other two groups. This may affected the results of this study because we previously observed that age is a factor that could significantly affect CYP3A activity.18 Lastly, we did not genotype for CYP3A5*3 polymorphism in this study because our previous study involving healthy male and female volunteers had shown that CYP3A5*3 polymorphism has a negligible influence on both exogenous and endogenous markers of CYP3A activity.27
In conclusion, we evaluated the impact of renal impairment severity-dependent accumulation of indoxyl sulfate on hepatic CYP3A activity using endogenous metabolic markers. We did not observe changes in the plasma concentration of indoxyl sulfate or the renal function-dependent hepatic CYP3A activity when measured using endogenous metabolic markers, even though the plasma concentration of indoxyl sulfate was highly correlated with eGFR. Thus, we speculate that hepatic CYP3A activity may not be affected by renal impairment-induced accumulation of plasma indoxyl sulfate.
 XML Download