

 PDF
PDF ePub
ePub Citation
 Print
Print


INTRODUCTION
Adequate energy intake is essential for athletic performance [1]. In order to maintain energy balance, energy intake must match energy expenditure. Athletes are under higher physiological demands due to their high levels of physical activity, which lead to elevated energy expenditure. Therefore, athletes have higher energy requirements in comparison to the rest of the population [2]. In the case of weight management, athletes cannot overly restrict their energy consumption due to increased risk of losing lean tissue [3]. In female athletes, long-term negative energy balance and inadequate nutrient intake have been associated with various health consequences, including menstrual disorders and bone health problems [45].
Accurate measurement of total energy expenditure (TEE) is important for estimation of energy requirements in relation to negative energy balance, particularly among female athletes given the special concerns explained above. Currently, doubly labeled water (DLW) is considered as the gold-standard method for measurement of TEE [6]. Details of this method, which uses water labeled with stable 2H and 18O isotopes, are given elsewhere [6].
Despite its high accuracy, the DLW method is limited by its high cost. Therefore, other more affordable methods, including predictive equations for estimated energy requirements (EER), are needed. One such equation is the dietary reference intake (DRI) equation for EER, which was published by the Institute of Medicine (IOM) of the National Academies in 2002 [7]. This DRI equation takes into consideration the activity levels of populations and individuals by applying a physical activity coefficient (PA) derived from physical activity level (PAL). The recently published document “Dietary Recommended Intakes for Koreans 2015” proposed that for the Korean female population of 19 years and above (except athletes and other special workers), a PA value of 1.12 should be applied in the equation when calculating EER [8].
Validation studies on the accuracy of the DRI predictive equation for EER have been conducted in different population groups [91011]. However, to our knowledge, few studies have been conducted on female athletes. Therefore, our study attempted to add new knowledge to the field of nutrition, particularly with regard to EER in the population of female athletes. The purpose of this study was to validate the DRI equation for EER in female college tennis athletes and non-athlete students using DLW as a reference method.
MATERIALS AND METHODS
Study participants
Participants were 16 women aged between 19 and 24 years studying at Gangneung-Wonju National University during the period of the study. The first of two groups was composed of eight athletes (tennis players), whereas the remaining eight were non-athletic women. After data collection, one subject was removed from the non-athlete group due to missing data, bringing the number of subjects to seven in this group and the total number to 15 participants. The following criteria were used for exclusion of subjects from the study: (a) having type 1 diabetes, being on insulin treatment, or being under oral hypoglycemic drug treatment; (b) having a disease affecting energy metabolism or under treatment with a drug affecting energy metabolism (including patients with stomach disease, thyroid disease, or kidney disease); (c) consuming more than 40 g of alcohol/day.
Study design
There was a significant difference in measurement period between the two groups. For the athletic group, TEEDLW was measured over a period of 8 days. For the non-athletic group, TEEDLW was measured over the period of 2 weeks. The study protocol was approved by the Gangneung-Wonju National University Institutional Review Board (GWNUIRB-2013-2). Before the investigations, written informed consent was obtained from all participants.
Anthropometric measurements and body composition
Anthropometric measurements and body composition assessment were performed using standard procedures. Weight, height, and body composition were measured using Inbody 720 (Biospace Co., Seoul, Korea). Body mass index (BMI) was calculated as body weight (kg) divided by square of body height (m). All measurements were done with subjects wearing the lightest clothes possible to reduce error.
Resting energy expenditure (REE)
REE measurement was conducted with indirect calorimetry using a ventilated hood system (TrueOne2400, Parvo Medics, USA). Calibration of the system was performed before every measurement, and automatic calibration was set every 5 minutes during the measurement. Measurement was conducted in a thermo-neutral room where the temperature was maintained as constant, with an average of 20.8℃. Before the REE measurement, subjects were instructed to fast for at least 12 hours and abstain from vigorous activities for the 24 hours preceding the measurement. During the REE measurement, subjects laid on a bed with the head covered by a canopy for at least 15 minutes. After measurement of O2 consumption and CO2 production, energy expenditure was calculated using the Weir equation as follows: REE (kcal/day) = 1.44 (3.9 VO2 + 1.1 VCO2) [12], where VO2 is the volume of O2 consumed and VCO2 is the volume of CO2 produced.
Measurement of TEE by DLW method
On the first day of the measurements (day 0), subjects' baseline urine samples were collected for determination of background isotope levels before the dose administration. Collected samples were kept in well-sealed bottles. Each subject was then given a measured oral dose of DLW containing 0.07 g of 2H2O (99.9%, Sigma-Aldrich Co., USA) and 1.1 g of H2 18O (10%, Taiyo Nippon Corporation, Japan) per kg body weight. One hour after the dose administration, subjects voided their bladders, but this urine was not collected. The second and third urine samples were collected 3 and 4 hours, respectively, after the dose ingestion. For the athletic group, subsequent urine collection was carried out on day 1, day 2, day 7, and day 8, whereas for the non-athletic group, subsequent urine samples were collected on day 1, day 2, day 13, and day 14. The difference in observation period between the two groups was based on the fact that water turn-over is more rapid in athlete participants compared to non-athletes [13]. This difference in water turnover rate may lead to error, which can be corrected by reducing the length of the measurement period in high activity subjects [13]. To ensure accuracy of the results, all urine samples were collected at the same time of day. On the day of sample collection, subjects were instructed to void their bladders of urine immediately after waking up (this urine was not collected), followed by collection 1 hour later. Subjects were also instructed to abstain from drinking any liquid at least 30 minutes before the sample collection. For each urine sample, the collection date and time of day were recorded. Samples were stored at -30℃ until the time of analysis in the laboratory. For calculation of TEE, a modified Weir's formula was used [6]: TEE (kcal/day) = 1.1 rCO2 + 3.9 rCO2 / FQ, where rCO2 (mol/day) is the rate of CO2 production and FQ is the food quotient. The principle for calculation of rCO2 with the DLW method is explained in detail elsewhere [613]. To calculate FQ, food consumption data were collected through a 24-hour dietary recall, which was conducted on 2 weekdays and 1 weekend day for every subject.
Predictive equation for EER
In this study, predicted EER were calculated using the DRI predictive equation for EER [7], which has also been used to determine the 2015 DRI for Koreans [8]. This equation considers the age, weight, and height of the subjects. In addition, a PA whose value depends on the activity level of the subjects was applied. Regarding age, this study focused on adults aged 19 years and above. A PA value of 1.45 (very active) was applied to the athlete group while a PA of 1.12 was used for non-athletes (low active). The DRI equation is as follows:
EER for women aged 19 years and older
EER = 354 - (6.91 × age [years]) + PA × (9.36 × weight [kg] + 726 × height [m])
Where PA is the physical activity coefficient:
PA = 1.00 if it is estimated that 1.0 ≤ PAL < 1.4 (sedentary)
PA = 1.12 if it is estimated that 1.4 ≤ PAL < 1.6 (low active)
PA = 1.27 if it is estimated that 1.6 ≤ PAL < 1.9 (active)
PA = 1.45 if it is estimated that 1.9 ≤ PAL < 2.5 (very active)
Statistical analysis
All data are presented as mean ± standard deviation. Statistical analyses were performed using SPSS version 23 (IBM SPSS Statistics 23). To assess the difference between the two groups with regard to different variables, independent t-test was performed while paired t-test was used for comparison between the EERDRI and TEEDLW. Concerning accuracy of the DRI predictive equation by comparison with DLW as the reference method, the mean difference and mean percentage difference between the results of the two methods as well as the root mean squares prediction error (RMSPE) were calculated. The following formula was used to calculate the RMSPE [14]:
Accurate prediction percentage was defined as the percentage of subjects predicted by the DRI predictive equation within 10% of TEEDLW. Under-prediction percentage was defined as the percentage of subjects predicted by the DRI predictive equation < 10% of TEEDLW, whereas over-prediction percentage was defined as the percentage of subjects predicted by the DRI predictive equation > 10% of TEEDLW. Agreement between the two methods was assessed using the Bland-Altman test [15]. In addition, correlation analysis was performed to assess whether or not the two methods have similar tendencies. In all statistical tests, differences were considered as statistically significant if the P value was less than 0.05.
RESULTS
Anthropometry and body composition characteristics of participants
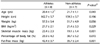
Comparison of anthropometry and body composition characteristics was conducted between the athlete and non-athlete groups, and results are presented in Table 1. Results of the two groups were not significantly different in terms of height (162.7 ± 5.7 cm vs 159.3 ± 3.7 cm, P = 0.196) or BMI (21.7 ± 2.1 vs 21.4 ± 3.3, P = 0.229). On the contrary, skeletal muscle mass was significantly higher in athletes than non-athletes (23.4 ± 2.3 kg and 19.1 ± 1.4 kg respectively, P = 0.001). Average fat-free mass was also higher in athlete subjects compared to non-athletes (42.4 ± 3.7 kg vs 35.7 ± 2.4 kg, P = 0.001).
Resting energy expenditure and variables measured by the DLW method
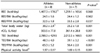
As shown in Table 2, there was no significant difference between athlete and non-athlete groups with regard to resting energy expenditure and energy expenditure adjusted for body weight. On the contrary, REE adjusted for fat-free mass was significantly lower in the athlete group compared to non-athlete subjects (32.5 ± 1.8 kcal/kg/day vs 35.5 ± 2.8 kcal/kg/day, P = 0.037). In comparison to the non-athlete group, athlete participants had significantly higher values for total body water (30.2 ± 2.4 kg vs 25.2 ± 1.8 kg, P = 0.001), rCO2 (503.5 ± 77.8 L/day vs 361.4 ± 28.8 L/day, P = 0.001), total energy expenditure (2,780.3 ± 429.5 kcal/day vs 2,012.3 ± 160.5 kcal/day, P = 0.001), total energy expenditure adjusted for body weight (48.3 ± 4.0 kcal/kg/day vs 39.1 ± 3.2 kcal/kg/day, P < 0.001), total energy expenditure adjusted for fat-free mass (65.3 ± 5.2 kcal/kg/day vs 56.4 ± 2.0 kcal/kg/day, P = 0.001), and physical activity level (1.97 ± 0.17 vs 1.60 ± 0.15, P = 0.001). The range of PAL was from 1.7 to 2.3 in athletes and from 1.4 to 1.8 in non-athlete subjects.
Accuracy of the DRI predictive equation for EER
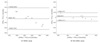
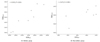
The EERDRI and TEEDLW for both athletes and non-athlete subjects are presented in Table 3. For the athlete group, the mean difference between EERDRI and TEEDLW was -74.3 ± 321.6 kcal/day (P = 0.534), the RMSPE was 31.9 ± 23.5 kcal, and the percentage difference mean was -1.1 ± 11.7%. Concerning the non-athlete group, the mean difference was 28.3 ± 125.2 kcal/day (P = 0.572), the RMSPE was 13.5 ± 11.2 kcal/day, and the percent difference mean was 1.8 ± 6.9% ned. The accurate prediction percentage was only 37.5% in the athlete group and 85.7% in the non-athlete group. With regard to agreement between the two methods, which was assessed by the Bland-Altman method (Fig. 1), the range of limits of agreement was -704.6, 556.0 in the athlete group and -217.1, 273.7 in the non-athlete group. In addition to the RMSPE test, results of correlation analysis between TEEDLW and EERDRI are shown in Fig. 2. There was a very good correlation in the athletes group (r = 0.938, P = 0.001) as well as a good correlation in non-athlete group (r = 0.679, P = 0.094).
DISCUSSION
To our knowledge, the present study is the first to include female tennis athletes and non-athlete college students in the validation of the DRI predictive equation for EER using DLW as a reference method. In the case of female athlete college students, the DRI equation seems to have a clear bias negatively proportional to the subjects' TEE. As observed on the Bland-Altman plot (Fig. 1A), the equation appears to lead to over-prediction in subjects with lower TEE and under-prediction in subjects with higher TEE. In addition, the large limits of agreement (-704.6 kcal, 556.0 kcal) suggests inaccuracy of the DRI predictive equation for female athlete subjects. With regard to the percentage of accurate prediction in this group, the equation was able to accurately predict EER in only 37.5% of subjects (percentage mean difference within the range of ± 10%) [14]. The present results suggest that the DRI predictive equation for EER may not be appropriate for assessing energy expenditure in athletes, especially as it was developed using the general population and not specifically athletes who usually have higher PAL in comparison to other people.
Concerning female non-athlete college students, the percentage of mean difference between EERDRI and TEEDLW was 1.8 ± 6.9%, which suggests accuracy of the DRI predictive equation for EER at the group level, given that the values were inside the accuracy limits of ± 10%. However, at the individual level, the equation seemed to be inaccurate in 14.3% of participants. Regarding the Bland-Altman test in this group, there were relatively narrow limits of agreements between the two methods (217.1 kcal, 273.7 kcal). Further, there was a good correlation between TEEDLW and EERDRI in non-athletes (r = 0.679, P = 0.094). However, the higher P-value (P > 0.05) could have been due to the limitation of having a small sample size.
A similar study on the accuracy of the DRI equation using the DLW method was conducted by Silva et al. [9] on 19 basketball players (aged 16-18 years), including 12 boys and 7 girls. According to the results of their study, there was no significant difference between the TEEDLW and EERDRI. In their study, the two methods were compared using the regression method, and the intercept was not significantly different from 0 (P > 0.05). In addition, the two methods were significantly associated (r = 0.66, P = 0.003). However, considering the activity level of their study subjects (average PAL = 2.9 ± 0.5 for boys and 2.6 ± 0.3 for girls), the application of the DRI predictive equation for EER does not seem appropriate for this group of the population since it only applies to subjects not exceeding a PAL of 2.5 [7]. For the non-athlete group, our findings are similar to those made by Bandini et al. [11] in a study on the accuracy of the DRI predictive equation for EER, which focused on girls aged 8-12 years. In their study, the average percentage error between EERDRI and TEEDLW was -5.8% ± 7.9%, with a percentage of accuracy of 70% at the individual level.
The TEEDLW values for the two groups in this study were significantly higher in athletes than in non-athlete participants (2,780.3 ± 429.5 kcal/day and 2,012.3 ± 160.5 kcal/day respectively, P = 0.001). The TEEDLW values for both groups in this study were comparable to the values reported by Ribeyre et al. [16] in a study on energy expenditure in athletic and non-athletic high school students (age: 16-19 years), which were 11.98 ± 0.40 Mj (2,863.3 ± 95.56 kcal) in female athletes and 10.32 ± 0.45 Mj (2,466.5 ± 107.5 kcal) in female non-athlete subjects. In another study, Petridou et al. [17] compared the TEE values of 28 athletic and non-athletic men, of which half were athletes practicing endurance sports and half did not participate in any training program. The study results showed that TEE was 3,895 ± 600 kcal/day in athletes and 2,722 ± 475 kcal/day in non-athletes (P < 0.05).
In our study, TEEDLW was remarkably lower in athlete subjects compared to the TEEDLW reported in elite female athletes. In a study conducted by Santos et al. [18] on eight female and four male basketball players on Portuguese junior national team players aged 16-17 years, the TEEDLW was 14,208 ± 2,523 kj/day (3,395.8 ± 603 kcal/day), whereas it was 2,780.3 ± 429.5 kcal/day for tennis athletes in our study. This large difference can be explained by the fact that college athletes do not engage in sports activities at the same level as full-time athletes.
The present study included female athletes, who are a group of special concern for energy balance. Studies have shown that this category of the population is at high risk for disorders due to energy imbalance in relation to their high energy expenditure levels [51119]. Therefore, it is important to accurately estimate their energy requirements. Considering the limited availability of data on TEE using the DLW method, and in particular the lack of data on energy expenditure in female tennis athletes, the results of this study will be a valuable reference for future studies.
This study is limited by its small number of subjects (eight athletes and seven non-athletes), which should be taken in consideration while interpreting the results. This problem of limited subjects was due to the high cost of sample analysis, and observed in many other studies using the DLW method. In a study conducted by Rosenkilde et al. [20], in which they compared energy expenditure in older men during prolonged cycling with energy intake to maintain energy balance, six subjects were involved. The sample size was 15 in a study by St-Onge et al. [21], which used the DLW method to assess energy balance during periods of short and habitual sleep in normal-weight men and women. Another study conducted by Zamora-Salas et al. [22] on the validation of total daily energy expenditure calculated with Actiheart using the DLW method in Costa Rican schoolchildren, the number of subjects was 16. In another study by Santos et al. [18], the DLW method was used to assess 7-day TEE in 12 subjects (four male and eight female elite junior basketball players) aged 16-17 years.
In conclusion, it would be difficult to apply the DRI predictive equation for EER in the case of female athlete college students at the group and individual levels considering the observed bias negatively proportional to the subjects' TEE. In addition, wide limits of agreement between the DRI predictive equation and the reference method (DLW) were observed. Regarding female non-athlete college students, the DRI predictive equation could be used to relatively predict EER at the group level. However, at the individual level, this equation could lead to inaccurate prediction of EER, as our study showed that the percentage of mean difference between the DRI method and DLW method results was greater than 10% in 14.3% of subjects. In addition, the current DRI equation would not be applicable in the case of population groups having PAL values higher than 2.5, such as elite athletes. Development of a new equation that is more appropriate for the prediction of energy expenditure in athletes is proposed. In this new equation, a higher PA corresponding to a PAL greater than 2.5 should be determined.

 XML Download