Journal List > J Breast Cancer > v.20(1) > 1036679

Lee, Choi, Chung, Park, Kim, Sung, Han, Lee, Park, Kim, Ahn, Noh, Yoo, Kang, and Choi: Genetic Predisposition of Polymorphisms in HMGB1-Related Genes to Breast Cancer Prognosis in Korean Women

Abstract

Purpose

The high mobility group box 1 (HMGB1) protein has roles in apoptosis and immune responses by acting as a ligand for receptor for advanced glycation end products (RAGE), Toll-like receptors (TLRs), and triggering receptor expressed on myeloid cells 1. In particular, HMGB1/RAGE is involved in tumor metastasis by inducing matrix metalloproteinase 2 (MMP2) and MMP9 expression. We investigated the associations between genetic variations in HMGB1-related genes and disease-free survival (DFS) and overall survival (OS) in Korean female breast cancer patients.

Methods

A total of 2,027 patients in the Seoul Breast Cancer Study were included in the analysis. One hundred sixteen single nucleotide polymorphisms (SNPs) were extracted from eight genes. A multivariate Cox proportional hazards model was used to estimate the hazard ratio and 95% confidence interval (CI) of each SNP. The effects of the SNPs on breast cancer prognosis were assessed at cumulative levels with polygenic risk scores.

Results

The SNPs significantly associated with DFS were rs243867 (hazard ratio, 1.26; 95% CI, 1.05–1.50) and rs243842 (hazard ratio, 1.24; 95% CI, 1.03–1.50); both SNPs were in MMP2. The SNPs significantly associated with OS were rs243842 in MMP2 (hazard ratio, 1.33; 95% CI 1.03–1.71), rs4145277 in HMGB1 (hazard ratio, 1.29; 95% CI, 1.00–1.66), rs7656411 in TLR2 (hazard ratio, 0.76; 95% CI, 0.60–0.98), and rs7045953 in TLR4 (hazard ratio, 0.50; 95% CI, 0.29–0.84). The polygenic risk score results for the DFS and OS patients showed third tertile hazard ratios of 1.72 (95% CI, 1.27–2.34) and 2.75 (95% CI, 1.79–4.23), respectively, over their first tertile references.

Conclusion

The results of the present study indicate that genetic polymorphisms in HMGB1-related genes are related to breast cancer prognosis in Korean women.

INTRODUCTION

Breast cancer has one of the fastest growing incidence rates around the world and a relatively high incidence rate in high-income countries [1]. Worldwide, according to the GLOBOCAN 2012 database, breast cancer accounts for 25.5% of all cancers in women [1]. Following thyroid cancer, breast cancer is the second most frequent among cancer incidences in Korean women [2]. Growth and metastasis of breast cancer are a result of both environmental and genetic factors [3]. In such circumstances, identifying genetic hallmarks related to the growth and metastasis of breast cancer can be seen as an important first step when pursuing potential breast cancer treatment approaches.
The high mobility group box 1 (HMGB1) protein is involved in DNA translation and replication [4]. It also has a role in apoptosis [5] and immune responses [6] because it can act as a ligand for the receptor for advanced glycation end products (RAGE) [7], various Toll-like receptors (TLR2, TLR4, and TLR9) [8], and the triggering receptor expressed on myeloid cells 1 [9]. Two previous meta-analyses focused on RAGE, not HMGB1, and mainly investigated associations with risks for various types of cancers excluding breast cancer [1011]. Recent research on the HMGB1/RAGE pathway done in a Chinese Han population showed a significant association between polymorphisms of the RAGE gene and breast cancer risk; however, there are few studies on the effects of HMGB1 and its related genes on breast cancer prognosis [12]. With the current increase in breast cancer incidence, it is important to study the effects of these genes on breast cancer prognosis in Korean women.
In this study, we hypothesized that polymorphisms of HMGB1-related genes would be significantly associated with breast cancer prognosis. HMGB1 and HMGB1-related genes were investigated, and their significant single nucleotide polymorphisms (SNPs) were extracted. The effects of those SNPs on breast cancer prognosis were assessed at both the individual and cumulative levels.

METHODS

Study population

The Seoul Breast Cancer Study (SEBCS) is a multicenter-based case-control study conducted in Seoul, Korea. Further details have been previously described elsewhere [13]. A total of 4,040 patients with histologically confirmed breast cancer were recruited from the Seoul National University Hospital (SNUH), Asan Medical Center (AMC), and National Cancer Center (NCC) from 2001 to 2007. Participant information was collected through questionnaire-based interviews and medical charts reviews [14]. Each patient was treated with chemotherapy, hormone therapy, and radiotherapy according to their estrogen receptor (ER), progesterone receptor (PR), human epidermal growth factor receptor 2 (HER2) status and TNM stage. Among those subjects, 2,342 breast cancer patients with sufficient DNA samples and successful genotyping were selected. We excluded participants who had a previous history of breast or other cancers before recruitment (n=119), were diagnosed with benign breast diseases (n=41) or had no clinicopathological information (n=26). For the survival analysis, subjects who were lost to follow-up (n=117) were excluded; thus, a total of 2,027 subjects were included in this analysis. All subjects in the SEBCS provided written informed consent to participate, and the study design was approved by the Institutional Review Board of Seoul National University Hospital (IRB number: H-0503-144-004).

Genotyping

Peripheral blood samples from all participants were used for standard genotyping [13]. The HMGB1 gene and five of its binding receptor genes were selected as candidate genes [15]. Additionally, matrix metalloproteinase 2 (MMP2) and MMP9, which are reportedly involved in the HMGB1/RAGE pathway [16], were selected resulting in eight candidate genes included in this study. One hundred sixteen SNPs were extracted from these eight genes with the Affymetrix Genome-Wide Human SNP Array 6.0 chip (Thermo Fisher Scientific Inc., Santa Clara, USA) [13]. The SNP searching range was 20 kb upstream of the first transcriptional position of the candidate gene to 20 kb downstream of the last exon. The exact location of each SNP was determined based on information in the University of California, Santa Cruz's genome browser [17]. If SNPs were correlated in the same candidate gene and had a linkage disequilibrium (LD) (r2>0.3), the SNPs with the lowest p-values were selected among the correlated SNPs.

Statistical methods

Disease-free survival (DFS) is the period from the date of breast cancer surgery until the confirmed date for recurrence, including local and distant metastasis, death, or the last follow-up observation date. Overall survival (OS) is the period from the date of diagnosis of breast cancer until the last follow-up observation date, or the confirmed date of patient death. Detailed follow-up information about was described in a previous study [18]. Among the 2,027 patients enrolled in this study, there were 248 patients with a DFS event and 134 patients with an OS event.
Demographic patient data included age (<40, 40–49, 50–59, and ≥60 years), recruiting site (SNU, AMC, and NCC), education (less than high school, high school, and college or higher), family history of breast cancer (no and yes), body mass index (BMI; <18.5, 18.5–22.9, 23.0–24.9, and ≥25.0), menopausal (premenopausal and postmenopausal), age at menarche (<15 and ≥15 years), age at menopause among postmenopausal women (<49 and ≥49 years), parity (parous and nulliparous), number of children among parous women (1, 2, and ≥3), and duration of breastfeeding among parous women (never, <18 and ≥18 months). Clinicopathological data including TNM stage (0–I, II, and ≥III), ER (positive and negative), PR (positive and negative), HER2 (positive and negative) tumor subtype (hormone receptor [HR]+HER2−, HR+HER2+, HR−HER2+, and HR−HER2−), histological grade (I, II, and III), and treatment information including adjuvant chemotherapy (yes and no), adjuvant hormone therapy (yes and no), and adjuvant radiotherapy (yes and no). The clinicopathological and demographic data of both the DFS and OS groups were assessed with the log-rank test and the multivariate Cox proportional hazards model. Based on the results of the demographic and clinicopathological analyses, the multivariate Cox proportional hazards model was adjusted for age, TNM stage, and tumor subtype that were significantly associated with both DFS and OS. The multivariate model was used to estimate the breast cancer hazard ratio and 95% confidence interval (CI) of each SNP. For both the DFS and OS groups, additive, codominant, and dominant models were used in our comparative analysis.
The effects of the SNPs on breast cancer prognosis were assessed at the cumulative level by assessing polygenic risk scores. To use the polygenic risk score model, the following equation was adapted [19]:
x=i=1mni-eibijbc-20-27-e001.jpg
where m is the total number of SNPs included in the risk score; ni is the number of risk-alleles for the ith SNP; ei is the mean number of risk alleles for the ith SNP among the nonevent group, and bi is the log of the per-allele hazard ratio for the ith SNP. With this model, the risk allele counts of the patients' significant SNPs were tallied. Each count was weighted by multiplying the estimated hazard ratio at each individual level of the SNP [19]. The weighted values were summed to calculate the polygenic risk score for each patient. Both the DFS and OS data were analyzed separately. If any genotyping information was absent among the SNPs analyzed, those patients were excluded from the analysis. Thus, among the 2,027 patients in our study, 2,009 patients were included in the DFS model analysis and 2,004 patients in the OS model analysis. After sorting by polygenic risk score, the patients were categorized into tertiles. By using the multivariate Cox proportional hazards model, the hazard ratio and 95% CI were calculated for the second tertile and third tertile based on the first tertile, which had the lowest polygenic risk score as the reference value. Harrell's C index was calculated to evaluate the predictive accuracy of each model. The basic model consisted of age, TNM stage and tumor subtype, and genetic models were made by adding SNPs with significance, or polygenic risk score made from significant SNPs, to the basic model. The difference between the basic model and genetic model was compared with the Newson method [20]. The PLINK software version 1.07 (http://pngu.mgh.harvard.edu/) was used to analyze individual SNPs, and the SAS software version 9.4 (SAS Institute Inc., Cary, USA) was used to analyze the Kaplan-Meier survival curves and multivariate Cox proportional model in the polygenic risk score models. Stata/MP 12.0 software (StataCorp LP, College Station, USA) was used to calculate Harrell's C index.

RESULTS

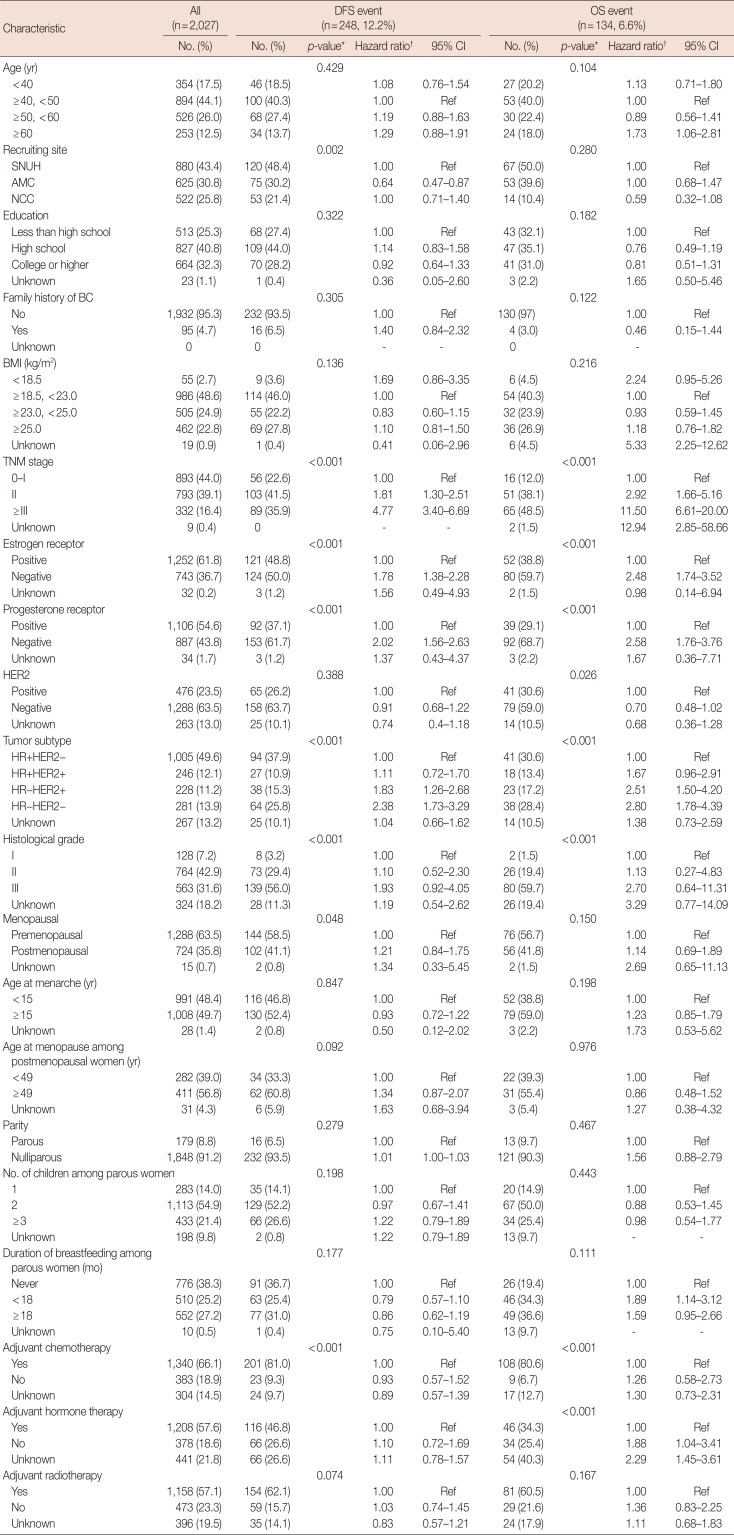
Table 1 summarizes the characteristics of the 2,027 patients in this study, which includes 248 patients with a DFS event and 134 patients with an OS event. The median follow-up duration was 3.8 years (range, 2.9–4.9 years) for the DFS events group and 3.9 years (range, 3.0–4.9 years) for the OS events group. In both event type groups, TNM stage, ER status, and PR status were significantly associated with breast cancer prognosis, while there were no significant differences in age, education level, family history of breast cancer, BMI, HER2 status, menopausal status, age at menarche, age at menopause, parity, number of children, and adjuvant radiotherapy. Recruiting site was only associated with DFS events, and duration of breastfeeding and adjuvant hormone therapy were only associated with OS events. The status of adjuvant chemotherapy, hormone therapy, and radiotherapy were significantly different according to the ER and PR status and the TNM stage (data not shown).
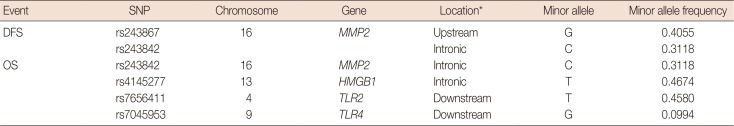
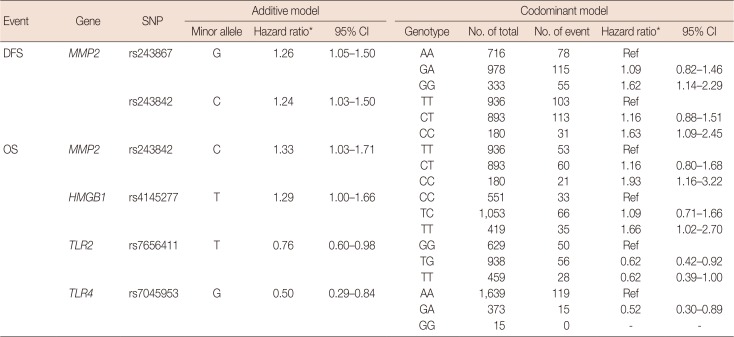
After excluding SNPs with a high LD value (r2>0.3), five SNPs were selected for further assessment (Table 2). Table 3 shows the associations between the genetic variations of the HMGB1-related genes and breast cancer prognosis for both the DFS and OS groups. The most significant SNPs among the DFS patients were rs243867 (hazard ratio, 1.26; 95% CI, 1.05–1.50; p=0.015) and rs243842 (hazard ratio, 1.24; 95% CI, 1.03–1.50; p=0.037), both of which are SNPs of MMP2. Among the OS patient group, rs243842 in MMP2 (hazard ratio, 1.33; 95% CI, 1.03–1.71; p=0.028), rs4145277 in HMGB1 (hazard ratio, 1.29; 95% CI, 1.00–1.66; p=0.048), rs7656411 in TLR2 (hazard ratio, 0.76; 95% CI, 0.60–0.98; p=0.030), and rs7045953 in TLR4 (hazard ratio, 0.50; 95% CI, 0.29–0.84; p=0.009) were found to be the most significant SNPs. Additionally, the association of SNPs with breast cancer prognosis were assessed with a codominant model. Those results showed a similar tendency as that in the additive model.
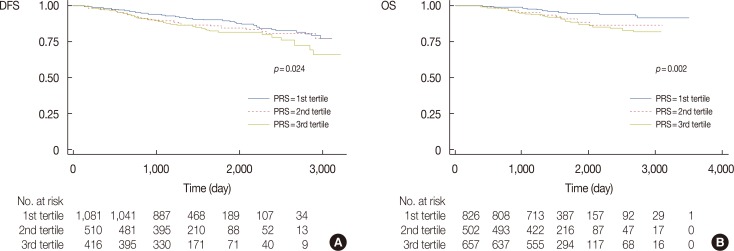
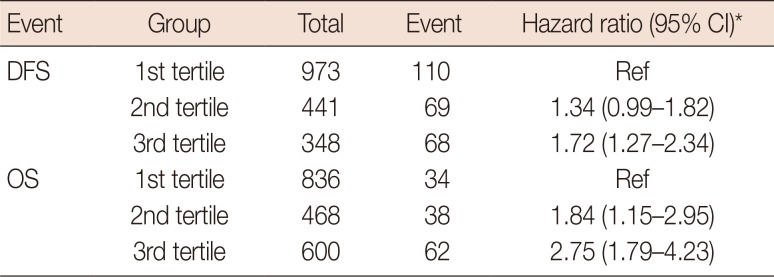
Figure 1 shows the Kaplan-Meier survival curves, and Table 4 presents the estimated hazard ratios by the polygenic risk score tertiles of breast cancer for the DFS and OS event type groups. In the Kaplan-Meier curve, the recurrence and mortality rate were differently distributed according to each tertile group (p=0.024 for DFS and p=0.002 for OS). Analysis of the polygenic risk scores for the DFS event group showed a hazard ratio for the third tertile of 1.72 (95% CI, 1.27–2.34) compared to the reference value of the first tertile. Within the OS event group, the hazard ratio of the third tertile was 2.75 (95% CI, 1.79–4.23) compared to the reference value of the first tertile.
Harrell's C index with age, TNM stage, and tumor subtype was 0.723 for DFS and 0.796 for OS. Harrell's C index increased when adding each significant SNP (highest Harrell's C index 0.731 for DFS and 0.802 for OS) and polygenic risk score (Harrell's C index 0.732 for DFS and 0.810 for OS), although the differences between the basic model and genetic models were not statistically significant (data not shown).

DISCUSSION

The results of this study show that the SNP rs243842 of the MMP2 gene was consistently associated with breast cancer prognosis in patients with DFS or OS events. Among the DFS patients, rs243842 and rs243867 of the MMP2 gene showed statistically significant associations with a poor breast cancer prognosis, while among the OS patients, rs243842 in the MMP2 gene and rs4145277 in the HMGB1 gene were significantly associated with a poor breast cancer prognosis. In contrast, rs7656411 in TLR2 and rs7045953 in TLR4 were significantly associated with a good prognosis in the OS patients. Additionally, the results of our polygenic risk score model analysis for genetic polymorphisms of HMGB1-related genes confirmed that the hazard ratios in the DFS and OS event patients tended to increase as the risk allele count increased.
The HMGB1 protein is a damage-associated molecular pattern molecule that has an essential role in the inflammatory response [21]. Previous research has shown that malignant mesothelioma cells secrete HMGB1 [2223]. Moreover, HMGB1 induces the secretion of tumor necrosis factor α by macrophages and the activation of nuclear factor-κB. These actions accelerate tumor growth by expediting cell proliferation and suppressing cell apoptosis [2224]. In addition to HMGB1, malignant mesothelioma cells also express high levels of TLR2 and TLR4, which suggests that the HMGB1/TLR pathway may influence tumor growth and metastasis [22]. Considering the results of previous studies describing the functions of the HMGB1-related genes and the results of the present study, it can be assumed that there is an association between the increased expression of HMGB1 by rs4145277 and a poorer breast cancer prognosis. Moreover, rs7656411 and rs7045953 may reduce the expression of TLR2 and TLR4, which bind to HMGB1, and are correlated with a good breast cancer prognosis.
Further analysis shows rs243842 SNP in the MMP2 gene was significantly associated with breast cancer prognosis in both the DFS and OS groups while rs243867 was associated with breast cancer prognosis only in the DFS group. Previous research using in vivo and in vitro models showed an increased HMGB1/RAGE level in cancer cells [15]. Additionally, blocking RAGE has been shown to reduce the decomposition of extracellular matrix molecules by suppressing the MMP2 activity [16]. Hence, the HMGB1/RAGE complex promotes growth and metastasis of cancer cells by facilitating cellular invasion. Moreover, human serum MMP2 levels have been associated with breast cancer prognosis [25]. To summarize, these results suggest that rs243842 and rs243867 are involved in the activation of MMP2, thus leading to a poorer breast cancer prognosis.
A limitation of this study is the absence of external validation. Additionally, the use of tagging SNPs that were selected based on the data of a Caucasian population may be a limitation. However, one of the strengths of this study is that it considered and analyzed both HMGB1 and HMGB1-related genes, which have roles in cancer. Furthermore, this study shows the effects of HMGB1 and its related genes in a large sample of female Korean breast cancer patients.
In conclusion, the results of this study and previous studies, show that there are significant associations between the HMGB1, TLR2, TLR4, and MMP2 genes and the prognosis for breast cancer.

Notes

This study was supported by grant 0320150110 (2015-1126) from the Seoul National University Hospital Research Fund.

CONFLICT OF INTEREST: The authors declare that they have no competing interests.

References

1. Torre LA, Bray F, Siegel RL, Ferlay J, Lortet-Tieulent J, Jemal A. Global cancer statistics, 2012. CA Cancer J Clin. 2015; 65:87–108. PMID: 25651787.
crossref
2. Oh CM, Won YJ, Jung KW, Kong HJ, Cho H, Lee JK, et al. Cancer statistics in Korea: incidence, mortality, survival, and prevalence in 2013. Cancer Res Treat. 2016; 48:436–450. PMID: 26987395.
crossref
3. Key TJ, Verkasalo PK, Banks E. Epidemiology of breast cancer. Lancet Oncol. 2001; 2:133–140. PMID: 11902563.
crossref
4. Rajeswari MR, Jain A. High Mobility Group chromosomal proteins, HMGA1 as potential tumor markers. Curr Sci. 2002; 82:838–844.
5. Eisenberg T, Carmona-Gutierrez D, Büttner S, Tavernarakis N, Madeo F. Necrosis in yeast. Apoptosis. 2010; 15:257–268. PMID: 20238475.
crossref
6. van Beijnum JR, Buurman WA, Griffioen AW. Convergence and amplification of Toll-like receptor (TLR) and receptor for advanced glycation end products (RAGE) signaling pathways via high mobility group B1 (HMGB1). Angiogenesis. 2008; 11:91–99. PMID: 18264787.
crossref
7. Scaffidi P, Misteli T, Bianchi ME. Release of chromatin protein HMGB1 by necrotic cells triggers inflammation. Nature. 2002; 418:191–195. PMID: 12110890.
crossref
8. Conti L, Lanzardo S, Arigoni M, Antonazzo R, Radaelli E, Cantarella D, et al. The noninflammatory role of high mobility group box 1/Toll-like receptor 2 axis in the self-renewal of mammary cancer stem cells. FASEB J. 2013; 27:4731–4744. PMID: 23970797.
crossref
9. Wu J, Li J, Salcedo R, Mivechi NF, Trinchieri G, Horuzsko A. The proinflammatory myeloid cell receptor TREM-1 controls Kupffer cell activation and development of hepatocellular carcinoma. Cancer Res. 2012; 72:3977–3986. PMID: 22719066.
crossref
10. Xia W, Xu Y, Mao Q, Dong G, Shi R, Wang J, et al. Association of RAGE polymorphisms and cancer risk: a meta-analysis of 27 studies. Med Oncol. 2015; 32:442. PMID: 25603950.
crossref
11. Zhao DC, Lu HW, Huang ZH. Association between the receptor for advanced glycation end products gene polymorphisms and cancer risk: a systematic review and meta-analysis. J BUON. 2015; 20:614–624. PMID: 26011358.
12. Yue L, Zhang Q, He L, Zhang M, Dong J, Zhao D, et al. Genetic predisposition of six well-defined polymorphisms in HMGB1/RAGE pathway to breast cancer in a large Han Chinese population. J Cell Mol Med. 2016; 20:1966–1973. PMID: 27241711.
13. Kim HC, Lee JY, Sung H, Choi JY, Park SK, Lee KM, et al. A genome-wide association study identifies a breast cancer risk variant in ERBB4 at 2q34: results from the Seoul Breast Cancer Study. Breast Cancer Res. 2012; 14:R56. PMID: 22452962.
crossref
14. Chung S, Park SK, Sung H, Song N, Han W, Noh DY, et al. Association between chronological change of reproductive factors and breast cancer risk defined by hormone receptor status: results from the Seoul Breast Cancer Study. Breast Cancer Res Treat. 2013; 140:557–565. PMID: 23901017.
crossref
15. Wang X, Xiang L, Li H, Chen P, Feng Y, Zhang J, et al. The role of HMGB1 signaling pathway in the development and progression of hepatocellular carcinoma: a review. Int J Mol Sci. 2015; 16:22527–22540. PMID: 26393575.
crossref
16. Taguchi A, Blood DC, del Toro G, Canet A, Lee DC, Qu W, et al. Blockade of RAGE-amphoterin signalling suppresses tumour growth and metastases. Nature. 2000; 405:354–360. PMID: 10830965.
crossref
17. Kent WJ, Sugnet CW, Furey TS, Roskin KM, Pringle TH, Zahler AM, et al. The human genome browser at UCSC. Genome Res. 2002; 12:996–1006. PMID: 12045153.
crossref
18. Song N, Choi JY, Sung H, Jeon S, Chung S, Song M, et al. Tumor subtype-specific associations of hormone-related reproductive factors on breast cancer survival. PLoS One. 2015; 10:e0123994. PMID: 25875532.
crossref
19. Reeves GK, Travis RC, Green J, Bull D, Tipper S, Baker K, et al. Incidence of breast cancer and its subtypes in relation to individual and multiple low-penetrance genetic susceptibility loci. JAMA. 2010; 304:426–434. PMID: 20664043.
crossref
20. Newson R. Parameters behind “nonparametric” statistics: Kendall's tau, Somers' D and median difference. Stata J. 2002; 2:45–64.
21. Klune JR, Dhupar R, Cardinal J, Billiar TR, Tsung A. HMGB1: endogenous danger signaling. Mol Med. 2008; 14:476–484. PMID: 18431461.
crossref
22. Jube S, Rivera Z, Bianchi M, Powers A, Wang E, Pagano I, et al. High mobility group box 1 secretion supports tumor progression of human malignant mesothelioma. Cancer Res. 2012; 72(8 Suppl):Abstract #1557.
23. Yang H, Rivera Z, Jube S, Nasu M, Bertino P, Goparaju C, et al. Programmed necrosis induced by asbestos in human mesothelial cells causes high-mobility group box 1 protein release and resultant inflammation. Proc Natl Acad Sci U S A. 2010; 107:12611–12616. PMID: 20616036.
crossref
24. Yang H, Bocchetta M, Kroczynska B, Elmishad AG, Chen Y, Liu Z, et al. TNF-alpha inhibits asbestos-induced cytotoxicity via a NF-kappaB-dependent pathway, a possible mechanism for asbestos-induced oncogenesis. Proc Natl Acad Sci U S A. 2006; 103:10397–10402. PMID: 16798876.
25. Song N, Sung H, Choi JY, Han S, Jeon S, Song M, et al. Preoperative serum levels of matrix metalloproteinase-2 (MMP-2) and survival of breast cancer among Korean women. Cancer Epidemiol Biomarkers Prev. 2012; 21:1371–1380. PMID: 22634108.
crossref
Figure 1

Kaplan-Meier survival curves of each tertile group based on the polygenic risk scores (PRS) of (A) 2,009 patients with two single nucleotide polymorphisms (SNPs) associated with disease-free survival (DFS) and (B) 2,004 patients with four SNPs associated with overall survival (OS).

jbc-20-27-g001
Table 1

Baseline characteristics and prognosis of breast cancer patients in the Seoul Breast Cancer Study

jbc-20-27-i001
Characteristic All (n=2,027) DFS event (n = 248, 12.2%) OS event (n=134, 6.6%)
No. (%) No. (%) p-value* Hazard ratio 95% CI No. (%) p-value* Hazard ratio 95% CI
Age (yr) 0.429 0.104
 < 40 354 (17.5) 46 (18.5) 1.08 0.76–1.54 27 (20.2) 1.13 0.71–1.80
 ≥ 40, < 50 894 (44.1) 100 (40.3) 1.00 Ref 53 (40.0) 1.00 Ref
 ≥ 50, < 60 526 (26.0) 68 (27.4) 1.19 0.88–1.63 30 (22.4) 0.89 0.56–1.41
 ≥ 60 253 (12.5) 34 (13.7) 1.29 0.88–1.91 24 (18.0) 1.73 1.06–2.81
Recruiting site 0.002 0.280
 SNUH 880 (43.4) 120 (48.4) 1.00 Ref 67 (50.0) 1.00 Ref
 AMC 625 (30.8) 75 (30.2) 0.64 0.47–0.87 53 (39.6) 1.00 0.68–1.47
 NCC 522 (25.8) 53 (21.4) 1.00 0.71–1.40 14 (10.4) 0.59 0.32–1.08
Education 0.322 0.182
 Less than high school 513 (25.3) 68 (27.4) 1.00 Ref 43 (32.1) 1.00 Ref
 High school 827 (40.8) 109 (44.0) 1.14 0.83–1.58 47 (35.1) 0.76 0.49–1.19
 College or higher 664 (32.3) 70 (28.2) 0.92 0.64–1.33 41 (31.0) 0.81 0.51–1.31
 Unknown 23 (1.1) 1 (0.4) 0.36 0.05–2.60 3 (2.2) 1.65 0.50–5.46
Family history of BC 0.305 0.122
 No 1,932 (95.3) 232 (93.5) 1.00 Ref 130 (97) 1.00 Ref
 Yes 95 (4.7) 16 (6.5) 1.40 0.84–2.32 4 (3.0) 0.46 0.15–1.44
 Unknown 0 0 - - 0 -
BMI (kg/m2) 0.136 0.216
 < 18.5 55 (2.7) 9 (3.6) 1.69 0.86–3.35 6 (4.5) 2.24 0.95–5.26
 ≥ 18.5, < 23.0 986 (48.6) 114 (46.0) 1.00 Ref 54 (40.3) 1.00 Ref
 ≥ 23.0, < 25.0 505 (24.9) 55 (22.2) 0.83 0.60–1.15 32 (23.9) 0.93 0.59–1.45
 ≥ 25.0 462 (22.8) 69 (27.8) 1.10 0.81–1.50 36 (26.9) 1.18 0.76–1.82
 Unknown 19 (0.9) 1 (0.4) 0.41 0.06–2.96 6 (4.5) 5.33 2.25–12.62
TNM stage < 0.001 < 0.001
 0–I 893 (44.0) 56 (22.6) 1.00 Ref 16 (12.0) 1.00 Ref
 II 793 (39.1) 103 (41.5) 1.81 1.30–2.51 51 (38.1) 2.92 1.66–5.16
 ≥ III 332 (16.4) 89 (35.9) 4.77 3.40–6.69 65 (48.5) 11.50 6.61–20.00
 Unknown 9 (0.4) 0 - - 2 (1.5) 12.94 2.85–58.66
Estrogen receptor < 0.001 < 0.001
 Positive 1,252 (61.8) 121 (48.8) 1.00 Ref 52 (38.8) 1.00 Ref
 Negative 743 (36.7) 124 (50.0) 1.78 1.38–2.28 80 (59.7) 2.48 1.74–3.52
 Unknown 32 (0.2) 3 (1.2) 1.56 0.49–4.93 2 (1.5) 0.98 0.14–6.94
Progesterone receptor < 0.001 < 0.001
 Positive 1,106 (54.6) 92 (37.1) 1.00 Ref 39 (29.1) 1.00 Ref
 Negative 887 (43.8) 153 (61.7) 2.02 1.56–2.63 92 (68.7) 2.58 1.76–3.76
 Unknown 34 (1.7) 3 (1.2) 1.37 0.43–4.37 3 (2.2) 1.67 0.36–7.71
HER2 0.388 0.026
 Positive 476 (23.5) 65 (26.2) 1.00 Ref 41 (30.6) 1.00 Ref
 Negative 1,288 (63.5) 158 (63.7) 0.91 0.68–1.22 79 (59.0) 0.70 0.48–1.02
 Unknown 263 (13.0) 25 (10.1) 0.74 0.4–1.18 14 (10.5) 0.68 0.36–1.28
Tumor subtype < 0.001 < 0.001
 HR+HER2− 1,005 (49.6) 94 (37.9) 1.00 Ref 41 (30.6) 1.00 Ref
 HR+HER2+ 246 (12.1) 27 (10.9) 1.11 0.72–1.70 18 (13.4) 1.67 0.96–2.91
 HR−HER2+ 228 (11.2) 38 (15.3) 1.83 1.26–2.68 23 (17.2) 2.51 1.50–4.20
 HR−HER2− 281 (13.9) 64 (25.8) 2.38 1.73–3.29 38 (28.4) 2.80 1.78–4.39
 Unknown 267 (13.2) 25 (10.1) 1.04 0.66–1.62 14 (10.5) 1.38 0.73–2.59
Histological grade < 0.001 < 0.001
 I 128 (7.2) 8 (3.2) 1.00 Ref 2 (1.5) 1.00 Ref
 II 764 (42.9) 73 (29.4) 1.10 0.52–2.30 26 (19.4) 1.13 0.27–4.83
 III 563 (31.6) 139 (56.0) 1.93 0.92–4.05 80 (59.7) 2.70 0.64–11.31
 Unknown 324 (18.2) 28 (11.3) 1.19 0.54–2.62 26 (19.4) 3.29 0.77–14.09
Menopausal 0.048 0.150
 Premenopausal 1,288 (63.5) 144 (58.5) 1.00 Ref 76 (56.7) 1.00 Ref
 Postmenopausal 724 (35.8) 102 (41.1) 1.21 0.84–1.75 56 (41.8) 1.14 0.69–1.89
 Unknown 15 (0.7) 2 (0.8) 1.34 0.33–5.45 2 (1.5) 2.69 0.65–11.13
Age at menarche (yr) 0.847 0.198
 < 15 991 (48.4) 116 (46.8) 1.00 Ref 52 (38.8) 1.00 Ref
 ≥ 15 1,008 (49.7) 130 (52.4) 0.93 0.72–1.22 79 (59.0) 1.23 0.85–1.79
 Unknown 28 (1.4) 2 (0.8) 0.50 0.12–2.02 3 (2.2) 1.73 0.53–5.62
Age at menopause among postmenopausal women (yr) 0.092 0.976
 < 49 282 (39.0) 34 (33.3) 1.00 Ref 22 (39.3) 1.00 Ref
 ≥ 49 411 (56.8) 62 (60.8) 1.34 0.87–2.07 31 (55.4) 0.86 0.48–1.52
 Unknown 31 (4.3) 6 (5.9) 1.63 0.68–3.94 3 (5.4) 1.27 0.38–4.32
Parity 0.279 0.467
 Parous 179 (8.8) 16 (6.5) 1.00 Ref 13 (9.7) 1.00 Ref
 Nulliparous 1,848 (91.2) 232 (93.5) 1.01 1.00–1.03 121 (90.3) 1.56 0.88–2.79
No. of children among parous women 0.198 0.443
 1 283 (14.0) 35 (14.1) 1.00 Ref 20 (14.9) 1.00 Ref
 2 1,113 (54.9) 129 (52.2) 0.97 0.67–1.41 67 (50.0) 0.88 0.53–1.45
 ≥3 433 (21.4) 66 (26.6) 1.22 0.79–1.89 34 (25.4) 0.98 0.54–1.77
 Unknown 198 (9.8) 2 (0.8) 1.22 0.79–1.89 13 (9.7) - -
Duration of breastfeeding among parous women (mo) 0.177 0.111
 Never 776 (38.3) 91 (36.7) 1.00 Ref 26 (19.4) 1.00 Ref
 < 18 510 (25.2) 63 (25.4) 0.79 0.57–1.10 46 (34.3) 1.89 1.14–3.12
 ≥ 18 552 (27.2) 77 (31.0) 0.86 0.62–1.19 49 (36.6) 1.59 0.95–2.66
 Unknown 10 (0.5) 1 (0.4) 0.75 0.10–5.40 13 (9.7) - -
Adjuvant chemotherapy < 0.001 < 0.001
 Yes 1,340 (66.1) 201 (81.0) 1.00 Ref 108 (80.6) 1.00 Ref
 No 383 (18.9) 23 (9.3) 0.93 0.57–1.52 9 (6.7) 1.26 0.58–2.73
 Unknown 304 (14.5) 24 (9.7) 0.89 0.57–1.39 17 (12.7) 1.30 0.73–2.31
Adjuvant hormone therapy < 0.001
 Yes 1,208 (57.6) 116 (46.8) 1.00 Ref 46 (34.3) 1.00 Ref
 No 378 (18.6) 66 (26.6) 1.10 0.72–1.69 34 (25.4) 1.88 1.04–3.41
 Unknown 441 (21.8) 66 (26.6) 1.11 0.78–1.57 54 (40.3) 2.29 1.45–3.61
Adjuvant radiotherapy 0.074 0.167
 Yes 1,158 (57.1) 154 (62.1) 1.00 Ref 81 (60.5) 1.00 Ref
 No 473 (23.3) 59 (15.7) 1.03 0.74–1.45 29 (21.6) 1.36 0.83–2.25
 Unknown 396 (19.5) 35 (14.1) 0.83 0.57–1.21 24 (17.9) 1.11 0.68–1.83

DFS=disease-free survival; OS=overall survival; CI=confidence interval; SNUH=Seoul National University Hospital; AMC=Asan Medical Center; NCC=National Cancer Center; BC=breast cancer; BMI=body mass index; HER2=human epidermal growth factor receptor 2; HR=hormone receptor.

*p-value for log-rank test; Adjusted for age, TNM stage, and tumor subtype.

Table 2

Extracted single nucleotide polymorphisms in the HMGB1-related genes

jbc-20-27-i002
Event SNP Chromosome Gene Location* Minor allele Minor allele frequency
DFS rs243867 16 MMP2 Upstream G 0.4055
rs243842 Intronic C 0.3118
OS rs243842 16 MMP2 Intronic C 0.3118
rs4145277 13 HMGB1 Intronic T 0.4674
rs7656411 4 TLR2 Downstream T 0.4580
rs7045953 9 TLR4 Downstream G 0.0994

HMGB1=high mobility group box 1; SNP=single nucleotide polymorphism; DFS=disease-free survival; MMP2=matrix metalloproteinase 2; OS=overall survival; TLR2=Toll-like receptor 2.

*Location information from University of California, Santa Cruz's database.

Table 3

Association between the genetic polymorphisms of HMGB1-related genes and breast cancer prognosis

jbc-20-27-i003
Event Gene SNP Additive model Codominant model
Minor allele Hazard ratio* 95% CI Genotype No. of total No. of event Hazard ratio* 95% CI
DFS MMP2 rs243867 G 1.26 1.05–1.50 AA 0716 78 Ref
GA 978 115 1.09 0.82–1.46
GG 333 55 1.62 1.14–2.29
rs243842 C 1.24 1.03–1.50 TT 936 103 Ref
CT 893 113 1.16 0.88–1.51
CC 180 31 1.63 1.09–2.45
OS MMP2 rs243842 C 1.33 1.03–1.71 TT 936 53 Ref
CT 893 60 1.16 0.80–1.68
CC 180 21 1.93 1.16–3.22
HMGB1 rs4145277 T 1.29 1.00–1.66 CC 551 33 Ref
TC 1,053 66 1.09 0.71–1.66
TT 419 35 1.66 1.02–2.70
TLR2 rs7656411 T 0.76 0.60–0.98 GG 629 50 Ref
TG 938 56 0.62 0.42–0.92
TT 459 28 0.62 0.39–1.00
TLR4 rs7045953 G 0.50 0.29–0.84 AA 1,639 119 Ref
GA 373 15 0.52 0.30–0.89
GG 15 0 - -

HMGB1=high mobility group box 1; SNP=single nucleotide polymorphism; CI=confidence interval; DFS=disease-free survival; MMP2=matrix metalloproteinase 2; OS=overall survival; TLR2=Toll-like receptor 2.

*Multivariate Cox proportional hazard model adjusted for age, TNM stage, and tumor subtype.

Table 4

Association between polygenetic score and breast cancer prognosis

jbc-20-27-i004
Event Group Total Event Hazard ratio (95% CI)*
DFS 1st tertile 973 110 Ref
2nd tertile 441 69 1.34 (0.99–1.82)
3rd tertile 348 68 1.72 (1.27–2.34)
OS 1st tertile 836 34 Ref
2nd tertile 468 38 1.84 (1.15–2.95)
3rd tertile 600 62 2.75 (1.79–4.23)

CI=confidence interval; DFS=disease-free survival; OS=overall survival.

*Multivariate Cox proportional hazard model adjusted for age, TNM stage, and tumor subtype.

TOOLS
Similar articles