

 PDF
PDF ePub
ePub Citation
 Print
Print


INTRODUCTION
The structure of nigrosome-1 as revealed using magnetic resonance imaging (MRI) has recently emerged as a new imaging biomarker for idiopathic Parkinson's disease (IPD).123456 Although susceptibility-weighted imaging (SWI) at 3 T can improve the detection of iron deposition in nigrosome-1 and can be used for simple visual inspections, the subjectivity of its assessments may reduce its utility due to interobserver discrepancies when determining the presence or absence of abnormality in the small subregion of the substantia nigra pars compacta (SNpc). Moreover, the different imaging sequences and diverse imaging planes used in previous studies may make it difficult to incorporate nigrosome-1 imaging into the routine imaging protocol for evaluations of parkinsonism.
To address the issues of subjective visual assessments and the use of different imaging sequences, quantitative susceptibility mapping (QSM) is potentially a good solution because it provides an objective measure of a quantitative magnetic susceptibility value, which can be obtained by using either a single or multiecho gradient-recalled echo sequence independent of proprietary sequences.78 Several studies have shown the advantages of this technique over SWI and R2* mapping,9 as well as its usefulness in IPD.10111213141516 Studies of the diagnostic capabilities of QSM have compared the mean susceptibility values in the presumed region of the substantia nigra (SN) or SNpc in order to distinguish patients with IPD and the healthy subjects, with the results supporting the usefulness of QSM in the diagnosis of IPD.11131415
However, despite successfully deploying QSM, these studies found that its diagnostic accuracy was comparable to that of conventional nigrosome-1 imaging using T2*-weighted imaging or SWI, showing an overlap of the mean susceptibility values between the two groups. One of the potential limitations of these studies is that the voxels were larger [(0.9×0.9×2.0 mm3)131415 and (0.4×0.7×1.5 mm3)11] than those for nigrosome-1 imaging (0.4–0.55×0.4–0.55×0.7–1.5 mm3).245 In addition, the imaging orientation may have obscured the results because all but one study (that by Murakami et al.11) obtained images axially with thick slices (1.5 mm to 2 mm), which is suboptimal for delineating the nigrosome-1 region considering its size and shape (Supplementary Fig. 1 in the online-only Data Supplement). More importantly, the previous studies drew regions of interest (ROIs) along the margin of the high-susceptibility regions in QSM, which may have excluded the lower susceptibility region of nigrosome-1. This could have resulted in the normal nigrosome-1 region not being included in the ROI analysis (particularly for healthy subjects), thereby affecting the diagnostic accuracy.
In addressing these challenges, it might be possible to improve the diagnostic performance by performing QSM with a high spatial resolution in the imaging plane perpendicular to the principal axis of the nigrosome-1 structure (Supplementary Fig. 1 in the online-only Data Supplement). Moreover, a histogram analysis of the SN that includes the normal nigrosome-1 region in all subjects may help to improve diagnostic accuracy. This study explored the diagnostic utility of high-resolution QSM images combined with histogram analysis for detecting early-stage IPD patients and healthy subjects.
METHODS
This retrospective study was approved by the Institutional Review Board (GDIRB2016-18).
Participants
All of the patients and healthy subjects gave written informed consent. We enrolled 38 patients with IPD from our movement disorder clinic from December 2014 to May 2016 (aged 68.3±9.2 years, mean±standard deviation; 21 males and 17 females). The clinical diagnosis was based on the UK Parkinson's Disease Society Brain Bank Clinical Diagnostic Criteria.17 All patients underwent N-3-fluoropropyl-2-β-carbomethoxy-3-β-(4-iodophenyl)nortropane positron-emission tomography (Biograph-6, Siemens, Elrlangen, Germany) for the initial diagnosis in order to rule out secondary parkinsonism. The Hoehn and Yahr stage18 and the score on the Unified Parkinson Disease Rating Scale, Part III (UPDRS III) were determined by an experienced neurologist in order to evaluate the severity of motor symptoms. All patients were de novo IPD without medication when they were assessed based on both neurological examinations and imaging studies.
The following exclusion criteria for the patients were applied: 1) symptoms or signs suggestive of atypical parkinsonism (e.g., cerebellar abnormality, severe orthostatic hypotension, vertical supranuclear gaze palsy, or ideomotor apraxia); 2) dementia; 3) neurological disorders other than IPD; 4) other potential causes of parkinsonism such as metabolic derangement or structural brain lesions; 5) infarction, hemorrhage, tumors, trauma, or severe white-matter hyperintensity (deep white-matter lesions larger than 25 mm, or caps or bands larger than 10 mm); 6) a history of taking drugs that are known to cause parkinsonism; or 7) contraindications to MRI.
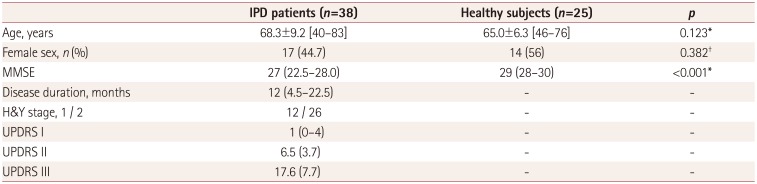
Twenty-five healthy subjects were recruited (aged 65.0±6.3 years; 11 males and 14 females) from among the spouses of the patients and the family members of the hospital employees. The inclusion criteria for the healthy subjects were 1) older than 40 years, 2) no history of neurological or psychiatric diseases, 3) no family history of movement disorders, and 4) normal cognition without subjective memory impairment, as indicated by a score in the Mini Mental State Examination (MMSE) of >26. The demographic and clinical characteristics of the participants are summarized in Table 1.
MRI image acquisition
All participants underwent MRI in a 3-T scanner with a 32-channel coil (MAGNETOM Skyra, Siemens Healthcare, Forchheim, Germany). Whole-brain sagittal three-dimensional (3D) magnetization-prepared rapid gradient-echo (MP-RAGE) imaging was initially performed with the following parameters: repetition time (TR)=1,800 ms, echo time (TE)=3 ms, inversion time (TI)=920 ms, matrix=256×256 pixels, field of view (FOV)=250×250 pixels (1-mm isovoxels), acceleration factor=2, and acquisition time=3 minutes and 36 seconds. Oblique coronal 3D multiecho data image combination (MEDIC), which generates a combined image of multiecho gradient-recalled echo images, was performed parallel to the plane from the posterior commissure and the top of the pons, as located using sagittal MP-RAGE imaging.6 The scanning parameters for MEDIC were as follows: TR=88 ms, minimum TE=11.1 ms, maximum TE=66.9 ms, six echoes, echo spacing=11.1 ms, flip angle=10°, echo train length=6, thickness=1 mm, number of sections=28, matrix=384×384 pixels, FOV=192×192 (spatial resolution=0.5×0.5×1 mm3), acceleration factor=2, and acquisition time=7 minutes and 19 seconds.
Quantification of susceptibility in the SN of IPD patients and healthy subjects
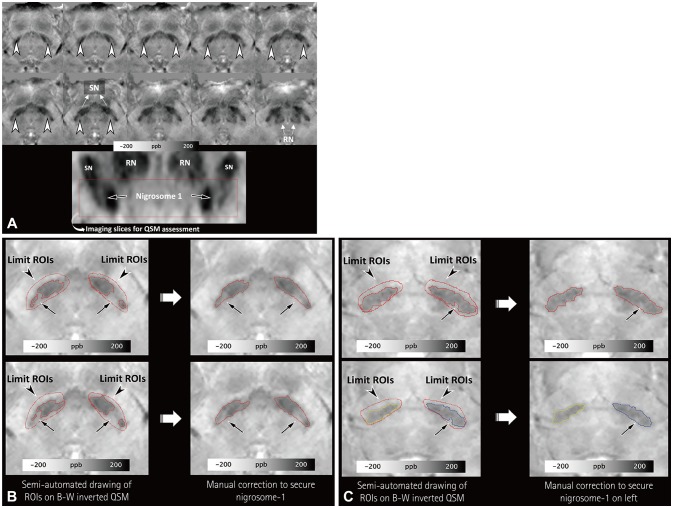
After performing the reconstruction and normalization of QSM (Supplementary Fig. 2 and a document in the onlineonly Data Supplement), the normalized QSM images were transferred to Analyze® (version 12.0, AnalyzeDirect, Overland Park, KS, USA) for the semiautomated drawing of the ROIs. Since the main part of nigrosome-1 is present below the level of the red nucleus, and nigrosome-1 and nigrosome-4 are in close proximity above the level of the red nucleus,1920 a neuroradiologist drew the ROIs from the level of the lower border of the red nucleus to the lowermost region of the SN with higher susceptibility values compared to the adjacent regions (Fig. 1A). Another investigator (an MRI physicist with 2 years of experience performing research into parkinsonism) independently made the same measurements in order to assess the degree of interrater agreement.
All voxels were segmented with a threshold of 80–300 ppb to select the SN. The threshold was determined by the first investigator, who observed that the values could include the lower part of the SN in 10 participants. Each side was selected separately. The investigators were asked to determine the part with lower susceptibility values within the presumed SN–which presumably consisted of the normal nigrosome-1 with or without other nigrosomes–by manual correction (Fig. 1B and C). Such manual correction was limited to the dorsolateral portion of the SN in order to avoid the inadvertent inclusion of other regions.
After combining the segmented voxels on each side, the mean susceptibility value and the proportions of voxels with susceptibility values lower than 80, 75, 70, 65, and 60 ppb were calculated for the histogram analysis. The segmented SN regions on the right and left that had higher mean susceptibility values and fewer voxels with susceptibility values lower than 80, 75, 70, 65, and 60 ppb were chosen for comparisons between the patients with IPD and the healthy subjects.
Visual assessments of susceptibility map-weighted imaging
The reconstructed susceptibility map-weighted imaging (SMWI) images (Supplementary Material in the online-only Data Supplement) were resliced using the same method that was applied to the QSM images. A neuroradiologist and a neurologist independently reviewed images while blinded to other clinical information. To minimize any recall bias, the neuroradiologist assessed images 2 months after quantifying the susceptibility in the SN. The signal intensity of the nigrosome-1 region was compared with that of the white matter lateral to the decussation of the superior cerebellar peduncles, and was classified into three grades: normal (iso- or hyperintensity), possibly abnormal (hypointensity in <50% of the nigrosome-1 region), and definitely abnormal (hypointensity in ≥50% of the nigrosome-1 region).56 Each side was rated separately in each subject. For a simplified statistical analysis, the images of a participant were reclassified as abnormal if any abnormality was identified on either side of the nigrosome-1 region, while it was considered normal when the nigrosome-1 was determined to be normal bilaterally. Any discrepancy between the two raters was resolved by consensus.
Statistical analyses
The chi-square test was used to compare the sex distribution between the patients with IPD and the healthy subjects. The Mann-Whitney U test or independent t-test was applied according to the normality of the results for each continuous variable, including the age, MMSE score, mean susceptibility, and proportion of voxels with susceptibility values lower than 80, 75, 70, 65, and 60 ppb. The areas under the receiver operating characteristics (ROC) curves were compared for the mean susceptibility values and the proportions of voxels with susceptibility values lower than 80, 75, 70, 65, and 60 ppb using MedCalc (version 16.8.4, Mariakerke, Belgium), based on the method developed by DeLong et al.21 The diagnostic results were compared between the two investigators using the intraclass correlation coefficient, Bland-Altman plots, and the McNemar test. The diagnostic performances of QSM combined with histogram analysis and visual assessments of SMWI were compared using ROC curves. The cutoff for statistical significance was set at p<0.05. Statistical analyses were conducted with SPSS Statistics (version 23, IBM Corp., Armonk, NY, USA).
RESULTS
Comparison of susceptibility values between patients with IPD and healthy subjects
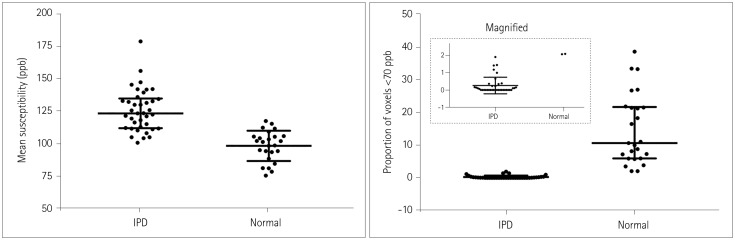
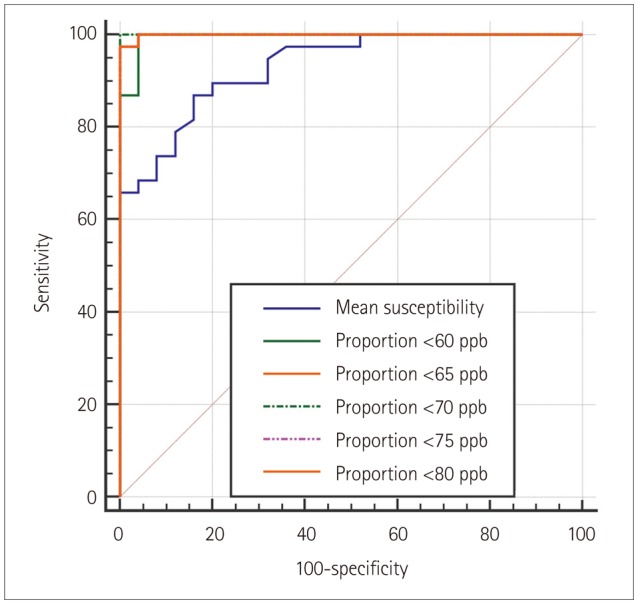
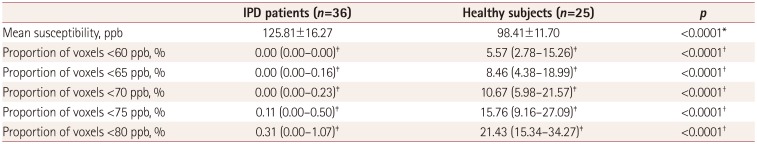
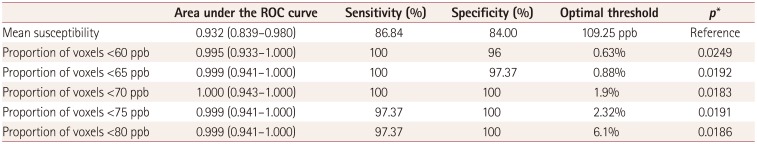
Table 2 summarizes the differences in the mean susceptibility values and the proportions of voxels with susceptibility values lower than 80, 75, 70, 65, and 60 ppb in the lower part of the SN between the patients with IPD and the healthy control subjects. All six parameters differed significantly between the two groups (all p<0.0001). Table 3 summarizes the areas under the ROC curves and the diagnostic sensitivity, specificity, and the optimal thresholds for the mean susceptibility and the proportions of voxels with susceptibility values lower than 80, 75, 70, 65, and 60 ppb. The mean susceptibility with an optimal threshold of 109.25 ppb yielded 4 false-positive results out of 25 healthy subjects (16%) and 5 false-negative results out of 36 IPD patients (13.9%). The threshold of 1.9% for the proportion of voxels with susceptibility values lower than 70 ppb showed a sensitivity of 100% and a specificity of 100% without overlap between the patients with IPD and the healthy subjects, and both the diagnostic sensitivity and specificity decreased for lower thresholds (Supplementary Fig. 3 in the online-only Data Supplement). On the other hand, the mean susceptibility values overlapped between the two groups (Fig. 2). The ROC curves differed significantly between the mean susceptibility values and the proportion of voxels with susceptibility values lower than 70 ppb (p=0.0183) (Fig. 3).
Interrater agreement
The measurements made by the second investigator were compared with those made by the first investigator for the proportion of voxels with susceptibility values lower than 70 ppb, which revealed a significant correlation on both sides (intraclass correlation coefficient=0.844 and 0.895 on the right and left, respectively; both p<0.0001). The Bland-Altman plots for the right and left sides showed that most measurements were within the upper and lower 95% limits of agreement (Supplementary Fig. 4 in the online-only Data Supplement). When applying the optimal threshold of 1.9% for the proportion of voxels with susceptibility values lower than 70 ppb as determined by the first investigator, the measurements made by the second investigator produced one false-positive and one false-negative result, thereby exhibiting no significant difference from those made by the first investigator (p>0.05).
Visual assessments of SMWI
There were three differences in the interpretations of SMWI made by the two raters (k=0.894), which were resolved by consensus. All of the IPD patients were correctly diagnosed, while five healthy subjects (20%) were considered abnormal; those false-positive subjects exhibited small proportions of voxels with susceptibility values lower than 70 ppb in the nigrosome-1 region (Supplementary Fig. 5 in the online-only Data Supplement). The ROC curves differed significantly between the visual assessments of SMWI and the proportions of voxels with susceptibility values lower than 70 ppb (p=0.0143).
DISCUSSION
This study demonstrated that QSM at a high spatial resolution combined with histogram analysis of the lower part of the SN can improve the diagnostic differentiation between early-stage IPD patients and healthy subjects. This improvement in diagnostic performance was achieved by considering several factors. We drew ROIs below the level of the red nucleus to include only the part of the SN that contains nigrosome-1. Such limited ROIs were also used by Azuma et al.,13 who drew ROIs in the anterior, middle, and posterior SN regions below the level of the red nucleus in coronally reformatted QSM. We acknowledge that their method is reasonable because the upper border of the SN is not clearly defined in conventional MRI, and the most important structure for evaluating IPD (nigrosome-1) is located in the dorsolateral aspect of the SN. Unlike their method, we performed high-spatial-resolution QSM in the imaging plane perpendicular to the axis of nigrosome-1, which helped our investigators to determine normal nigrosome-1 regions in the SN on both sides of healthy subjects and the normal or less-affected SN regions of IPD patients. We also utilized histogram analysis to improve the diagnostic accuracy.
As reported previously,1011131415 healthy subjects may exhibit higher susceptibility values in the dorsolateral part of the SN that would lead to false-positive interpretations of nigrosome-1 images.2456 Our study also identified this problem in 5 of 25 healthy subjects, which is a higher proportion than in most previous studies but lower than that in a recent study.22 This higher prevalence of false-positive findings in our study may have been due to differences between the imaging methods used in previous studies and the SMWI that we used. The higher contrast-to-noise ratio of SMWI may help to improve the diagnostic sensitivity,23 but it may also increase the rate of false-positive results.
While it has previously been demonstrated that the visual assessment of nigrosome-1 or dorsolateral nigral hyperintensity at 3 T can show perfect diagnostic sensitivity,26 the reported specificity has been lower, ranging from 83.6% to 85.0%;5624 such a trade-off between sensitivity and specificity is commonly observed in medical research. Moreover, the diagnostic sensitivities in previous visual assessments of a similar region at 3 T were relatively low, at approximately 88%.2425 We addressed this limitation by adopting histogram analysis, which yielded perfect discrimination between the two groups using a threshold determined by the proportion of voxels with susceptibility values lower than 70 ppb. Our technique may have implications for improving the diagnostic specificity by reducing the rate of false-positive findings.
Despite our efforts to draw ROIs in the SN from the level of the inferior border of the red nucleus down to the lowermost region of higher susceptibility on QSM in order to determine the nigrosome-1 region, these areas may have included the nigrosome-3 region. However, that region is relatively small, exhibits lower susceptibility, and is in close proximity to the posterior border of the SN.20 The nigrosome-3 region may therefore be indistinguishable from the adjacent midbrain area outside the SN, and is unlikely to be included within the ROIs in healthy or less-affected SN cases, although it may be included in the affected SN due to its higher susceptibility.
A quantitative assessment for determining the presence or absence of abnormalities in the SN with QSM at a high spatial resolution is more desirable than a visual assessment, particularly when a suspicious abnormality has been observed in a visual assessment of nigrosome-1 in SMWI or another method. However, our method has the following downsides: it requires normal-looking nigrosome-1 regions to be identified by manual correction of the ROIs, and it is slower than simple visual assessments. Lastly, although we found good agreement between the assessments made by the two reviewers in our study, there were still a few discrepancies. Therefore, a better segmentation or fully automated method should be developed to improve the reproducibility and diagnostic accuracy.
This study was subject to several limitations. First, it had a retrospective single-center design. Second, the number of patients enrolled was relatively small. Third, we did not enroll patients with atypical parkinsonism. We surmised that patients exhibiting multiple system atrophy with predominant parkinsonism and progressive supranuclear palsy may also show abnormalities similar to those associated with IPD, as suggested in recent studies.22252627 Fourth, despite its utility, the results of QSM have been shown to depend on the specific methods and parameters used in the reconstruction process. It might therefore be necessary to determine the optimal threshold if a user applies different QSM options or algorithms for reconstruction. Fifth, QSM involves relative measurements that require a reference ROI for determining the relative susceptibility values. In this study, we used the decussation of the superior cerebellar peduncle as a reference on the assumption that this structure is not affected by IPD, and the threshold would need to be adjusted accordingly if another reference is used. Finally, confirmation of the abnormalities of the SN in QSM using histopathological examinations may improve the confidence of the findings. Conducting such imaging-pathology correlation studies focused on the correlation between a histogram analysis and the extent of degeneration in the nigrosome-1 region would be important. However, this would be quite challenging to do with a sizable number of patients.
In summary, QSM at a high spatial resolution combined with histogram analysis in the lower part of the SN below the level of the red nucleus may provide better differentiation of early-stage IPD patients from normal subjects compared with measurements of the mean susceptibility values in the SN using QSM.
 XML Download