

 PDF
PDF ePub
ePub Citation
 Print
Print


INTRODUCTION
Hepatic steatosis is a condition characterized by lipid accumulation in the hepatocytes. Nonalcoholic fatty liver disease (NAFLD) is the most common condition associated with hepatic steatosis and is the most prevalent chronic liver disease in the Western countries, affecting more than 30% of the general population (1). Clinically, NAFLD is strongly related to features of the metabolic syndrome, including type 2 diabetes, obesity, dyslipidemia, and atherosclerotic cardiovascular disease (234). Histologically, NAFLD has a broad spectrum of manifestations that ranges from simple steatosis to nonalcoholic steatohepatitis, which represents a major risk factor for fibrosis, cirrhosis, and hepatocellular carcinoma (56). Therefore, the early detection of hepatic steatosis is of great importance for the early diagnosis and follow-up of NAFLD, which enable proper management of this condition.
Although liver biopsy is regarded as the reference standard for the assessment of hepatic steatosis (7), it has several drawbacks, including bleeding risk, sampling error, and inter-reader variability (89). In addition, liver biopsy is an invasive procedure that is unsuitable for monitoring of a disease. In this regard, magnetic resonance imaging (MRI) techniques, such as the proton density fat fraction technique, or the hydrogen-1 spectroscopy, have a potential for quantitative evaluation of hepatic steatosis because of their non-invasiveness and excellent diagnostic performance, which is comparable to that of liver biopsy (10). However, MRI is expensive and has limited availability; therefore, the screening and follow-up of patients with hepatic steatosis using MRI may not be feasible in routine clinical practice.
Ultrasound (US) is a non-invasive, inexpensive, and widely available imaging modality that can be used for the diagnosis of hepatic steatosis (1112). However, the investigation of liver fat using the conventional B-mode US has limitations, including low reliability and low accuracy (1314). Although several US techniques have been developed to overcome these shortcomings in the assessment of hepatic steatosis (15161718192021), they were complex or used non-commercial software that has not been widely introduced to clinical practice.
Normalized local variance (NLV) technique is an US quantification method that has recently been developed by Canon Medical Systems. The NLV technique is based on the statistical analysis of the echo amplitude obtained from the grayscale US images. Very small objects that are smaller than the US beam wavelength cause scattering and interference of the US beam, which generates a speckle pattern in the liver (222324). Theoretically, the distribution of the echo amplitude in the liver approximates the Rayleigh distribution (24). However, in the real normal liver, small structures, such as vessel walls, which are larger than the US beam wavelength, increase the variance in the scattering, resulting in a heterogeneous speckle pattern, which deviates from the Rayleigh distribution. In contrast, in hepatic steatosis, the small structures become masked by the increased echogenicity of the surrounding hepatic parenchyma. Therefore, the real echo amplitude distribution of the steatotic liver approaches the theoretical Rayleigh distribution. The NLV technique assesses the difference between the theoretical and real echo amplitude distribution, which is the reason we believe that it can be used for the evaluation of hepatic steatosis. There has not been a study yet reporting the role of NLV imaging in the evaluation of hepatic steatosis.
Therefore, the purpose of this study was to evaluate the diagnostic performance of NLV for the evaluation of hepatic steatosis in a diet-induced rat model of NAFLD, using histopathology as a reference standard.
MATERIALS AND METHODS
Animals
The institutional animal care and use committee approved this animal study (no. 17-0138). Forty, 9-week-old, male Sprague-Dawley rats, weighing 250–300 g, were used in our study. The rats were acclimatized to the standardized laboratory conditions of our hospital for one week prior to the experiments. To induce fatty liver disease, the rats were fed a methionine-choline-deficient (MCD) diet (Research Diets, Inc., New Brunswick, NJ, USA) ad libitum for variable periods: 0, 2, 4, 6, 8, 10, or 12 days, or 2, 3, or 4 weeks, with four rats per group (212526). At the end of the diet period in each group, we performed peripheral blood sampling, 1H magnetic resonance spectroscopy (MRS), and US with the NLV technique to evaluate the degree of steatosis.
1H Magnetic Resonance Spectroscopy
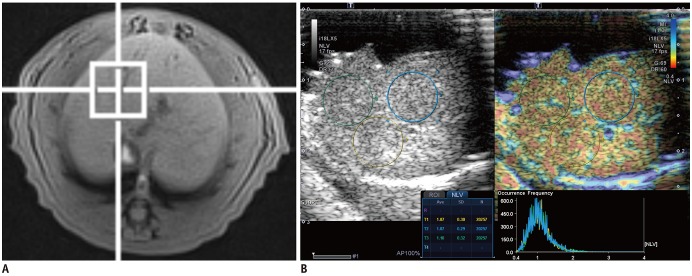
1H MRS examinations were performed using a clinical 3T MRI machine (TrioTim; Siemens Healthineers, Erlangen, Germany) with a rat-dedicated six-channel body coil (Stark Contrast, MRI Coils Research, Erlangen, Germany), whose inner diameter was 5 cm. After acquisition of scout images to localize the liver, volumetric T1-weighted imaging was performed, using a radial volumetric interpolated breath-hold examination to avoid respiratory motion artifacts. The high-speed T2-corrected multi-echo sequence was used with the following parameters: repetition time, 3000 ms; echo times, 12, 24, 36, 48, and 72 ms. A 10 × 10 × 10 mm3 single voxel was placed on the liver parenchyma, avoiding large vessels, hepatic focal lesions, and extrahepatic structures. The fat fraction of the liver was calculated using T2 correction for both fat and water contents. T2-corrected peak areas of fat and water were calculated separately from the areas of fat and water at each echo time, and an exponential fitting algorithm was used to extrapolate the fat and water signals at an echo time of 0 ms, which were regarded as T2-corrected peak areas (2728). Subsequently, the fat fraction of the liver was automatically calculated and presented as a percentage (Fig. 1). For each rat, 1H MRS was performed five times, and the median value was used for the analysis.
US Examination
One radiologist (with 6 years of experience in liver imaging) performed all US examinations using an US scanner (Aplio i900; Canon Medical Systems, Tochigi, Japan) with a 5–18 MHz linear probe. The rats were anesthetized before the US examinations and open laparotomy was performed to expose their livers for acquisition of the optimal sonic window. The display depth and transmission focus were set at 30 and 15 mm, respectively, and cross-sectional images of the hepatic parenchyma were obtained initially. For receiving the best possible signal, uniform images on attenuation were acquired. After securing an adequate sonic window, US examination was turned into the NLV mode. In NLV mode, a circular region of interest (ROI) with a minimum diameter of 10 mm was placed on the liver parenchyma. Care was taken to avoid the subcapsular area, hepatic vessels, and artifacts (Fig. 1). The NLV value was automatically calculated and displayed on the lower left portion of the screen. In the results area, average value and standard deviation of NLV, and sampling number within ROI (n) for calculating NLV were displayed. In the graph area next to the results, a histogram was displayed, which contained the NLV value on the x-axis and the occurrence frequency on the y-axis. The NLV examination was performed until five NLV values were obtained, and the median of the five NLV values was used for the analysis. The principles and detailed description of the NLV technique are explained in the Supplementary Materials.
Another session of NLV value measurement was performed by a different radiologist (with 14 years of experience in liver imaging) for the assessment of the interobserver agreement. This reproducibility test was performed by loading the raw data of the NLV images and placing new ROIs on the US scanner machine. Five NLV values were obtained and the median value was also chosen. After this independent session of NLV assessment, the two radiologists who performed NLV value measurement reached a consensus on the placement of ROI on NLV images. Disagreements between the two radiologists were resolved by discussion with a third radiologist (with 27 years of experience in liver imaging).
Biochemical and Histopathologic Examination
Before imaging examinations, peripheral blood was sampled to perform liver function tests. Immediately after the 1H MRS and US, the rats were euthanized, and their livers were excised for histopathologic examination. The excised liver specimens were fixed using a 10% buffered formalin solution for 24 hours, followed by cutting and embedment in paraffin. Subsequently, 5 µm-thick tissue slices were cut and stained with hematoxylin-eosin and Masson trichrome. An experienced pathologist (with 18 years of experience in interpretation of liver specimens) evaluated the specimens according to the NAFLD-specific histologic scoring system (29). The degree of steatosis was graded on a four-point scale, as follows: score 0 (< 5%, none), score 1 (5–33%, mild), score 2 (> 33–66%, moderate), and score 3 (> 66%, severe). Lobular inflammation was graded from score 0 to 3, and hepatocyte ballooning was graded from score 0 to 2 (29). Thereafter, the NAFLD activity score was calculated as the sum of the scores of steatosis (score, 0–3), lobular inflammation (score, 0–3), and hepatocyte ballooning (score, 0–2); thus, it ranged from 0 to 8 (29). In addition, the fibrosis stage was also evaluated on a five-point scale according to the Meta-analysis of Histological Data in Viral Hepatitis scoring system (30).
Statistical Analysis
Data were presented as median (range), or absolute numbers (percentages), as appropriate. Continuous variables were compared using the Kruskal-Wallis test, and categorical variables were evaluated using the chi-square test or the Fisher's exact test. Spearman correlation coefficient was calculated to assess the correlation between the NLV value and each variable. The interobserver agreement was evaluated using the intraclass correlation coefficient (ICC), with the following convention: < 0.20, poor; 0.21–0.40, fair; 0.41–0.60, moderate; 0.61–0.80, substantial; and 0.81–1.00, near-perfect agreement (31). The receiver operating characteristic (ROC) curve was calculated to assess the diagnostic performance of the NLV value in the detection of hepatic steatosis using the area under the ROC curve (AUC), and to find the optimal cut-off values. Univariate linear regression analysis was performed to assess the relationship between each variable and the NLV value. Multivariate analysis was conducted to determine the factors that affected the NLV value, including the variables with p < 0.05 from the univariate analysis. All statistical analyses were performed using a commercial software (MedCalc version 18.9; MedCalc Software, Mariakerke, Belgium, and IBM SPSS Statistics for Windows, version 23.0; IBM Corp., Armonk, NY). A p value < 0.05 was considered to be statistically significant.
RESULTS
Induction of NAFLD in the Rats with the MCD Diet
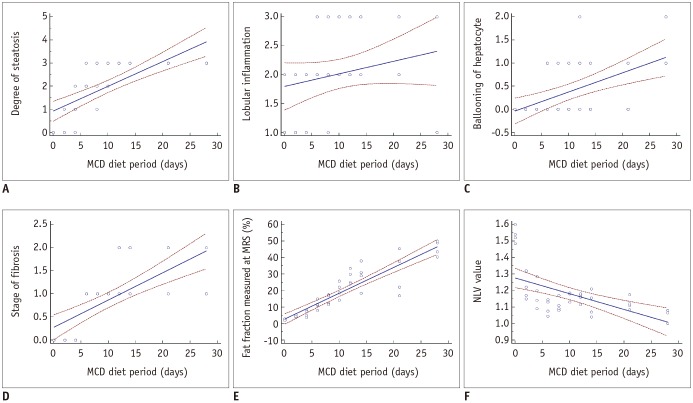
The results of the histopathologic and imaging examinations in the rats are described in Figure 2. There was no hepatic steatosis in the control group at either histopathologic examination or MRS. Hepatic steatosis was induced after as early as two days of MCD diet (25%, 1 of 4). Four-day MCD diet induced a grade 1 or 2 steatosis in 75% (3 of 4) of the rats, with a median estimated fat fraction at MRS of 6.04% (range, 3.74–8.01%). After a six-day MCD diet, at least a mild degree of hepatic steatosis was found in all rats upon histopathologic examination, with a median estimated fat fraction at MRS of 11.42% (range, 8.03–14.96%). After an MCD diet of more than 10 days, the histopathologic examination revealed a severe hepatic steatosis in all rats, with a median estimated fat fraction at MRS of 33.32% (Fig. 2). Finally, there were eight, four, six, and twenty-two rats with hepatic steatosis score of 0, 1, 2, and 3, respectively. The stage of fibrosis and the median estimated fat fraction at MRS significantly increased with the duration of the MCD diet (ρ = 0.818, 95% confidence interval [CI]: 0.679, 0.900; p < 0.001, and ρ = 0.938, 95% CI: 0.885, 0.967; p < 0.001, respectively).
NLV Value according to the Histopathologic Results and Interobserver Agreement
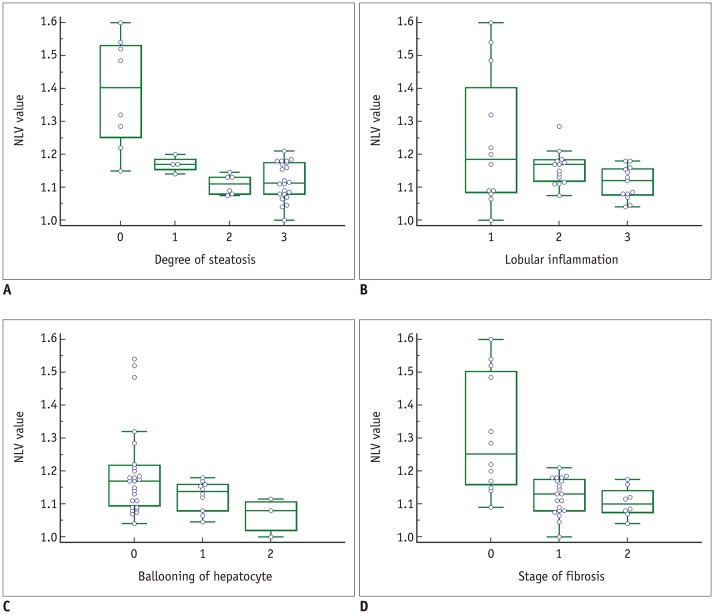
NLV examination was successfully performed in all 40 rats. The NLV value significantly decreased with the duration of the MCD diet (ρ = −0.579, 95% CI: −0.755, −0.327; p < 0.001) (Fig. 2). The NLV value demonstrated negative correlations with the steatosis upon histopathologic examination, and with the median estimated fat fraction at MRS (ρ = −0.552, 95% CI: −0.737, −0.291; p < 0.001, and ρ = −0.543, 95% CI: −0.731, −0.278; p < 0.001, respectively). The NLV value decreased along with the increase in the stage of fibrosis and the degree of hepatocyte ballooning assessed at histopathologic examination (ρ = −0.564, 95% CI: −0.745, −0.307; p < 0.001, and ρ = −0.372, 95% CI: −0.613, −0.069; p = 0.018, respectively). The NLV value did not significantly differ according to the lobular inflammation (p = 0.064) (Fig. 3). Among the rat livers with severe hepatic steatosis, the NLV values did not differ significantly according to the stage of fibrosis (p = 0.357). In the groups with moderate or lesser degrees of hepatic steatosis, the sample size was too small to compare the NLV values according to the stage of fibrosis. The agreement between the two radiologists was near-perfect (ICC value 0.844, 95% CI: 0.723, 0.915).
Diagnostic Performance of the NLV Value to Determine the Degree of Hepatic Steatosis
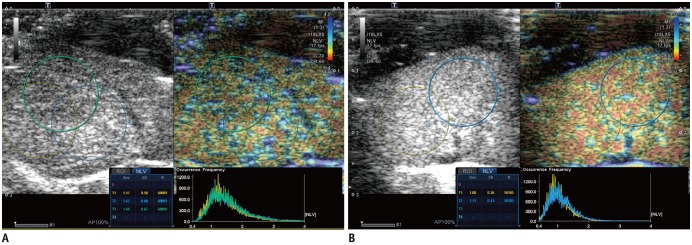
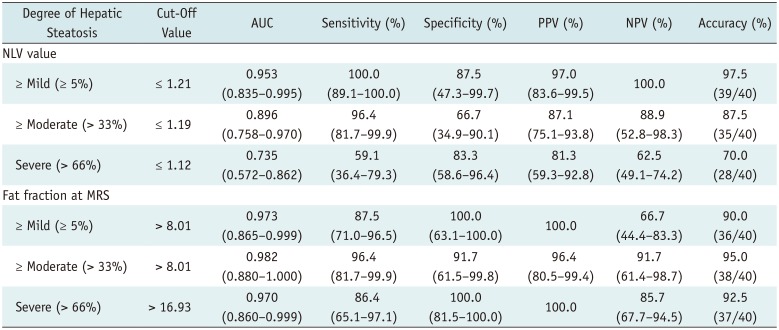
The diagnostic performances of the NLV values and the estimated fat fraction at MRS for evaluation of the varying degrees of hepatic steatosis are shown in Table 1. For the diagnosis of ≥ mild, ≥ moderate, and severe steatosis, the AUCs were 0.953, 0.896, and 0.735, respectively, for the NLV value, and 0.973, 0.982, and 0.970, respectively, for the estimated fat fraction at MRS (Fig. 4). For the detection of ≥ mild and ≥ moderate hepatic steatosis, there was no significant difference in the diagnostic performance between the MRS and NLV (p = 0.706 and 0.106, respectively). For the detection of severe hepatic steatosis, the estimated fat fraction at MRS exhibited a better diagnostic performance than the NLV value (p = 0.004).
Factors Associated with the NLV Value
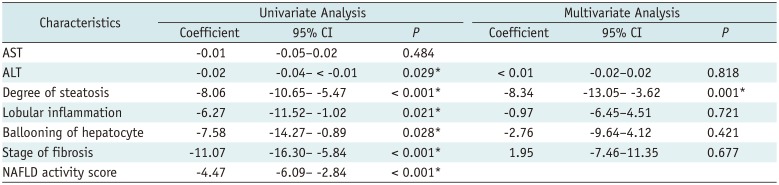
The univariate analysis revealed that the alanine aminotransferase, degree of steatosis, lobular inflammation, ballooning of hepatocytes, stage of fibrosis, and NAFLD activity score were factors that affected the NLV value (Table 2). However, the multivariate analysis revealed that only the degree of hepatic steatosis was associated with the NLV value (p = 0.001).
DISCUSSION
To the best of our knowledge, this is the first study to investigate the diagnostic performance of the NLV technique in the evaluation of hepatic steatosis, with a reference standard of histopathologic examination. In this study, the NLV value demonstrated satisfactory diagnostic performance in evaluating the various degrees of hepatic steatosis assessed from histopathologic examination. The AUCs of the NLV values for the detection of ≥ mild, ≥ moderate, and severe steatosis were 0.953, 0.896, and 0.735, respectively. For the detection of ≥ mild and ≥ moderate degrees of hepatic steatosis, there were no significant differences between the AUCs of the NLV value and those of the estimated fat fraction at MRS.
The assessment of hepatic steatosis on grayscale US relies upon the comparison of the echogenicity of the hepatic parenchyma with that of the renal parenchyma (11). Although this qualitative method can be easily performed from conventional grayscale US images, it is subjective and has a high interobserver variability (13). Moreover, the diagnostic performance of this qualitative US assessment of hepatic steatosis is significantly lower than that of MRS, which is known to be an excellent non-invasive technique for the assessment of hepatic steatosis. In our study, the sensitivity of NLV technique was not significantly different from that of MRS in the detection of ≥ mild or ≥ moderate degrees of hepatic steatosis. In addition, the NLV technique can be performed during routine conventional grayscale US examination, and is advantageous over MRS because of the wider availability and cost-effectiveness of US compared to MRS. Hence, the NLV technique may be useful for the diagnosis and monitoring of hepatic steatosis.
In our study, the diagnostic performance of the NLV value in the detection of ≥ severe hepatic steatosis was significantly lower than that of MRS (AUC; 0.735 vs. 0.970, p = 0.004). The low diagnostic capability of the NLV value for the detection of ≥ severe steatosis may be caused by the distribution of the NLV values according to the degree of steatosis. The NLV values of the rats with mild or moderate steatosis showed significant overlap with that of the rats with severe steatosis, which would have made it difficult to differentiate severe steatosis from moderate or lesser degree of steatosis. Regarding MRS, although we did not assess the distribution of estimated fat fractions on MRS according to the steatosis degree, it showed a higher correlation coefficient with the duration of MCD diet than that of the NLV values (ρ; 0.938 vs. 0.579). Thus, the estimated fat fractions on MRS may not show significant overlap between the different degrees of hepatic steatosis. We speculate that the large overlap between the NLV values of the rats with mild or moderate steatosis and that of the rats with severe steatosis could have resulted from the small number of the rats with moderate or lesser degree of hepatic steatosis. Hence, further studies with a larger number of rats with moderate or lesser degree of hepatic steatosis would be needed for better evaluation of the diagnostic performance of the NLV values in the detection of ≥ severe hepatic steatosis.
We found that the NLV value was only associated with the degree of steatosis assessed at the histopathologic examination. According to previous studies that are also based on the assessment of the homogeneity of hepatic parenchymal echogenicity, in a similar manner to that of the NLV technique, the stage of fibrosis as well as the degree of steatosis are associated with the homogeneity of hepatic parenchymal echogenicity (21). The speckle pattern of the liver is known to change from homogeneous to heterogeneous along with the development and progression of hepatic fibrosis (32). In addition, fibrosis can cause the blurring of structures, including small hepatic vessels or bile duct, and affect the echogenicity of the hepatic parenchyma (21). Hence, the presence and stage of fibrosis may in theory influence the NLV value. However, we found that there was no difference in the NLV values according to the stage of hepatic fibrosis in the rat livers with severe hepatic steatosis. This result may be due to the severe fatty infiltration masking the inhomogeneous fibrotic hepatic parenchymal echotexture. The relatively narrow range of the NLV values (mostly between 1.0 and 1.2) under the condition of any degree of hepatic steatosis (Fig. 3), may also indicate the potent influence of steatosis on the hepatic parenchymal echogenicity; even mild steatosis led to homogeneous parenchymal echotexture and decreased the NLV values. Moreover, the distribution of hepatic fibrosis was skewed in our study; all rat livers with severe steatosis had either F1 or F2 fibrosis. In each group of equal to or less than moderate hepatic steatosis, the sample size was too small to compare the NLV values according to the different stages of hepatic fibrosis. Therefore, to accurately assess the influence of hepatic fibrosis on the NLV value, further studies may be needed with a large enough and balanced distribution of fibrosis stage among those with the same degree of hepatic steatosis.
There are a few limitations in our study. First, the distribution of hepatic steatosis in our rats was skewed: the number of rats with no (n = 8), mild (n = 4) or moderate (n = 6) steatosis was relatively small compared to the number of rats with severe steatosis (n = 22). The NLV values of the rats without steatosis were scattered over a wide range from 1.1 to 1.6. This result is difficult to explain; it could possibly be due to the small sample size. The small number of mild steatosis (n = 4) may have led to an overestimation of the AUC obtained from the ROC curve analysis as well. In this regard, it should be noted that the diagnostic performance of MRS in the evaluation of hepatic steatosis was not hampered by this small number of rats with mild or moderate steatosis. Second, as there was no severe fibrosis or cirrhosis in the rat livers, the exact effect of advanced fibrosis on the NLV value could not be investigated. In addition, the NLV technique is only available in a specific US machine; thus, our result cannot be generalized to other US scanners. Lastly, we performed the NLV examination in the rats by using a linear transducer via open laparotomy. Further studies are required to assess the diagnostic performance of the NLV value in assessment of hepatic steatosis using a convex transducer through transabdominal US examination.
In conclusion, the NLV value demonstrated a satisfactory diagnostic performance in the evaluation of the degree of hepatic steatosis. The NLV value showed a negative correlation with the fat fraction measured at MRS. The degree of steatosis was the only factor that significantly affected the NLV value.
 XML Download