

 PDF
PDF ePub
ePub Citation
 Print
Print


INTRODUCTION
A spinal epidural hematoma is an uncommon condition that occupies the spinal canal and that can present with compression of the spinal cord or cauda equina syndrome, resulting in a significant neurologic deficit. Therefore, urgent diagnosis is required. Magnetic resonance imaging (MRI) is the imaging modality of choice for the diagnosis of spinal epidural hematomas. Several studies have reported conventional MRI findings of spinal epidural hematoma (1); however, to the best our knowledge, there has been no previous report focused on the use of fat suppression images to find spinal epidural hematomas. Fat suppression techniques are an integral part of musculoskeletal imaging for two main purposes: tissue characterization and improved lesion conspicuity. Here, we present a case of an epidural organizing hematoma with an unexpected signal decrease on a short inversion time inversion recovery (STIR) image that had the potential to lead to diagnostic pitfalls in the assessment of the image.
CASE REPORT
A 75-year-old woman presented with right leg pain along the course of the right L5 nerve root and right foot drop that had lasted for one month. She was diagnosed with hypertension and a pulmonary thromboembolism two months earlier, which was treated with enalapril, aspirin, and warfarin for anticoagulation. A neurologic examination revealed a motor deficit of 4/5 right ankle dorsiflexion. Blood tests were normal except for prolonged prothrombin time (2.17 international normalized ratio, reference value < 1.2).
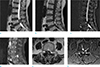
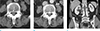
A lumbosacral spine MRI revealed a well-defined mass at the posterior epidural space at L4 with severe thecal sac compression. The mass showed high signal intensity on both T2- and T1-weighted images (Fig. 1a, b, e) and persistent increased signal intensity on a fat-suppressed postcontrast T1-weighted image (Fig. 1d). Gradient echo images demonstrated the mass's central bright high signal intensity and peripheral low signal rim (Fig. 1f). A diffuse signal decrease in the mass was detected on a STIR image (Fig. 1c). Because of the high signal intensity on the T1-weighted image and the diffuse signal decrease on the STIR image, we considered the possibility of a fat-containing tumor, such as an angiolipoma or a hemangioma. However, the outside preoperative computed tomography images that were uploaded into our picture archiving and communication system after surgery showed a peripheral rim enhancing lesion and hyperdensity (about 40 Hounsfield units) without a focus of fat attenuation on the precontrast image (Fig. 2).
The patient underwent total a laminectomy of L4, and during the epidural space exploration, an old blood-colored cystic lesion was found. The lesion was completely removed, and a histopathological examination confirmed the organizing hematoma diagnosis. After surgery, the patient's symptoms remained. Repeated imaging studies revealed a recurred epidural hematoma at the same location, and reoperation was performed. Three months later, the patient's right leg pain and foot drop were completely resolved.
DISCUSSION
STIR sequence uses an initial radio-frequency (RF) pulse to invert spins in longitudinal direction. After a short delay time called inversion time (TI), initial RF pulse is followed by 90 degree RF pulse (23). To achieve a fat suppression, TI should be chosen such that longitudinal magnetization of fat spins is zero when a subsequent 90 degree pulse is applied. Thus, STIR sequence depends on the T1 relaxation time of fat and can suppress signal from any tissue with short T1 relaxation time like fat. In the present case, the lesion showed high signal intensity on both T1- and T2-weighted images with a peripheral low signal intensity rim on gradient echo (GRE) image. This signal behavior is consistent with the late subacute stage of a hematoma. A subacute hematoma contains methemoglobin. In the inner sphere within heme region of methemoglobin, paramagnetic dipole-dipole interaction is responsible for T1 shortening (4).
A spinal epidural hematoma should be considered during the differential diagnosis of acute spinal cord compression syndrome, especially in patients receiving anticoagulants. A spinal epidural hematoma may occur spontaneously or secondarily after a trauma or procedure. With MRI, a hematoma shows various signal intensities corresponding with the hematoma's aging process and blood breakdown product. Hemoglobin transforms through several forms with hematoma evolution: hyperacute (intracellular oxyhemoglobin, long T1 and T2), acute (intracellular deoxyhemoglobin, long T1 and short T2), early subacute (intracellular methemoglobin, short T1 and T2), late subacute (extracellular methemoglobin, short T1 and long T2), and chronic (ferritin and hemosiderin, short T2) (4). In the present case, although an accurate 1:1 MR-pathologic correlation could not be performed because most of the lesion was removed in pieces and not en bloc, we believed that signal drop on STIR resulted from methemoglobin of blood breakdown products. To the best our knowledge, there have been two reports about signal drop on STIR images in hematoma (56). Froehlich et al. (5) and Khaladkar et al. (6) presented cases of hemorrhagic lesion with signal suppression on STIR in female pelvis.
Hematoma can show unexpected signal decrease on STIR images and it simulates signal behavior of fat tissue. Fat tissue demonstrates homogeneous signal drop on STIR images. In contrast, hematomas demonstrate heterogeneous signal drop with internal regions of high signal intensities and peripheral dark signal rim and it sometimes accompanied by fluid-fluid levels. Theses characteristic imaging features are helpful in differentiating hematomas from fatty lesions.
Fat-suppression techniques are an integral part of MRI and can be achieved by various methods (frequency-selective fat suppression, water-selective techniques, chemical shift, and inversion recovery). The selection of fat-suppression techniques depends on the purpose of the study, the amount of fat in the tissue, and the magnetic field strength. Frequency-selective fat saturation and STIR are most commonly used in clinical spine imaging (78).
Frequency-selective fat saturation is based on the chemical shift difference between water and fat. Fat saturation is specific for fat, providing an improved signal-to-noise ratio, and it is a reliable technique for the acquisition of contrast-enhanced imaging. The disadvantage of fat saturation is that it is highly sensitive to magnetic field inhomogeneity. Large fields of view and off-center imaging can result in failed fat saturation. Another limitation of fat saturation is that it is unsuitable for low-field strength magnets (28).
STIR is based on differences in T1 relaxation rather than the tissue-specific time of the tissues. The T1 relaxation time of fat is shorter than that of water. With the selection of a short inversion time, the null point of fat tissue, the signal of fat tissue is suppressed. The advantages of STIR are that it is less sensitive to magnetic field inhomogeneity than frequency-selective fat saturation and can be used in low-field strength magnets. The principal disadvantage is that this technique does not only suppress fat; the signal from tissue with a short T1 relaxation time can also be suppressed. Other disadvantages are a relatively long scanning time and low signal-to-noise ratio (28).
In our case, the mass seemed to be more enhanced on the fat-suppressed postcontrast T1-weighted image compared with the STIR image and the precontrast T1-weighted image. Because the background fat is suppressed, the assessment of the degree of enhancement can be overestimated or underestimated with only fat-suppressed postcontrast T1-weighted image. Therefore, when a fat suppression technique is used to contrast enhancement images for the evaluation of a tumorous condition, one-to-one corresponding comparison with fat-suppressed precontrast and postcontrast T1-weighted images or with nonfat-suppressed precontrast T1-weighted image and post contrast T1-weighted images may be helpful for the accurate assessment of the presence and the degree of enhancement to avoid distraction as stated above.
In summary, fat suppression is not tissue-specific but depends on T1 relaxation time on STIR images. Hemorrhagic content may have a short T1 relaxation time similar to that of fat and show signal decrease on STIR. Therefore, awareness of the nonselective signal suppression achieved with STIR images in hematoma may avert an erroneous diagnosis in image interpretation, especially when we evaluate patients receiving anticoagulants.
 XML Download