

 PDF
PDF ePub
ePub Citation
 Print
Print


Introduction
Cyclosporine A (CsA), a calcineurin inhibitor, is a commonly prescribed immunosuppressant for glomerular disease in children.[12] Even though its primary target organ is kidney, CsA has nephrotoxicity, which requires caution when using the drug. According to the ‘Kidney Disease: Improving Global Outcomes (KDIGO) Clinical Practice Guideline for Glomerulonephritis’, CsA is not suggested for patients with an estimated glomerular filtration rate (GFR) below 30 mL/min/1.73 m2, which is classified as severe renal impairment.[3] For patients with moderate renal impairment (GFR ranging 30–60 mL/min/1.73 m2), CsA is used following a rigorous evaluation of the risks and benefits. Due to its dose-related nephrotoxicity, maintaining the therapeutic concentration range is essential.[4] However, its narrow therapeutic range and high inter-individual and intra-individual variability in pharmacokinetics (PK) make it challenging to maintain the therapeutic concentration range which, in turn, may lead to poor clinical outcomes.[45]
In addition, there are general sources of variability in PK of CsA, which adds complications to providing appropriate therapy. CsA is primarily metabolized by cytochrome P-450 3A (CYP3A) and is a substrate of multidrug resistance efflux transporter, P-glycoprotein (P-gp). Previous studies have shown that polymorphisms in genes encoding CYP3A and P-gp may affect PK of drugs.[6] Ethnicity, linked to genetic polymorphisms of CYP3A and P-gp, has been reported to influence the PK profile of CsA.[78] The concomitant disease could affect the PK of the drug. Although only 0.1% of CsA is eliminated via the kidney,[9] not only hepatic impairment but also renal impairment affects the metabolism of the liver and eventually result in PK alterations. Accumulated uremic toxins in renally impaired patients are associated with alteration of the transporters and metabolic enzymes by genetic modification.[1011] Age is another known source of PK variability of CsA.[12] Despite its high utility in children, there are limited sources describing the pediatric PK of CsA.[131415] In accordance with labeling information, the pediatric dosage for transplantation or renal disease is adjusted by one's body weight.[16] However, CsA dose based on body weight alone does not efficiently achieve concentration targets in children.[17] Inter-individual variability from ethnicity, disease, and age all cause PK changes for the drug, which eventually may lead to a failed therapeutic response.[18]
Considering multiple factors are linked to PK variability, the whole-body physiologically-based pharmacokinetic (PBPK) model could be a useful tool for predicting PK of CsA. The whole-body PBPK model describes the PK of a drug by integrating known physiological information with biochemical processes and interactions.[19] Simcyp Simulator is the PBPK modeling and simulation platform that enables mechanistic and quantitative prediction of the impact of concomitant diseases, age, and even ethnicity. However, there are no details available yet on the specific ethnicity of children with renal impairment in the software, which limits PK prediction within the relevant population. This study primarily aimed to predict PK of CsA in Asian (Korean and Japanese) children with renal impairment by developing a PBPK model for the corresponding population. In addition, the net effect of ethnicity, age, and renal function on PK of CsA was assessed with the developed PBPK models.
Methods
Initial PBPK model development for specific populations
To assess the PK of CsA of Asian children with renal impairment, the PBPK models of Asian children with moderate and severe renal impairment were developed. The severity of renal impairment was based on GFR. A GFR ranging from 30 to 60 mL/min/1.73 m2 was considered ‘moderate renal impairment’, and a GFR less than 30 mL/min/1.73 m2 was considered ‘severe renal impairment’.
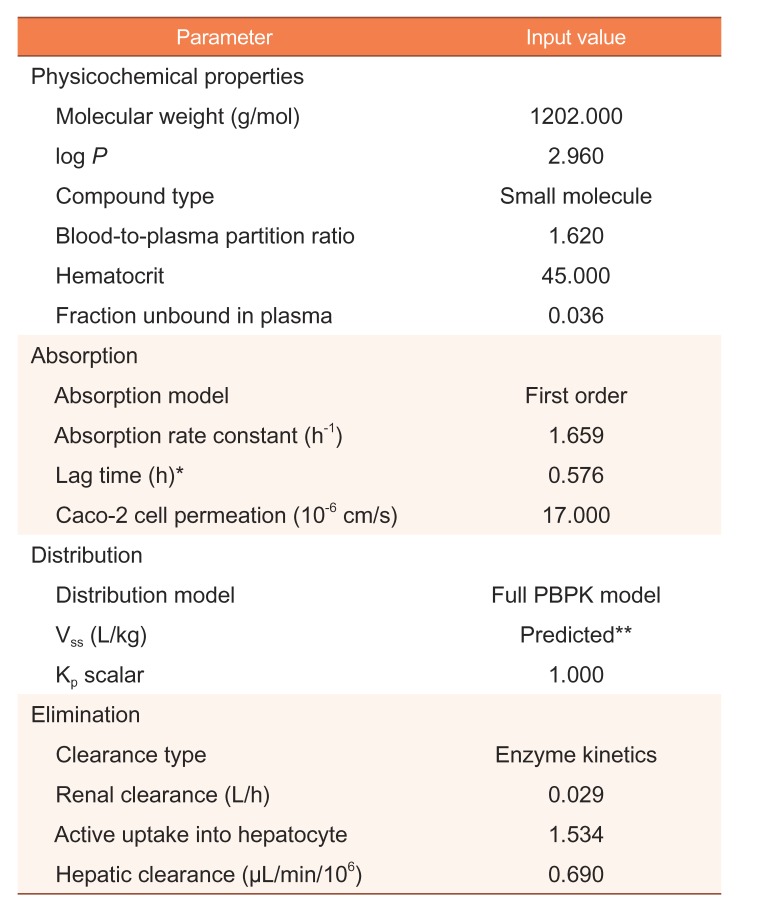
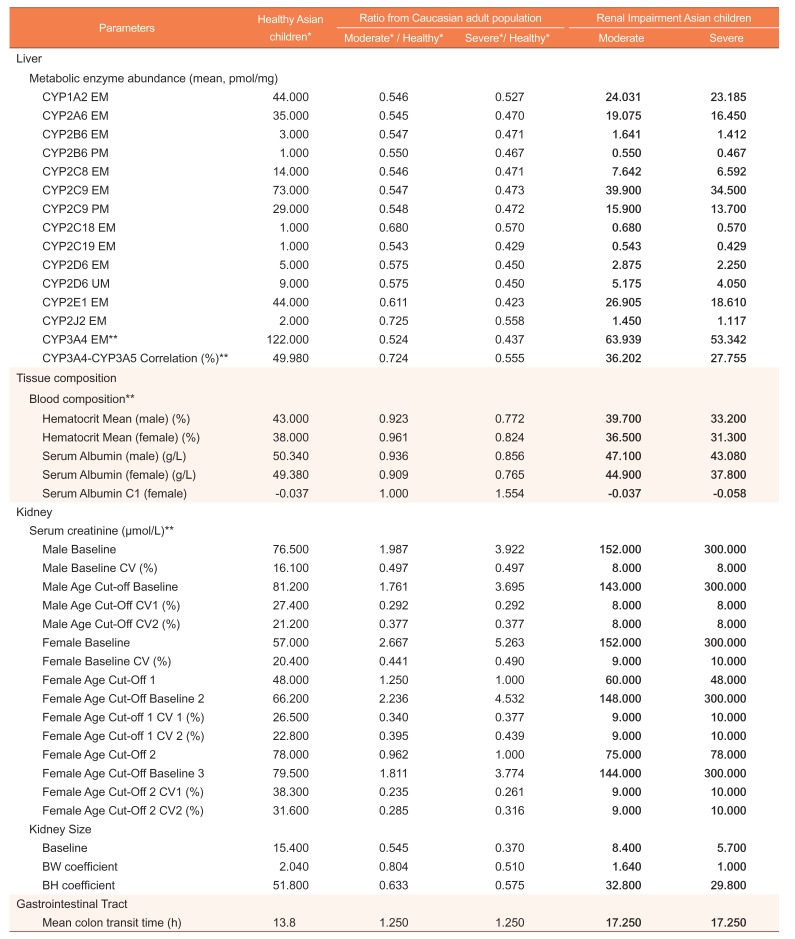
The whole-body PBPK model was developed using the Simcyp Simulator (Version 14 Release 1, Simcyp Ltd, a Certara Company, Sheffield, UK). Drug-specific parameters – physicochemical, blood binding, absorption, distribution, elimination, interaction, and transport – were taken from the compound file of the Simcyp Simulator. Table 1 presents the compound-related parameters integrated into this study. The physiological parameters were based on predetermined parameters of the Simcyp built-in population libraries. The built-in population libraries used in this study were as follows: ‘Sim-Healthy Volunteers’ for healthy Caucasians, ‘Sim-RenalGFR30-60’ and ‘Sim-RenalGFR less than 30’, which were based on North European Caucasian data, for Caucasians with moderate and severe renal impairment, respectively, and ‘Sim-Japanese’ for healthy Asians. For each population, a pediatric module is provided in the software. Changes in physiological parameters with age, such as ontogeny of drug-metabolizing enzymes, are applied to the simulations with a pediatric module.
To determine the physiological parameters that need to be modified, parameter values of healthy Caucasian adults were compared with those of Caucasian adults with renal impairment. The ratio of the healthy Caucasian adult population and the renal impairment population was calculated for each parameter that was different between the populations (renal impairment/healthy). Each ratio was then multiplied by the corresponding parameter for healthy Asian children.
Model verification
The constructed model was verified by observed clinical data from previously published literature.[20] Clinical data were comprised of PK data from 34 Korean children of age ranging from 2.3 to 17 (mean±standard deviation: 8.7±4.0 years) with nephrotic syndrome or glomerular diseases (male-female ratio of 2.2:1). Baseline mean creatinine clearance was 97.5±22.3 mL/min/1.73m2. Either capsules or the syrup formulation of CsA microemulsion (Cipol-N, Chong Keun Dang, Seoul, Republic of Korea) was given at 5 mg/kg/day, twice daily. The steady-state PK parameters were calculated with plasma CsA concentrations of 3–5 days after the first dose.
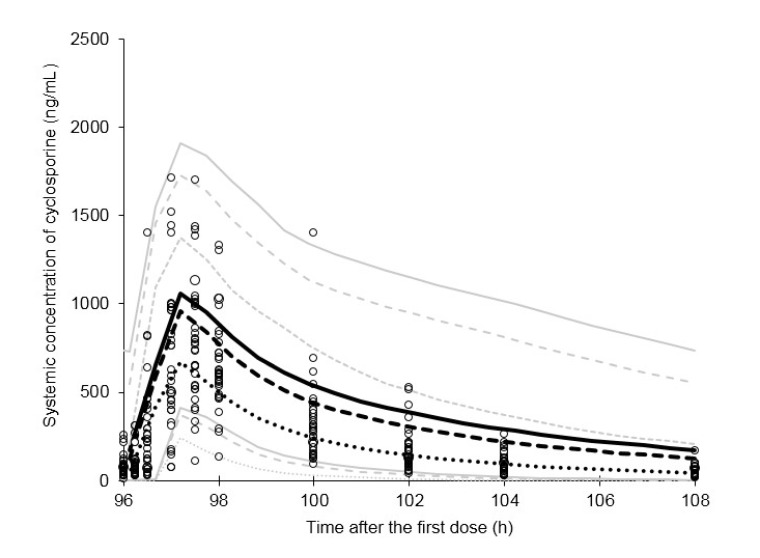
The same age and dosing regimen with observed data were applied to the simulation for verification. The simulated PK profile of 0–12 h of day 5 (from 96 h to 108 h after the first dose) was observed. In addition, PK parameters, including maximum plasma concentration at steady-state (Cmax,ss), area under the curve over 12 h after the last dosing (AUCτ,ss) and time at which Cmax,ss was observed (Tmax), were assessed.
The predictive performance using PBPK models was determined by visual predictive check. The mean and its 5–95% confidence intervals of simulated plasma concentration-time profiles were plotted with observed data for a visual predictive check.
Comparison of PK of CsA by ethnicity, age, and renal function
To identify the net impact of ethnicity, age, and renal impairment on PK of CsA, simulations were performed with the following subpopulations:
i. Healthy Caucasian adults and Caucasian adults with moderate and severe renal impairment.
ii. Healthy Caucasian children and Caucasian children with moderate and severe renal impairment.
iii. Healthy Asian adults and Asian adults with moderate and severe renal impairment.
iv. Healthy Asian children and Asian children with moderate and severe renal impairment.
The built-in population libraries of the Simcyp Simulator were utilized for simulations of Caucasian adults (i) and children (ii). Simulations of Asian children with renal impairment (iv) were conducted with the newly developed PBPK model of this study. Using the PBPK model development method for Asian children with renal impairment, PBPK models for Asian adults with renal impairment were developed. Specifically, the ratio of the healthy Caucasian adult population and renal impairment population for parameters showing discrepancies between the populations was calculated (renal impairment/healthy). Then, each ratio was multiplied by the corresponding parameter of the healthy Asian adult population. In the built-in Simcyp population libraries, the body weight and height of the population with impaired renal function were lower than that of the healthy population. To minimize confounding factors, body weight and height (baseline and coefficient of variation) were adjusted to the same as the healthy population.
A single simulation was composed of 10 trials of 10 subjects per trial. Age ranges for adults and children were 20–50 years and 0–15 years, respectively. All virtual individuals generated from the simulation were set as receiving 5 mg/kg/day capsule formulation, twice daily. PK parameters including Cmax,ss, AUCτ,ss, Tmax and overall plasma concentration-time profile were compared.
Results
Initial PBPK model development
PBPK models integrating ethnicity, age and renal impairment were developed. Several parameter values of kidney, liver and gastro-intestinal and tissue composition parts showed discrepancies between healthy and renally impaired populations in the Simcyp Simulator.
The abundance of cytochrome P450 enzymes in the liver was lower in the renal impairment populations than the healthy population. The CYP3A4 extensive metabolizers decreased 0.524-fold and 0.437-fold in moderate and severe renal impairment populations, respectively. CYP3A4-CYP3A5 correlation showed moderate differences between healthy and renal impairment populations. Parameters related to serum creatinine increased while kidney size decreased in renal impairment populations. The baseline serum creatinine increased approximately 2-fold and 4-fold, whereas baseline kidney size lowered 0.545-fold and 0.370-fold in moderate and severe renal impairment populations, respectively. Hematocrit and serum albumin values were slightly decreased in renal impairment populations. Among gastrointestinal parameters, the mean colon transit time was prolonged in the renal impairment populations. The altered physiological parameters in the renal impairment population compared to the healthy population is summarized in Table 2.
Model verification and optimization
Simulations of healthy Asian children and Asian children with renal impairment were performed with the built-in and newly developed PBPK model, respectively. Simulations with renally impaired PBPK models presented approximately 1 hour of lag time in the absorption phase. To optimize the absorption profiles, the lag time before absorption of the built-in compound file was modified. Based on the published literature, 1 h of lag time was replaced by 0.576 h.[212223]
Simulations with final PBPK models
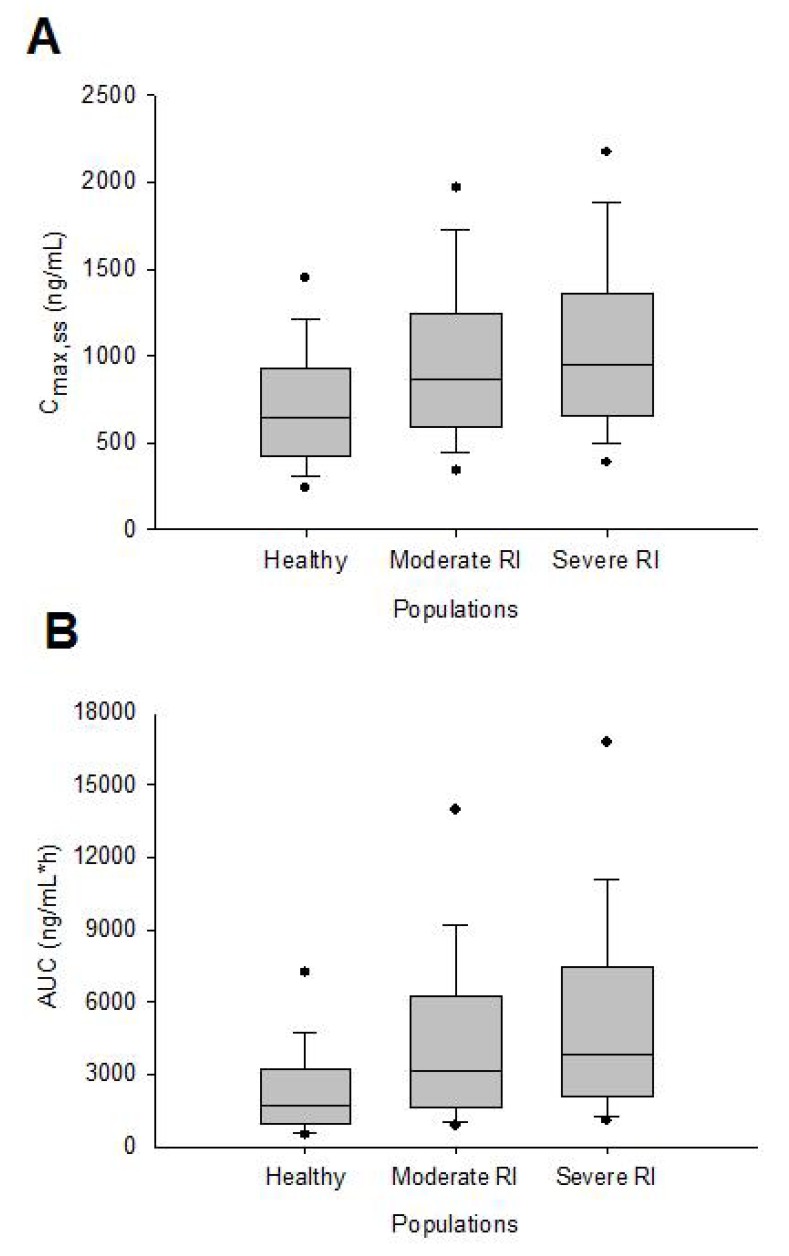
The final simulation results with modified lag times are shown in Figure 1. Asian children with moderate renal impairment reflected the observed data better than severe renal impairment population by means of visual predictive check. PK parameters from simulation and observed data were also compared. The Tmax values were 1.10 h, 1.20 h, 1.25 h for healthy, moderate RI and severe RI Asian pediatric populations, respectively. The Cmax,ss and AUCτ,ss tended to increase as the severity of disease increased (Fig. 2). Simulations with PBPK models of renal impairment population presented higher Cmax,ss and AUCτ,ss values than the observed data.
Ethnicity, age, and renal function
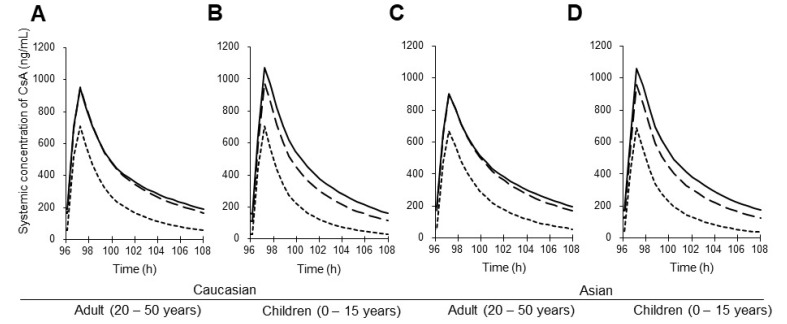
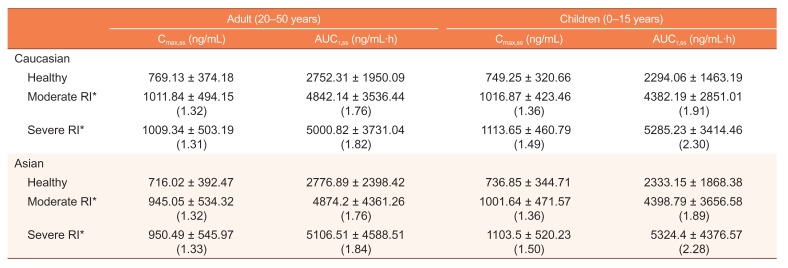
Simulations were conducted for combinations of different ethnicities and age groups (Table 3, Fig. 3). Asians had lower Cmax,ss and higher AUCτ,ss when compared with Caucasians. In the healthy and moderate renal impairment populations, Cmax,ss and AUCτ,ss values of children were lower than those of adults. However, in severe renal impairment populations, Cmax,ss and AUCτ,ss were higher in children than those of adults. In addition, the degrees of PK parameter change between the healthy and renally impaired groups were higher in children than those of adults.
Discussion
The primary objective of this study was to identify PK of CsA in Asian children with renal impairment by means of a PBPK model. There was no corresponding built-in population in Simcyp Simulator to perform simulations. Thus, a PBPK model for Asian children with impaired renal function was developed. Final models were developed with the following processes: initial model development, verification and optimization. The lag time before absorption was modified in the optimization process. When clinical data obtained from the published literature were plotted with the simulated results, it was well-fitted within the simulation results of healthy and moderate renal impairment populations.
In addition, the coefficients of variation (CV) of observed and simulated Cmax,ss and AUCτ,ss were compared to assess the predictive performance of variability. The CV of Cmax,ss for the PBPK model was 52–53% which were slightly higher than the CV obtained from observed data (45%). However, the CV for AUCτ,ss was 92–93% which was highly overestimated when compared to the observed data (39%). The overestimation of variability in exposure could be a limitation of this PBPK model.
Furthermore, simulations with the PBPK models were conducted to assess the net influence of ethnicity and age with the disease. Slightly lower Cmax,ss and higher AUCτ,ss in Asian children compared to Caucasian children were observed. Polymorphisms of the CYP3A isozyme are known to be related to the PK of the drug. Little inter-ethnic variability of the CYP3A polymorphism between Asians and Caucasians may explain the simulation results.[24] The age effect on the PK of CsA differed between healthy and renal impairment populations. In populations with severe renal impairment, the Cmax,ss and AUCτ,ss were both higher for children than adults, whereas healthy and moderate renally impaired children demonstrated lower AUCτ,ss than healthy adults. It could be interpreted that the effect of severe renal impairment on CsA exposure is higher in children. Further clinical investigation is required to prove this hypothesis.
To our knowledge, there are limited publications or guidance on designing PBPK simulations, including the number of subjects and trials with PBPK simulations. In the validation procedure, we used the same number of subjects with observed data. For simulations examining the contribution of ethnicity, age, and disease to PK variability, the number of subjects and trials was determined considering the real-world clinical trial design. A total of 100 virtual subjects were created for each simulation as follows: 10 trials with 10 subjects per trial.
There were several limitations in this study. First, the ‘Asian’ population in this study needs to be more specific because Asian covers a broad spectrum of populations. However, there has been no available data for pediatric PBPK population model except Japanese. We defined our model as Asian because it was developed using two ethnic groups Japanese and Korean. Therefore, our population model could be more appropriate to the East Asian population. Second, the observed data used for validation did not contain individual GFR values. Visual inspection was consistent with that observed data were obtained from children with mean GFRs higher than 90 mL/min/1.73 m2. Clinical data with individual GFR values may enable more quantitative verification of the PBPK model. In addition, the relevance of physiological parameters modified for the newly developed PBPK model needs to be qualified by previous studies. For instance, albumin and total plasma protein levels increase from birth to 3 years. It causes alteration of unbound concentration of CsA (plasma binding>95%) and may affect the drug effect.[2526] The change of plasma drug binding during maturation reported in recent literature was not reflected in the PBPK models in this study. For a more convincing model, however, considering quantitative physiological information is essential. Third, all of the simulation concentrations were plasma concentrations that are default in the simulator. However, the observed clinical data[20] were whole blood concentrations in the verification process. Considering that blood concentrations of cyclosporine are about 50–60% higher than their plasma values and the GFR of the children population was within normal range, the verification confirmed the healthy population model. Attention should be paid in the interpretation of Figure 1. Lastly, characterizing physiological differences by the ratio of parameters may not reflect the whole precise mechanism of disease progression. Moreover, the Simcyp Simulator uses the same transporter related parameters in both healthy and renal impairment population, which might be unrealistic. Explaining the nonlinear relationship of physiologic conditions only by ratio could be insufficient, especially for the extremes of the population. However, there is no qualified method of parameter adjustment for a specific population in PBPK modeling so far. In this state, multiplying the ratio can be the most straightforward and not much biased approach we can derive. This work has a particular significance in trying this parameter adjustment strategy for the first time and comparing the simulation results with clinical data.
Furthermore, the typical PK profiles obtained from the simulation could be utilized as representative of the specific population. Accordingly, simulation results could support designing early clinical trials, such as a selection of dose and subject number. The PK profile for populations lacking in the built-in library of the Simcyp Simulator could be predicted by applying a parameter adjustment strategy used in this study. This strategy enabled identification of the net effect of several coexisting physiologic conditions by integrating into a single model. Ethical and practical issues, which are considerable in conducting clinical trials, are emphasized in particular patient populations, such as pediatric patients. Modeling and simulation enable the assessment of the mean parameter estimates of the specific populations; thus, it could be highly utilized for populations with difficulties in conducting real-world clinical trials.
In summary, the developed PBPK model of Asian children with renal impairment adequately characterized the PK profiles of CsA. Simulations with populations categorized by ethnicity, age, and renal function enabled the assessment of PK differences between each population. This model may be a useful tool to predict the PK of CsA and support dose adjustment or other relevant decision-making in clinical settings.
 XML Download