Abstract
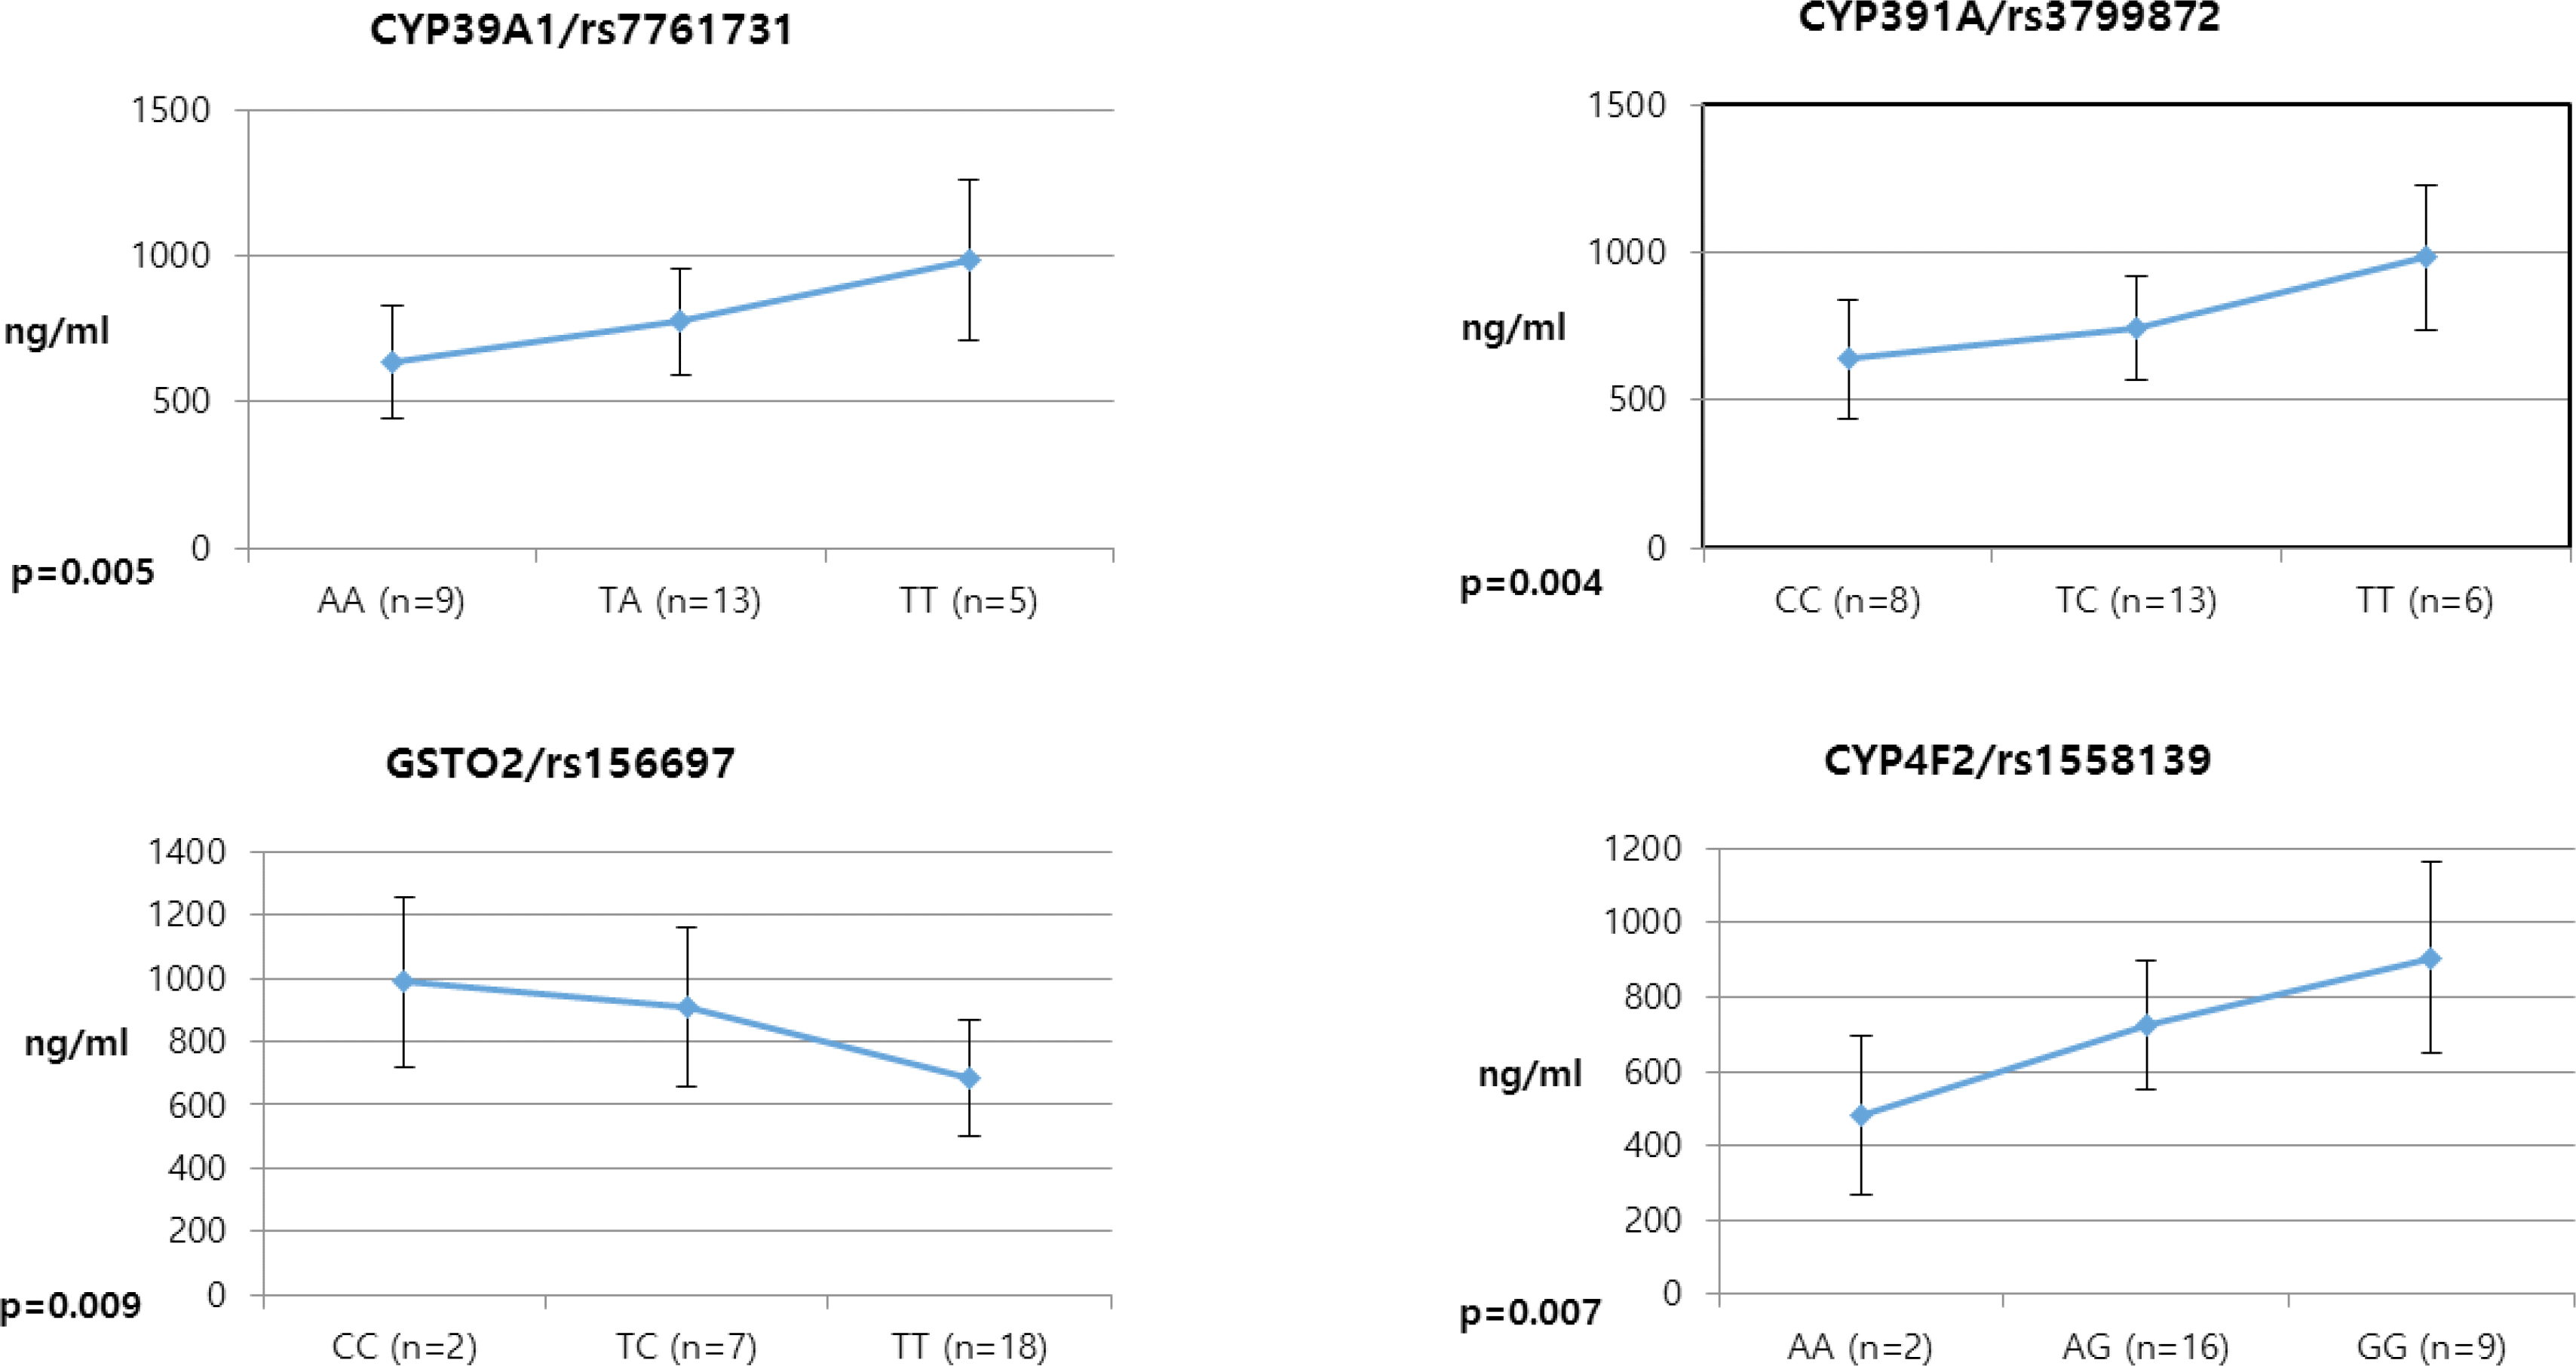
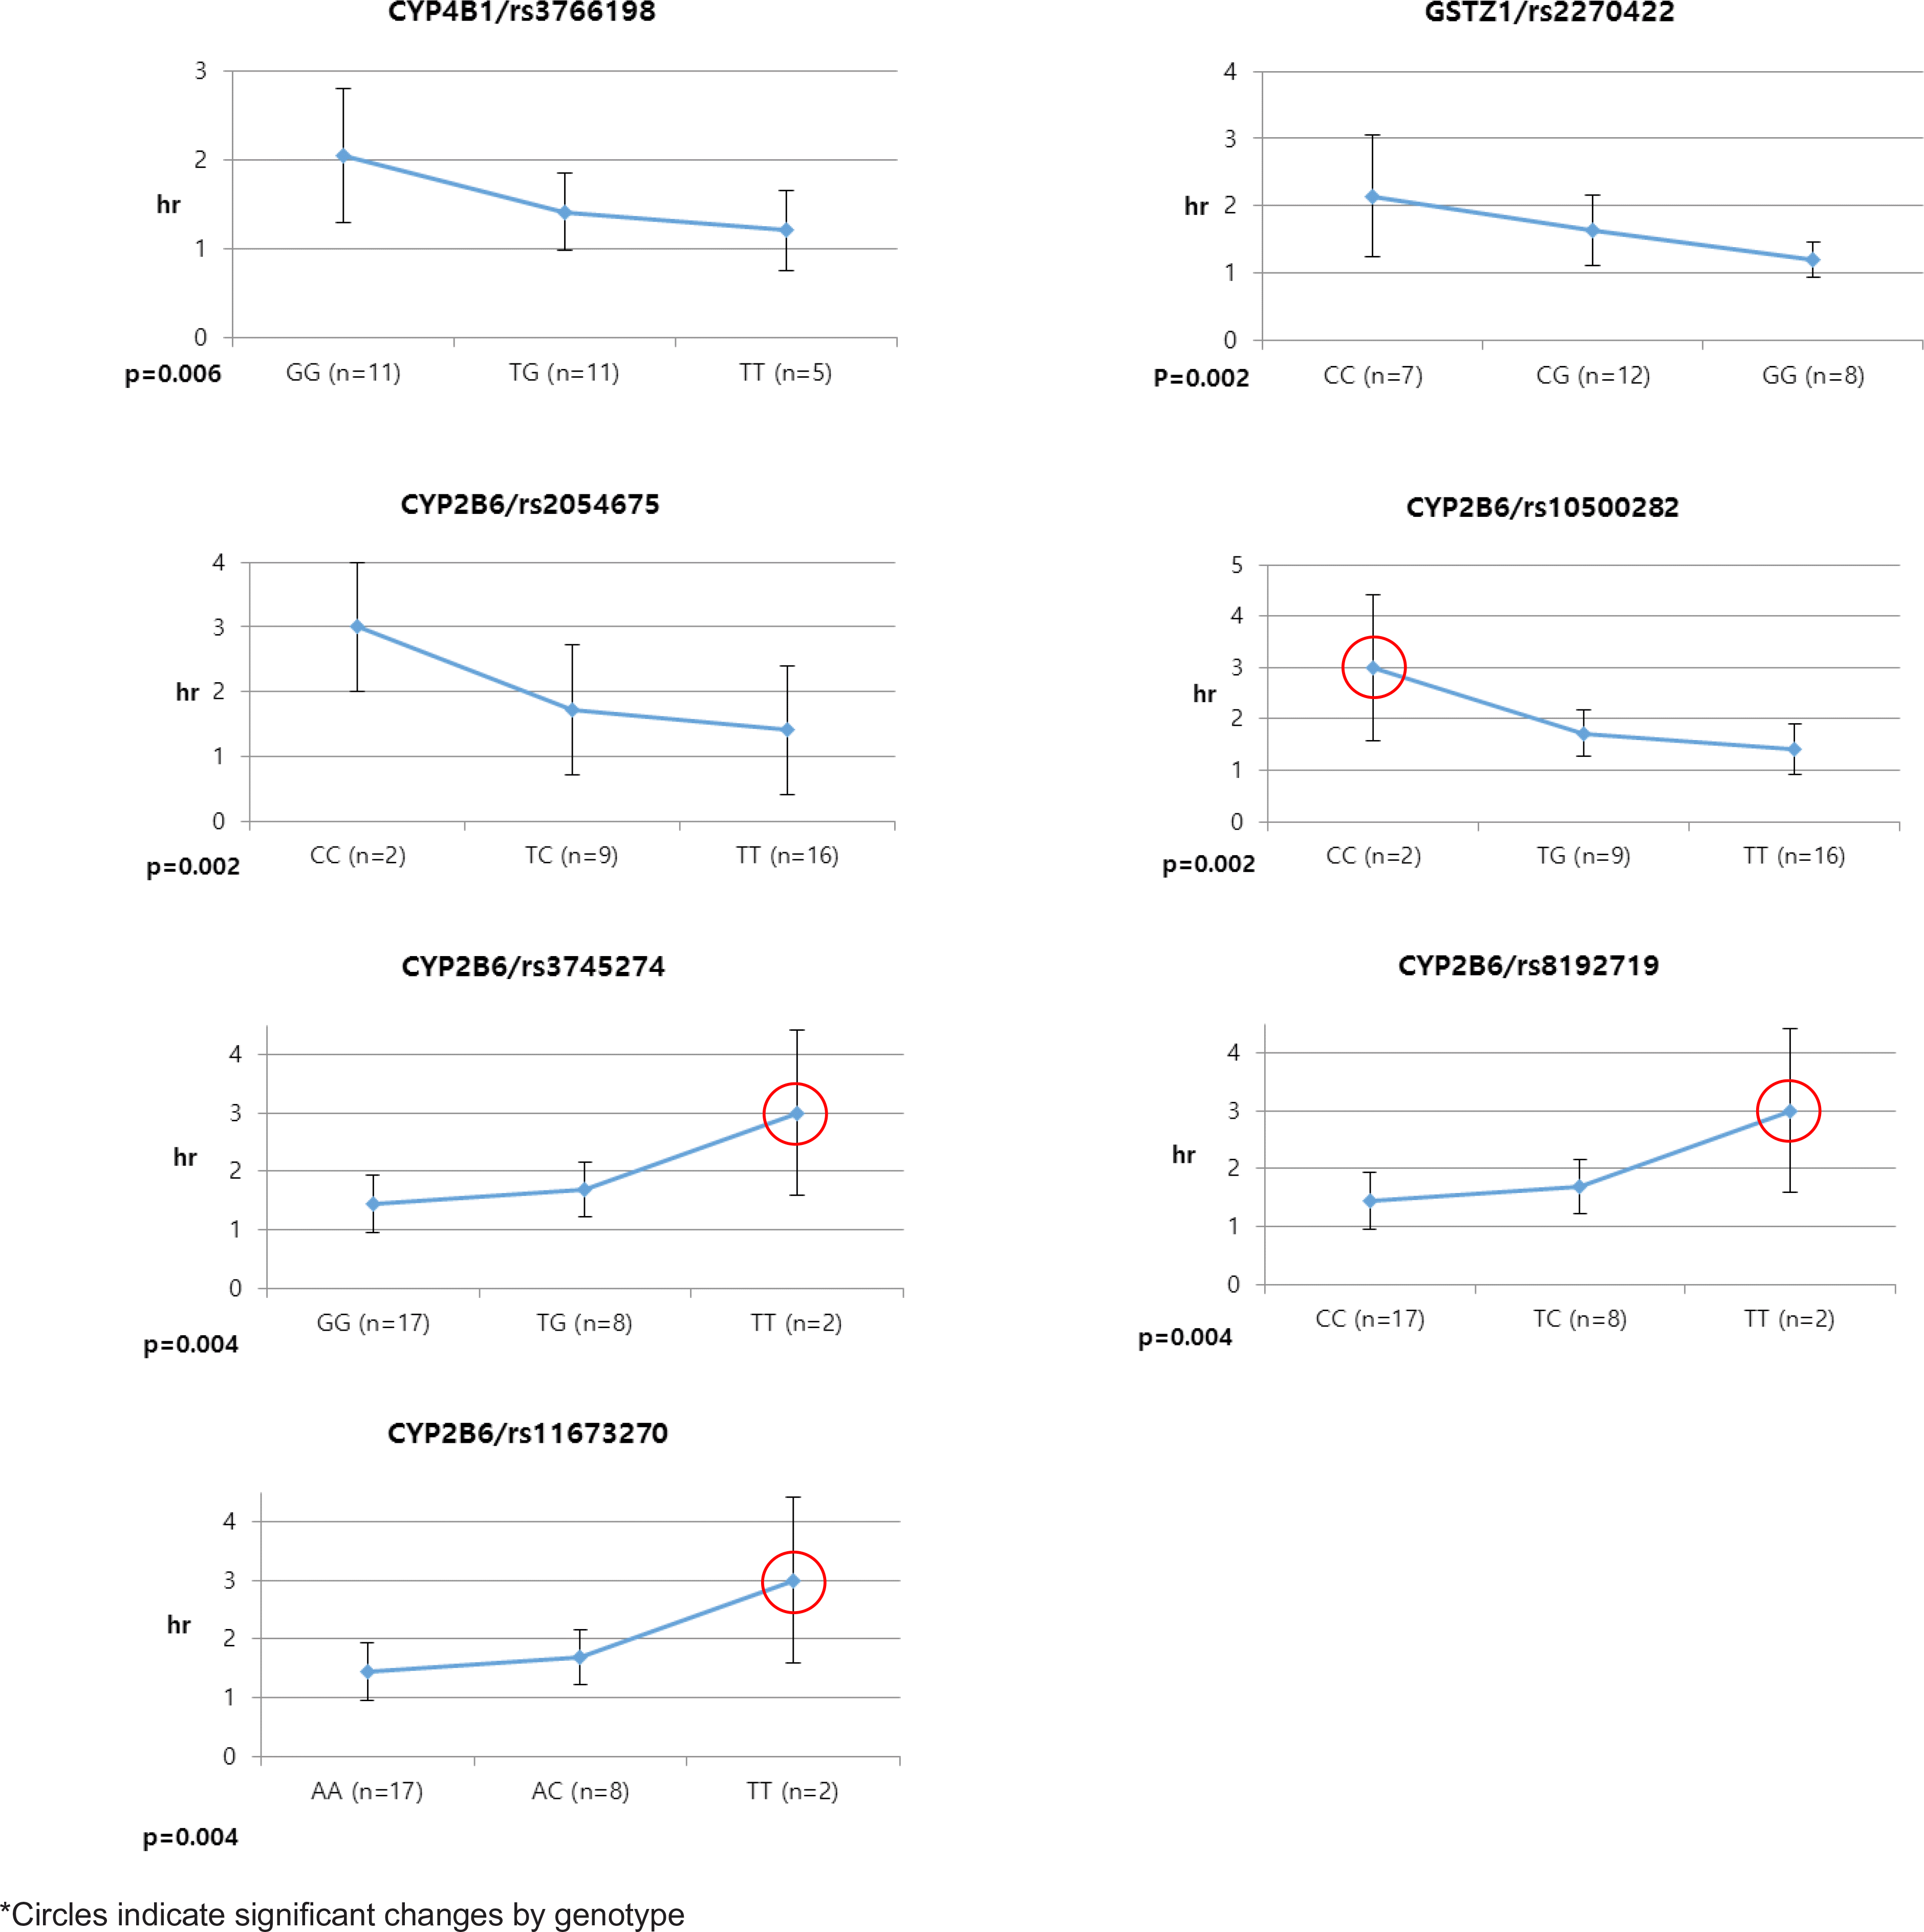
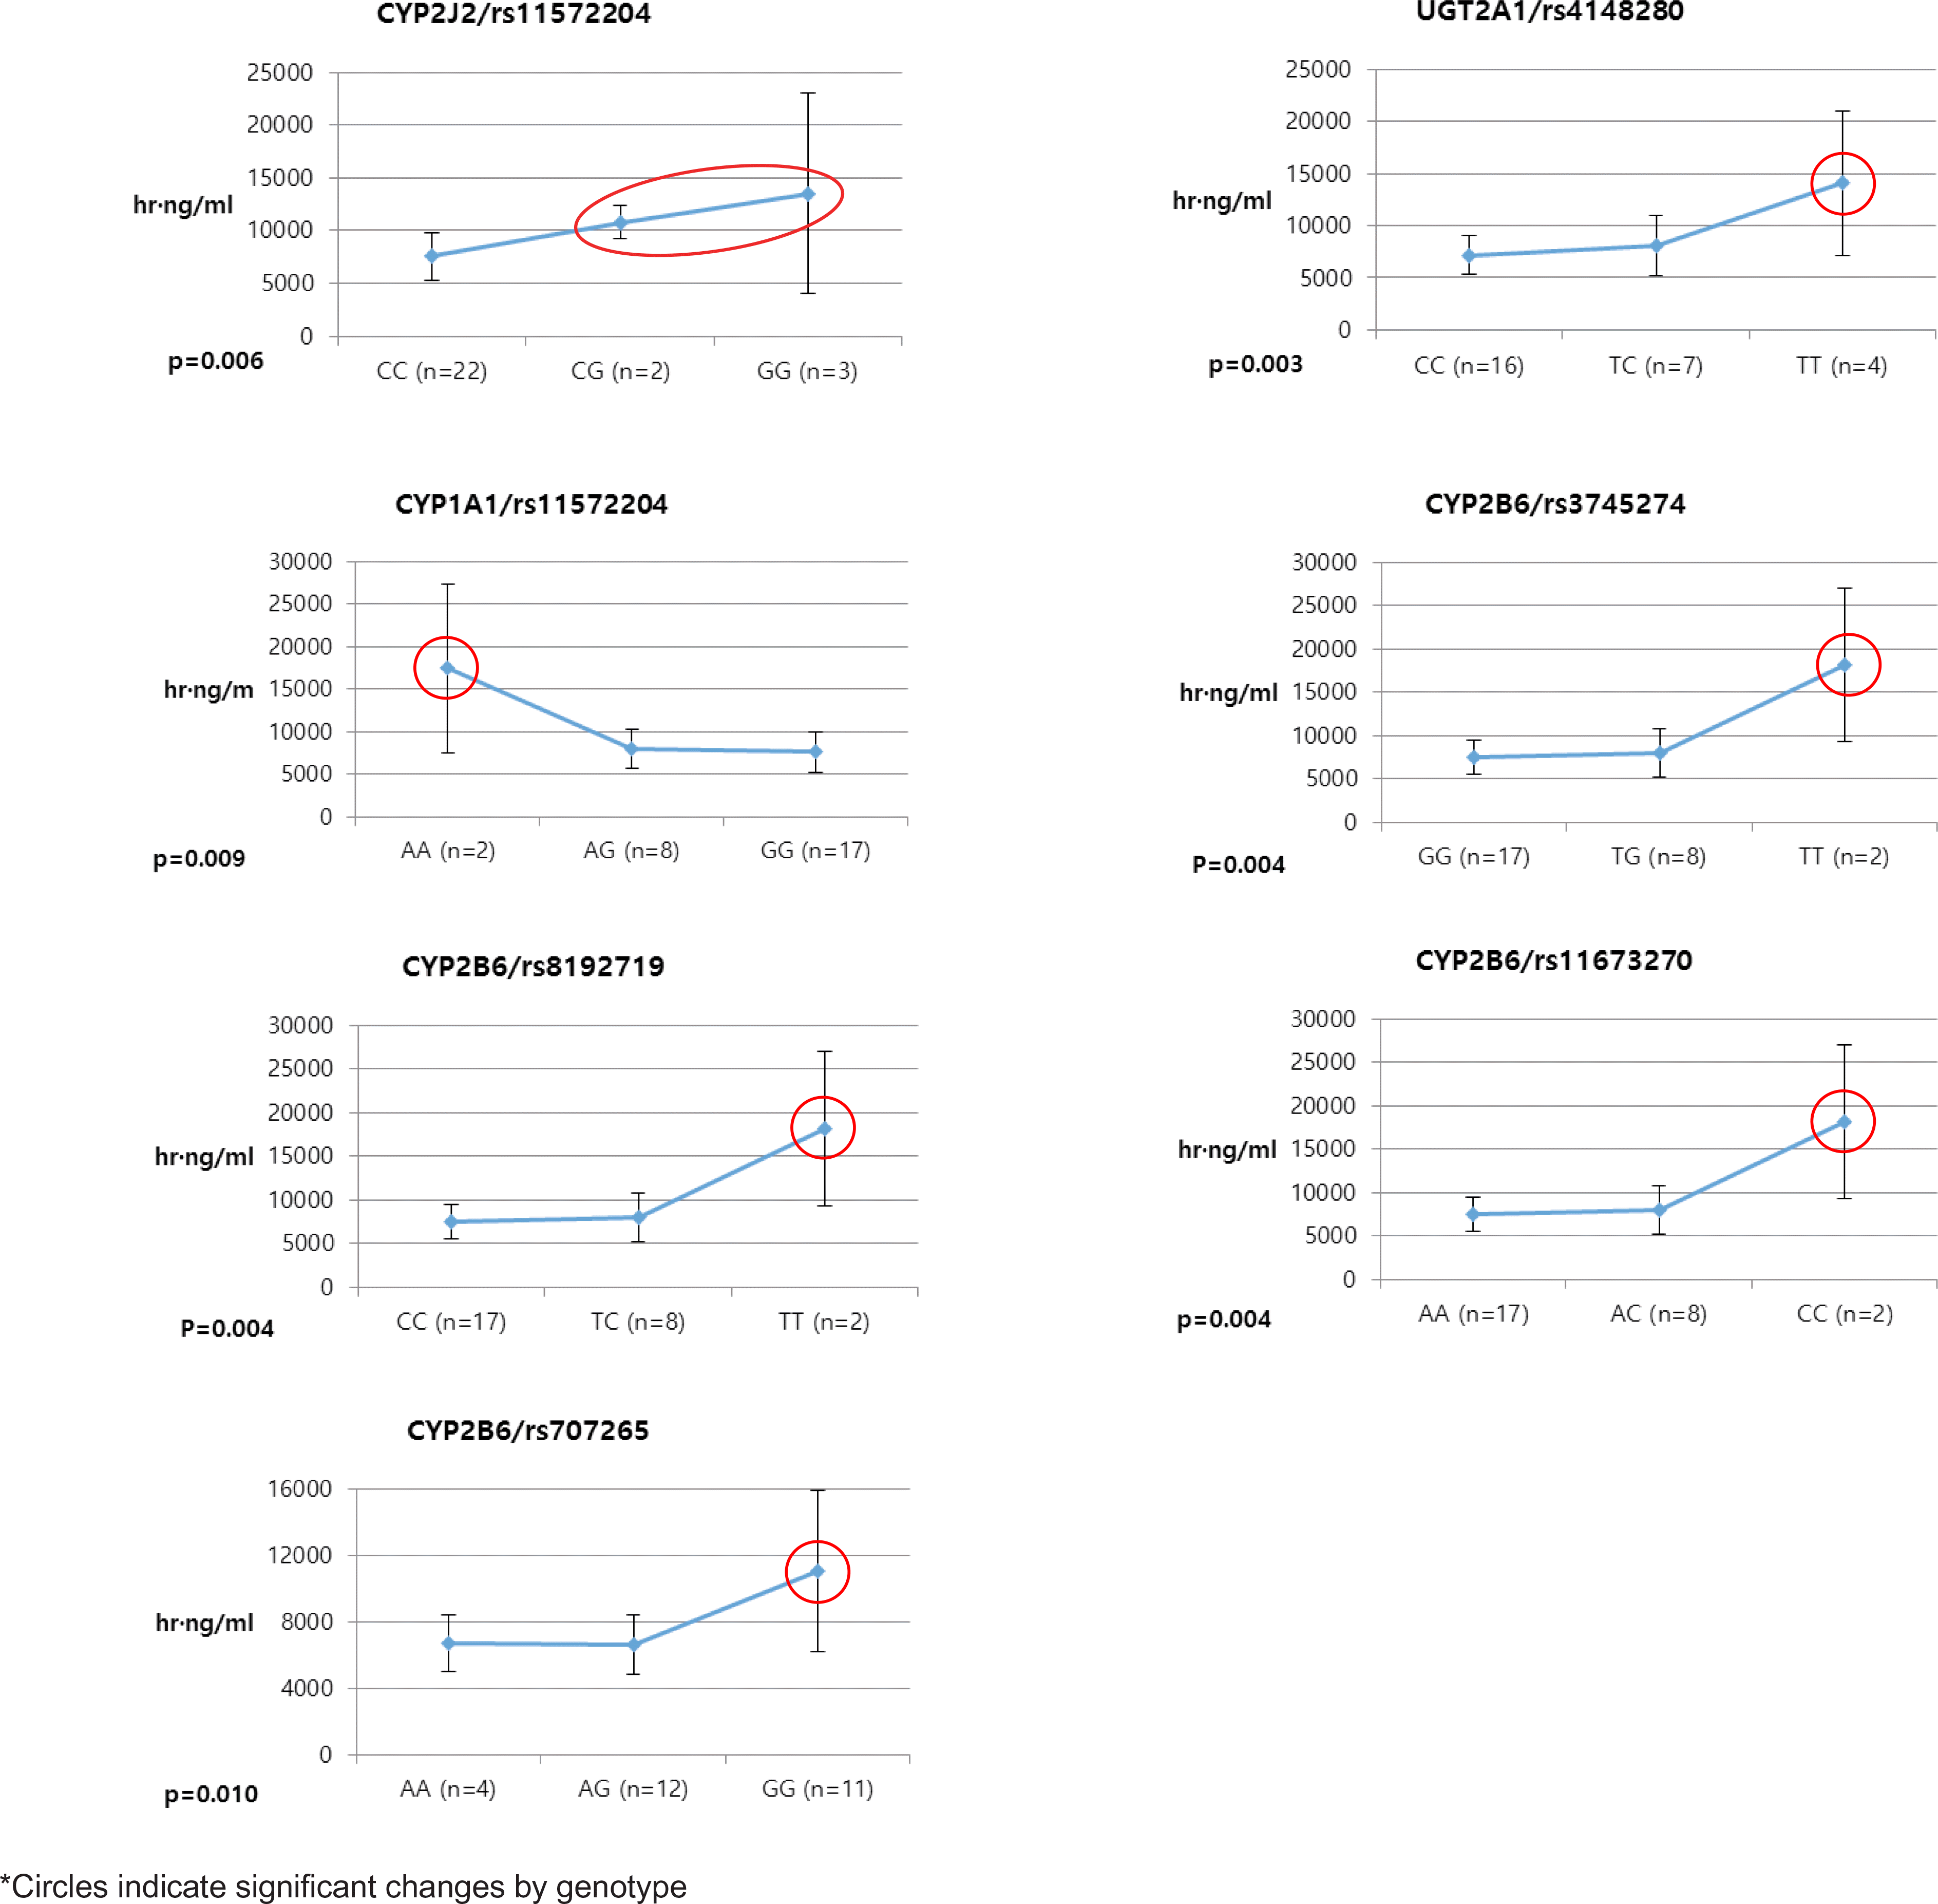
Pioglitazone is known to have antidiabetic effects through decreasing peripheral, hepatic and vascular insulin resistance by the stimulation of PPAR gamma. To address the possible genetic factors affecting the pharmacokinetics (PK) of pioglitazone, 27 male Korean volunteers were enrolled from two separate bioequivalence studies. Each subject was administered 15 mg pioglitazone and reference drug PK parameters were used. We used Illumina Human610 Quad v1.0 DNA Analysis BeadChip for whole genome SNPs analysis and whole genome genotyping data was processed by linear regression analysis for PK parameters. We found 35 significant SNPs (P < 0.0001) in Cmax, 1,118 significant SNPs (P < 0.0001) in Tmax and 1,259 significant SNPs (P < 0.0001) in AUCinf from whole genome analysis. For clinical pharmacological purpose, we selected SNPs from several phase I and II drug metabolizing enzyme and analyzed PK parameters with genotypes. Four SNPs (rs7761731 and rs3799872 from CYP39A1; rs156697 from GSTO2; rs1558139 from CYP4F2) showed significant associations with pioglitazone Cmax. In the Tmax group, seven SNPs from 3 genes (rs3766198 from CYP4B1; rs2270422 from GSTZ1; rs2054675, rs10500282, rs3745274, rs8192719, and rs11673270 from CYP2B6) had significant associations. In the AUCinf group, seven SNPs from 4 genes (rs11572204 from CYP2J2; rs4148280 from UGT2A1, rs4646422 from CYP1A1; rs3745274, rs8192719, rs11673270, and rs707265 from CYP2B6) showed significant associations with pioglitazone absorption. These results showed that genetic makeup could affect the PK parameters and these informations could be provide information for personalized pioglitazone therapy.
REFERENCES
1.Gardiner SJ., Begg EJ. Pharmacogenetics, drug-metabolizing enzymes, and clinical practice. Pharmacol Rev. 2006. 58:521–590.

2.Iyer KR., Sinz MW. Characterization of Phase I and Phase II hepatic drug metabolism activities in a panel of human liver preparations. Chem Biol Interact. 1999. 118:151–169.

3.Zhou SF., Di YM., Chan E., Du YM., Chow VD., Xue CC, et al. Clinical pharmacogenetics and potential application in personalized medicine. Curr Drug Metab. 2008. 9:738–784.

4.Riva A., Kohane IS. A web-based tool to retrieve human genome polymorphisms from public databases. Proc AMIA Symp. 2001. 558–562.
5.Voisey J., Morris CP. SNP technologies for drug discovery: a current review. Curr Drug Discov Technol. 2008. 5:230–235.

6.Yokota H., Satoh Y., Ono Y., Kaneko M., Ikeda H., Tsuji S, et al. Establishment of a pharmacogenomics testing system for the realization of individual pharmacotherapy. Rinsho Byori. 2008. 56:772–780.
7.Qi N., Kazdova L., Zidek V., Landa V., Kren V., Pershadsingh HA, et al. Pharmacogenetic evidence that cd36 is a key determinant of the metabolic effects of pioglitazoneJ. J Biol Chem. 2002. 277:48501–48507.
8.Manitpisitkul P., Curtin CR., Shalayda K., Wang SS., Ford L., Heald D. Pharmacokinetic interactions between topiramate and pioglitazone and metformin. Epilepsy Res. 2014. 108:1519–1532.

9.Im SH., Kim BH., Lee KD., Kwack KB., Yim SV. Screening study for genetic polymorphsims affecting pharmacokinetics of simvastatin. Transl Clin Pharmacol. 2016. 24:43–54.
10.Pittas AG., Greenberg AS. Thiazolidinediones in the treatment of type 2 diabetes. Expert Opin Pharmacother. 2002. 3:529–540.
11.Priya SS., Sankaran R., Ramalingam S., Sairam T., Somasundaram LS. J. Genotype Phenotype Correlation of Genetic Polymorphism of PPAR Gamma Gene and Therapeutic Response to Pioglitazone in Type 2 Diabetes Mellitus-A Pilot Study. Clin Diagn Res. 2016. 10:FC11–14.
12.Yang H., Ye E., Si G., Chen L., Cai L., Ye C, et al. Adiponectin gene polymorphism rs2241766 T/G is associated with response to pioglitazone treatment in type 2 diabetic patients from southern China. PLoS One. 2014. 9:e112480. DOI: doi: 10.1371/journal.pone.0112480.

13.Kawaguchi-Suzuki M., Frye RF. Current clinical evidence on pioglitazone pharmacogenomics. Front Pharmacol. 2013. 26(4):147. DOI: doi: 10.3389/fphar.2013.001 47.

14.Aquilante CL., Kosmiski LA., Bourne DW., Bushman LR., Daily EB., Hammond KP, et al. Impact of the CYP2C8 ∗3 polymorphism on the drug-drug interaction between gemfibrozil and pioglitazone. Br J Clin Pharmacol. 2013. 75:217–226. DOI: doi: 10.1111/j.1365-2125.2012.04343.x.
15.Tornio A., Niemi M., Neuvonen PJ., Backman JT. Trimethoprim and the CY-P2C8∗3 allele have opposite effects on the pharmacokinetics of pioglitazone. Drug Metab Dispos. 2008. 36:73–80.

16.Kalliokoski A., Neuvonen M., Neuvonen PJ., Niemi M. No significant effect of SLCO1B1 polymorphism on the pharmacokinetics of rosiglitazone and pioglitazone. Br J Clin Pharmacol. 2008. 65:78–86.
17.Uesugi M., Masuda S., Katsura T., Oike F., Takada Y., Inui K. Effect of intestinal CYP3A5 on postoperative tacrolimus trough levels in living-donor liver transplant recipients. Pharmacogenet Genomics. 2006. 16:119–127.

18.Li-Hawkins J., Lind EG., Bronson AD., Russell DW. Expression cloning of an oxysterol 7 ahydroxylase selective for 24-hydroxycohlesterol. J Biol Chem. 2000. 275:16543–16549.
19.Shafaati M., O'Driscoll R., Björkhem I., Meaney S. Transcriptional regulation of cholesterol 24-hydroxylase by histone deacetylase inhibitors. Biochem Biophys Res Commun. 2009. 378:689–694. DOI: doi: 10.1016/j.bbrc.2008.11.103.

20.Whitbread AK., Tetlow N., Eyre HJ., Sutherland GR., Board PG. Characterization of the human omega class glutathione transferase genes and associated polymorphisms. Pharmacogenetics. 2002. 13:131–144.

21.Tanaka-Kagawa T., Jinno H., Hasegawa T., Makino Y., Seko Y., Hanioka N, et al. Functional characterization of two variant human GSTO1-1s (Ala140Asp and Thr217Asn). Biochem Biophys Res Commun. 2003. 301:516–520.
22.Caldwell MD., Awad T., Johnson JA., Gage BF., Falkowski M., Gardina P, et al. CYP4F2 genetic variant alters required warfarin dose. Blood. 2008. 111:4106–4112. DOI: doi: 10.1182/blood-2007-11-122010.

23.Hsu MH., Savas U., Griffin KJ., Johnson EF. Regulation of human cytochrome P450 4F2 expression by sterol regulatory element-binding protein and lovastatin. J Biol Chem. 2007. 282:5225–5236.

24.Turpeinen M., Raunio H., Pelkonen O. The functional role of CYP2B6 in human drug metabolism: substrates and inhibitors in vitro, in vivo and in silico. Curr Drug Metab. 2006. 7:705–714.

25.Sorkness CA. Traditional and new approaches to asthma monitoring. Respir Care. 2008. 53:593–599. discussion 599-601.
Table 1.
Demographic characteristics and reference pioglitazone pharmacokinetics parameters of volunteers
Abbreviation: M, male; F, female; Cmax, maximum measured plasma concentration; Tmax, time of the maximum measured plasma concentration; AUCt, area under the plasma concentration-time curve from time zero to time of last measurable concentration; AUCinf, area under the plasma concentration-time curve from zero to infinity; SD, standard deviation.
Table 2.
Summary of regression analysis
| N | ||
|---|---|---|
| Cmax | P <0.0001 | 35 |
| 0.0001 ~ <0.001 | 468 | |
| <0.01 | 5,089 | |
| Tmax | P <0.0001 | 1,118 |
| 0.0001 ~ <0.001 | 527 | |
| 0.001 ~ <0.01 | 4,541 | |
| AUCinf | P <0.0001 | 1,259 |
| 0.0001 ~ <0.001 | 1,140 | |
| 0.001 ~ <0.01 | 5,098 |
Table 3.
Selected SNPs of Phase I and II drug metabolizing enzymes in Cmax group from linear regression analysis
| Marker | Chr. | Location | Gene | Genotype | N | Mean | Stdev. | P |
|---|---|---|---|---|---|---|---|---|
| rs7761731 | 6 | missense | CYP39A1 | AA | 9 | 636.091 | 190.301 | 0.005∗∗ |
| TA | 13 | 775.532 | 181.510 | |||||
| TT | 5 | 982.968 | 275.762 | |||||
| rs3799872 | 6 | intron | CYP39A1 | CC | 8 | 639.504 | 203.146 | 0.004∗∗ |
| TC | 13 | 746.211 | 174.641 | |||||
| TT | 6 | 984.135 | 246.665 | |||||
| rs156697 | 10 | missense | GSTO2 | CC | 2 | 987.680 | 269.563 | 0.009∗∗ |
| TC | 7 | 910.693 | 251.258 | |||||
| TT | 18 | 687.298 | 183.096 | |||||
| rs1558139 | 19 | intron | CYP4F2 | AA | 2 | 483.500 | 213.999 | 0.007∗∗ |
| AG | 16 | 725.477 | 171.676 | |||||
| GG | 9 | 905.217 | 257.265 |
Table 4.
Selected SNPs of Phase I and II drug metabolizing enzymes in Tmax group from linear regression analysis
Table 5.
Selected SNPs of Phase I and II drug metabolizing enzymes in AUCinf group from linear regression analysis


 PDF
PDF ePub
ePub Citation
 Print
Print


 XML Download