Abstract
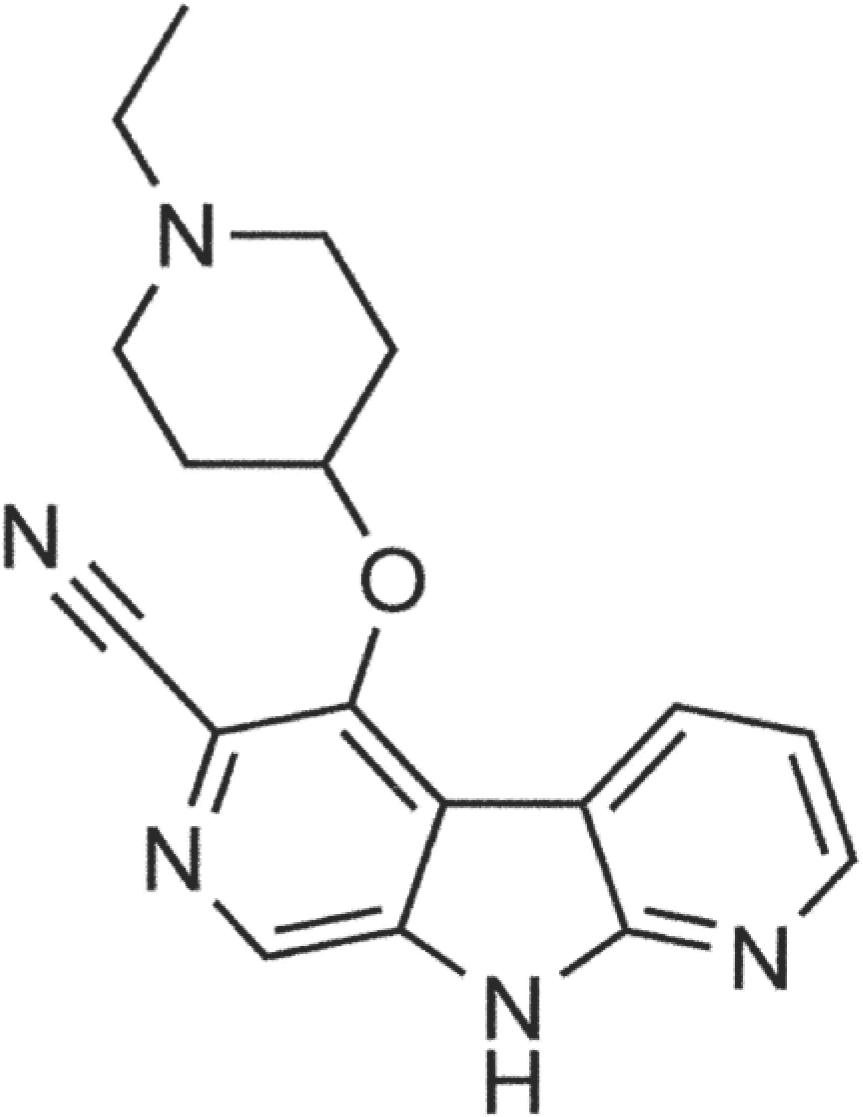
The development and validation of a method for the determination of concentrations of thiocyanate in human plasma are described here. A modified colorimetric method of Bowler was used with the following alteration in Monica Manual, Part III. In order to obtain the same sensitivity in low amounts of clinical samples, quartz SUPRASIL® micro cuvettes have been used. The quantitation range was between 25–500 M. Accuracy and precision of the quality control samples, linearity of the calibration curve, dilution, spike recovery and stability under various conditions were evaluated in the validation of the method and all demonstrated acceptable results. All validation results met good laboratory practice acceptance and FDA requirements to be acceptable for application in clinical trials. The validated method has been used for a Phase I clinical study in cancer patients orally administered with either 60 mg or 80 mg of GDC-0425 containing a cyanide (CN-) group. The thiocyanate levels from patients before and after drug administration showed no clinically significant differences.
References
1. Olea F, Parras P. Determination of serum levels of dietary thiocyanate. J Anal Toxicol. 1992; 16:258–260.

2. Foss OP, Lund-Larsen PG. Serum thiocyanate and smoking: interpretation of serum thiocyanate levels observed in a large health study. Scand J Clin Lab Invest. 1986; 46:245–251.

3. Zil R, Rahman MA. Serum thiocyanate levels in smokers, passive smokers and never smokers. J Pak Med Assoc. 2006; 56:323–326.
4. Scherer G. Carboxyhemoglobin and thiocyanate as biomarkers of exposure to carbon monoxide and hydrogen cyanide in tobacco smoke. Exp Toxicol Pathol. 2006; 58:101–124.

5. Viswanathan CT, Bansal S, Booth B, DeStefano A J, Rose M J, Sailstad J, et al. Quantitative bioanalytical methods validation and implementation: best practices for chromatographic and ligand binding assays. Pharm Res. 2007; 24:1962–1973.

6. Lundquist P, Martensson J, Sorbo B, Ohman S. Method for determining thiocyanate in serum and urine. Clin Chem. 1979; 25:678–681.

7. Lundquist P, Kågedal B, Nilsson L. An improved method for determination of thiocyanate in plasma and urine. Eur J Clin Chem Clin Biochem. 1995; 33:343–349.

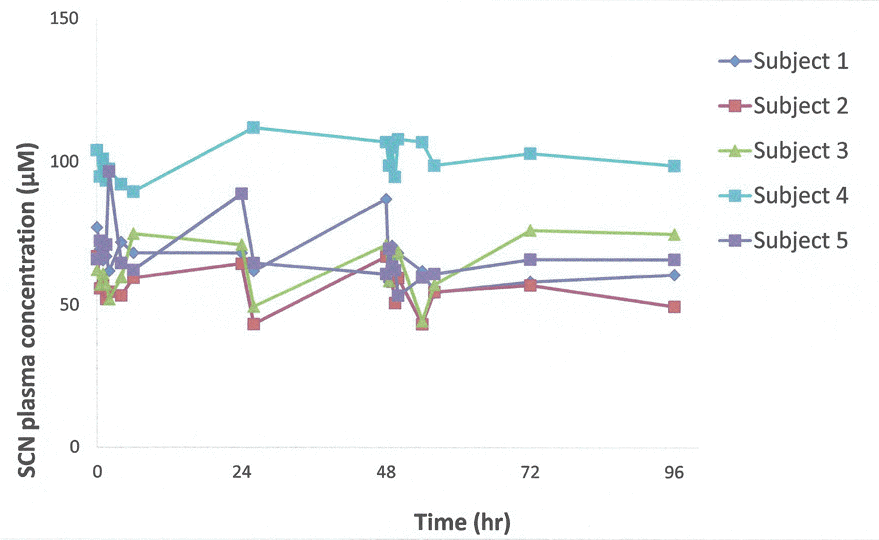
Figure 2.
Data from patients treated with GDC-0425 show that post-dose thiocyanate levels were comparable to baseline (pre-dose) levels∗.

Table 1.
Calibration curve parameters for SCN−
Table 2.
Reproducibility and repeatability (accuracy (%bias) and precision (CV%)) of QC samples
Table 3.
Stability tests of thiocyanate in artificial and K2-EDTA plasma and processed samples (n=3)
| Stability Item | Matrix | Notes | Mean Accuracy (%bias) | ||||
|---|---|---|---|---|---|---|---|
| LLOQ | QC Low | QC Med | QC High | ||||
| Freeze-thaw | –20oC | K2-EDTA plasma | 4 cycles | – | –3.5 | – | –4.8 |
| –70oC | K2-EDTA plasma | 4 cycles | – | –7.7 | – | –4.2 | |
| Short-term | room temperature | K2-EDTA plasma | 24 hours | – | 16.9 | – | 3.4 |
| 2–8oC$ | K2-EDTA plasma | 1 day | – | –15.1 | – | –3.7 | |
| Artificial plasma | 3 days | 16.0 | 8.1 | –3.7 | –5.4 | ||
| Long-term | –20oC | K2-EDTA plasma | 31 days | – | 11.1 | – | 4.8 |
| –70oC | K2-EDTA plasma | 190 days | – | 6.2 | – | 2.7 | |
| 2–8oC | Artificial plasma | 4 days | – | 4.4 | – | 1.1 | |
| Process stability# dark | K2-EDTA plasma | 4 hours | – | –12.6 | – | –0.6 | |
| Artificial plasma | 4 hours | – | 8.1 | – | –0.5 | ||
| Process stability# day light | K2-EDTA plasma | 2.5 hours | – | –3.9 | – | 0.8 | |
| Artificial plasma | 4 hours | – | –7.9 | – | –4.5 | ||


 PDF
PDF ePub
ePub Citation
 Print
Print


 XML Download