

 PDF
PDF ePub
ePub Citation
 Print
Print


Skin inflammation, the most common problem in dermatology, is characterized by a rash, itching and redness caused by ultraviolet (UV) radiation, allergens and chemical irritants in acute cases or dermatitis, rosacea, seborrheic dermatitis and psoriasis results in response to inflammation mediated by a sustained immune response [12]. Although the mechanism of skin inflammation is not fully understood, amplification of a complex and large inflammatory response was triggered by a variety of inflammatory hormones known as cytokines and chemokines [3]. Among these hormones, TNF-α is considered a key target cytokine in immune cells recruitment and activation [4]. Therefore, the identification and development of immune suppressive compounds with the ability to target and inhibit the action of inflammatory cytokines has received a great deal of attention from several study groups [56].
The most effective and common drugs used to treat skin inflammation are corticosteroids. The oral administration and topical application of these hormones effectively alleviate the symptoms of eczema, atopic dermatitis, allergic contact dermatitis, seborrheic dermatitis and psoriasis; however, they exert negative side effects such as anti-proliferative effects, generalized immunosuppression and hyperglycemia [7]. To overcome this issue, botanically-derived antioxidants including curcumin, quercetin, resveratrol, epigallocatechin gallate and bisabolol with high anti-inflammatory activities have been investigated in vivo and in vitro [89101112]. Several studies have suggested that natural products can be used to suppress skin inflammation. Fenugreek (Trigonella foenum-graecum L.) was found to reduce allergic inflammatory disease induced by 2–5% trimellitic anhydride (TMT) [13]. Moreover, aqueous extract of Liriope platyphylla (AEtLP) and fermented soybean products effectively suppressed the luciferase signal, ear thickness, IgE concentration, mast cells infiltration and inflammatory cytokine expression [1415].
Among many natural products, A. cochinchinensis, which is widely distributed in China, Japan and Korea, has long been considered a candidate for suppression of skin inflammation [16]. The root of this plant has been shown to have various therapeutic properties including antioxidant, anti-aging [171819], antibacterial-antiinflammatory [17] and antitumor effects [202122], as well as the ability to reduce blood sugar [23] and improve cough [2425]. Furthermore, it has been used in combination with other herbs as a medicine to treat the disease of lungs, spleen, immune system and aging [2627]. Some studies have provided scientific evidence of the anti-inflammatory activity of A. cochinchinensis extract and functional compounds including 19 amino acids, polysaccharides, and more than 20 multi-functional compounds [282930313233343536373839]. The enhancement of cytokines secretion and nitric oxide (NO) production after lipopolysaccharide (LPS) and substance P stimulation was significantly inhibited by A. cochinchinensis extract in astrocytes and microglial cells [40]. Moreover, ethanol extract from A. cochinchinensis greatly decreased the degree of ectopic edema, ear thickness, cytokine secretion and myeloperoxidase activity, which are considered indicators of skin inflammation progression, in a skin inflammation-induced mouse model treated with 12-O-tetradecanoylphorbol-13-acetate [41]. However, the therapeutic effects of ethyl acetate extracts of A. cochinchinensis (EaEAC) were not investigated in the skin inflammation induced by phthalic anhydride (PA) treatment. There have also been no reports of the systemic role of IL-4 during antiinflammatory activity of A. cochinchinensis because the above studies did not provide evidence of the correlation between IL-4 and administration of EaEAC.
In this study, we investigated the suppressive effects of long term EaEAC treatment on PA-induced skin inflammation using IL-4/Luc/CNS-1 transgenic (Tg) mice with luciferase (Luc) cDNA under the regulation of human IL-4 promoter and enhancer of IL-4 (CNS-1). The results showed that EaEAC can relive the symptoms of skin inflammation induced by PA treatment, and that the suppression of EaEAC in PA-induced skin inflammation may be correlated with IL-4 function.
Materials and Methods
Preparation of EaEAC
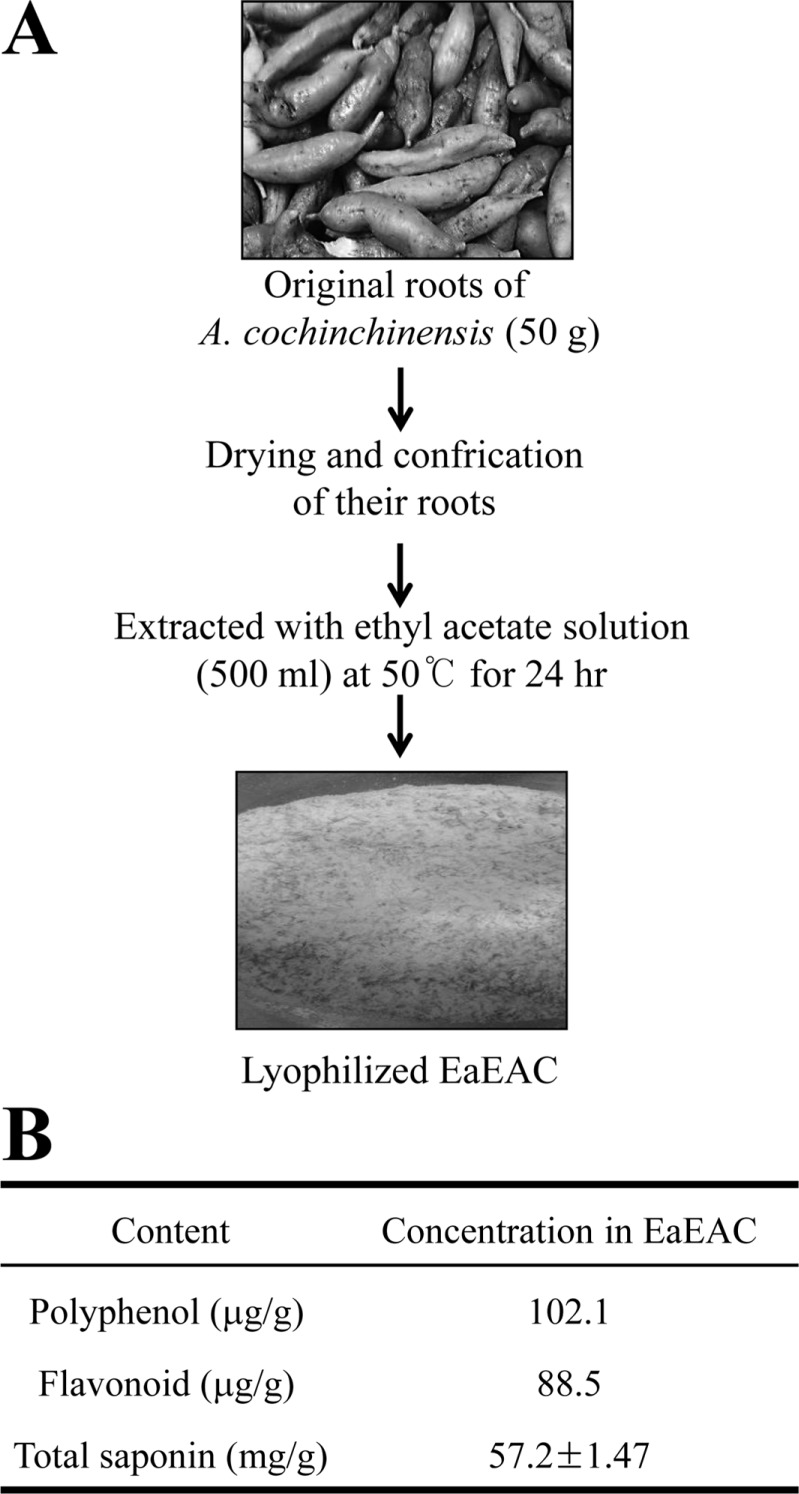
The roots of A. cochinchinensis used in this study were harvested from plantations in the Go-Chang area in Korea and dried in a drying machine (FD5510S-FD5520S, Ilshinbiobase Co., Dongducheon, Korea) at 60℃. Voucher specimens of A. cochinchinensis (WPC-14-003) were deposited in the functional materials bank of the PNU-Wellbeing RIS Center at Pusan National University. Dried roots of A. cochinchinensis were reduced to powder using a pulverizer (MF-3100S, Hanil Electric Co., Seoul, Korea), after which EaEAC was obtained at 50℃ for 24 h in a fixed liquor ratio (solid powder of A. cochinchinensis/ethyl acetate solvent ratio, 1:10) using circulating extraction equipment (SHWB-30/45, Woori Science Instrument Co., Pocheon, Korea). These solutions were subsequently passed through a 0.4 µm filter, after which they were concentrated by vacuum evaporation and lyophilization using circulating extraction equipment (IKA Labortechnik, Staufen, Germany) (Figure 1A). Finally, the collected EaEAC powder was dissolved in 0.5% Tween 20 Solution (in dH2O) to 400 mg/kg, then further diluted to the required concentration.
Determination of total saponin, total polyphenolic and flavonoid contents
Polyphenolic contents in EaEAC were measured by the Folin-Ciocalteu method as previously described [42]. Briefly, a mixture of EaEAC solution (1 mL) and Folin-Ciocalteu reagent (5 mL, Sigma-Aldrich Co., St. Louis, MO, USA) was incubated at room temperature for 5 min. The mixture was subsequently added to 15 mL of 20% Na2CO3 and vortexed for 30 sec, after which the absorbance was repeatedly measured at 765 nm using a Versa-max plate reader (Molecular Devices, Sunnyvale, CA, USA). A standard calibration curve was made using different concentrations of gallic acid (Sigma-Aldrich Co.), and the concentration of polyphenolic contents in EaEAC was presented as mg gallic acid equivalent of extract.
The flavonoid contents were measured as previously described [43]. Briefly, 200 µL of several different concentrations of EaEAC were mixed with 60 µL of 5% NaNO2 (Sigma-Aldrich Co.) and 60 µL of 10% AlCl3 (Sigma-Aldrich Co.). Following incubation at 25℃ measured as previously described [43]. A standard calibration curve was then made using different concentrations of catechin (Sigma-Aldrich Co.). The flavonoid contents in EaEAC are presented as mg catechin equivalent of extract.
Total saponins content was measured by the Helaly method as previously described [44]. The extract of n-butanol was redissolved in 0.5 mL of 80% MeOH, then mixed with 0.5 mL of 8% vanillin in ethanol and 5 mL of 72% H2SO4 in water. These mixtures were placed in a 60℃ water bath for 20 min, then cooled at 0℃ for 5 min, after which the absorbance was measured at 544 nm using a Versa-max plate reader (Molecular Devices). The saponin content was calculated from a calibration curve constructed using purified saponin standard (Sigma Sigma-Aldrich Co.).
Design of animal experiment and care of IL-4/Luc/CNS-1 Tg mice
IL-4/Luc/CNS-1 Tg mice were kindly provided by the Department of Laboratory Animals Resources at the National Institute of Food and Drug Safety Evaluation (Osong, Korea), and HR1 mice of the same age for mating were purchased from Central Lab Animal Inc. (Seoul, Korea). All mice were provided with ad libitum access to standard irradiated chow (Samtako, Osan, Korea) and autoclaved water throughout the experimental period. Moreover, the mice used in this study were maintained in a specific pathogen-free state under a strict light cycle (lights on at 08:00 hours and off at 20:00 hours) at 23±2℃ and 50±10% relative humidity. The mice were housed in the Pusan National University-Laboratory Animal Resources Center accredited by the Korea Food and Drug Administration (FDA) in accordance with the Laboratory Animal Act (Accredited Unit Number-000231) and AAALAC International according to the National Institutes of Health guidelines (Accredited Unit Number; 001525).
The protocols for the animal experiment used in this study were carefully reviewed for ethical and scientific care procedures and approved by the Pusan National University-Institutional Animal Care and Use Committee (PNU-IACUC; Approval Number PNU-2015-0976). IL-4/Luc/CNS-1 Tg mice (eight-week-old, n=20) were randomly divided into one of two groups. In the first group (AOO, n=5), 100 µL of AOO (4:1 acetone: olive oil, v/v: AOO) was spread on the dorsum of the ears every day for 2 weeks as a control. In the second group (PA, n=15), 100 µL of 15% PA solution in AOO was repeatedly spread on the dorsum of the ears every day for 2 weeks. The second group was further divided into three treatment groups, PA+Vehicle, PA+EaEAC2, and PA+EaEAC4, which received PA in combination with a comparable volume of 0.5% tween 20 solution (in dH2O) and 200 or 400 mg/kg EaEAC, respectively, via oral administration for the same period.
Production and identification of IL-4/Luc/CNS-1 Tg mice
Production and identification of IL-4/Luc/CNS-1 Tg mice were performed as previously described [4546]. Briefly, founder mice were produced by breeding IL-4/Luc/CNS-1 Tg mice and HR1 mice. The IL-4/Luc/CNS-1 transgenes in the founder mice were then identified by DNA-PCR of tail-derived genomic DNA using specific primers. For DNA-PCR, 10 pmol each of sense (5'-CTC GCA TGC CAG AGA TCC TA-3') and antisense (5'-CCA CAA CCT TCG CTT CAA AA-3') primers were added into the genomic DNA template mixture. Amplification was then conducted in a thermal cycler (Perkin-Elmer, Waltham, MA, USA) by subjecting the samples to 25 cycles of 30 sec at 94℃, 30 sec at 62℃, and 45 sec at 72℃. Next, the amplified PCR products were separated by 1% agarose gel electrophoresis, after which the band patterns were detected using a Kodak Electrophoresis Documentation and Analysis System 120 (Eastman Kodak, Rochester, NY, USA).
Observation of ear morphology and measurement of ear thickness
The ear morphology and ear thickness were measured as previously described [1415]. Changes in ear color, ear vein thickness and other morphological characteristics of IL-4/Luc/CNS-1 Tg mice were analyzed using photographs. Additionally, ear thickness was measured to investigate the degree of skin inflammation induced by PA+Vehicle and PA+EaEAC treatment using a thickness gauge (Digimatic Indicator, Matusutoyo Co., Tokyo, Japan).
Measurement of body and lymph node weight
The body weights of all mice were measured throughout the experimental period using an electronic balance (Mettler Toledo, Greifensee, Switzerland). Additionally, lymph nodes were collected from sacrificed mice and weighed using an electronic balance (Mettler Toledo).
Detection of IgE concentration
IgE concentration in the serum of IL-4/Luc/CNS-1 Tg mice was measured using an enzyme-linked immunosorbent assay (ELISA) kit (Shibayagi Inc., Gunma, Japan) according to the manufacturer's instructions. Briefly, serum samples and standards diluted 20 fold with dilution solution (50 µL) were added to wells coated with antibody, after which the plate was incubated for 2 h at room temperature. Next, the wells were washed with washing solution (50 mM Tris, 0.14M NaCl, 0.05% Tween 20, pH 8.0), after which 50 µL of biotin-conjugated avidin was added and the samples were incubated for 2 h. Horseradish peroxidase-conjugated detection antibodies were then diluted 5,000 fold with conjugate diluent (50 mM Tris, 0.14 M NaCl, 1% BSA, 0.05% Tween 20, pH 8.0) and transferred to each well. Following incubation of the plates at room temperature for 1 h, an enzyme reaction was initiated by adding substrate solution and incubating the plates at room temperature in the dark for 20 min. Finally, the reaction was terminated by adding 2 M H2SO4 solution and the absorbance was measured at 450 nm.
Histological analysis
Ear tissues were removed from mice of subset groups, fixed in 10% formalin, embedded in paraffin wax, routinely processed, and then sectioned into 4 µm thick slices. Next, the ear tissue sections were stained with hematoxylin and eosin (H&E), after which they were examined by light microscopy for the presence of immune cell accumulation at 400× magnification. The thickness of the epidermis and dermis were also measured using the Leica Application Suite (Leica Microsystems, Wetzlar, Germany). In addition, the infiltration of mast cells into the ear tissue was detected by staining with toluidine blue as described in previous studies [47]. After deparaffinization and dehydration, ear skin sections were stained with 0.25% toluidine blue (Sigma-Aldrich Co.) and examined by light microscopy for the presence of mast cells at 400× magnification. The number of cells per specific area was determined using the Leica Application Suite (Leica Microsystems).
RT-PCR analysis for cytokine gene expression
The relative quantities of mRNA for TNF-α and IL-1β were measured by RT-PCR. First, lymph nodes were frozen in liquid nitrogen, then chopped with scissors and homogenized in RNAzol B solution (Tet-Test Inc., TX, USA). Total RNA molecules were isolated by centrifugation at 15,000×g for 10min, then measured by UV spectroscopy. The expression of target genes was assessed using RT-PCR with 3 µg of total RNA from tissue of each group. Next, 500 ng of oligo-dT primer (Invitrogen, Carlsbad, CA, USA) were annealed at 70℃ for 10 min. The complementary DNA (cDNA), which was used as the template for further amplification, was synthesized by the addition of deoxyadenosine triphosphate (dATP), deoxycytidine triphosphate (dCTP), deoxyguanosine triphosphate (dGTP), and deoxythymidine triphosphate (dTTP) with 200 units of reverse transcriptase (Superscript II, Invitrogen, 200 U/µL). Next, 10 pmol of the sense and antisense primers were added, and the reaction mixture was subjected to 28–32 cycles of amplification in a Perkin-Elmer Thermal Cycler. The following temperature cycle was used for PCR: 30 sec at 94℃, 30 sec at 62℃, and 45 sec at 72℃. The primer sequences for target gene expression identification were as follows: TNF-α, sense primer: 5'-CCT GTA GCC CAC GTC GTA GC-3', anti-sense primer: 5'-TTG ACC TCA GCG CTG ACT TG-3'; IL-1β, sense primer: 5'-GCA CAT CAA CAA GAG CTT CAG GCA G-3', anti-sense primer: 5'-GCT GCT TGT GAG GTG CTG ATG TAC-3'; β-actin, sense primer: 5'-TGG AAT CCT GTG GCA TCC ATG AAA C-3', anti-sense primer: 5'-TAA AAC GCA GCT CAG TAA CAG TCC G-3'. The experiment was repeated three times, and all samples were analyzed in triplicate. The final PCR products were separated on 1% agarose gel, then visualized by ethidium bromide staining.
Bioluminescence imaging analysis
In vivo imaging analysis to detect the luciferase-derived signal was conducted using an IVIS imaging system (Xenogen, Oakland, CA, USA) as previously described [1415]. Briefly, IL-4/Luc/CNS-1 Tg mice were anesthetized with Alfaxan and injected i.p. with 150 mg/kg of D-luciferin (Sigma-Aldrich Co.). Ten minutes after D-luciferin injection, images of the whole body and several organs (lung, kidney, spleen, heart, mesenteric lymph node (ML), submandibular lymph node (SL), thymus and pancreases) of mice from subset groups were taken for 3 min using an IVIS imaging system, after which the photons emitted from specific regions and organs were quantified using the Living Image software (Xenogen). The in vivo luciferase activity was then expressed in photons per second.
Statistical analysis
One-way ANOVA was used to identify significant differences between the PA and AOO treated groups (SPSS for Windows, Release 10.10, Standard Version, Chicago, IL, USA). Additionally, differences between the PA+Vehicle treated group and the PA+EaEAC treated group were evaluated by a post hoc test (SPSS for Windows, Release 10.10, Standard Version) of the variance and significance levels. All values were expressed as the means±SD. A P value of <0.05 was considered significant.
Results
Total saponin, flavonoid and polyphenolic contents of EaEAC
First, the concentration of two important antioxidants was determined in EaEAC to evaluate the potential for use as an antioxidant. As shown in Figure 1B, EaEAC contained 88.5 µg/mL of flavonoids and 102.1 µg/g of polyphenol, as well as a high concentration of total saponin (57.2±1.47 mg/g).
Effect of EaEAC treatment on ear thickness and morphology
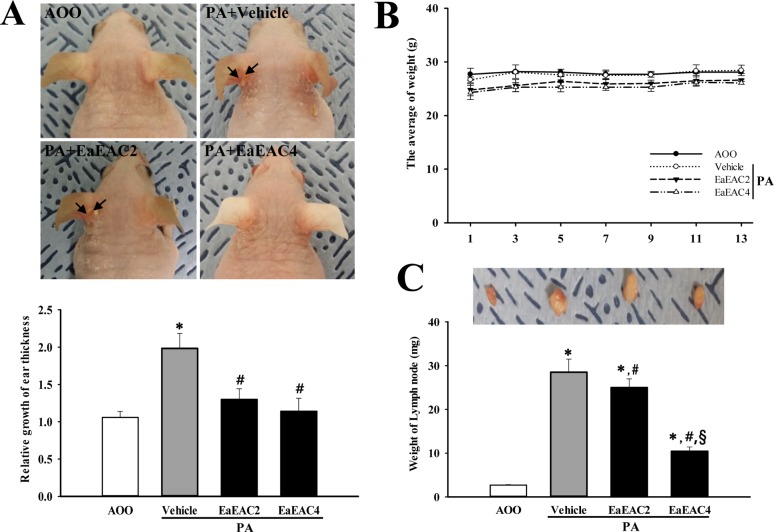
We first determined if EaEAC treatment suppresses changes in ear phenotypes induced by PA treatment. To accomplish this, the ear thickness and morphology were observed in IL-4/Luc/CNS-1 Tg mice over 2 weeks. The ear thickness was higher in the PA treated group than the AOO treated groups; however, this level decreased rapidly in the PA+EaEAC2 and PA+EaEAC4 treated groups, although no significant difference was observed in either group (Figure 2A). Furthermore, the outline of the ear vein, ear color and scab were dramatically recovered in the PA+EaEAC treated group (Figure 2A). Therefore, these findings demonstrate that EaEAC treatment may successfully relieve the increase of ear thickness and morphology including vein diameter and color induced by PA treatment.
Effect of EaEAC treatment on body weight, lymph node weight and IgE concentration
We investigated the effects of EaEAC treatment on body weight, lymph node weight and IgE concentration in the PA-induced skin inflammation of IL-4/Luc/CNS-1 Tg mice. Lymph node weight increased dramatically in response to topical application of PA, although the body weight remained at a constant level (Figure 2B, 2C). However, the lymph node weight decreased significantly by 17% and 70%, respectively, in the PA+ EaEAC2 and PA+EaEAC4 group (Figure 2C).
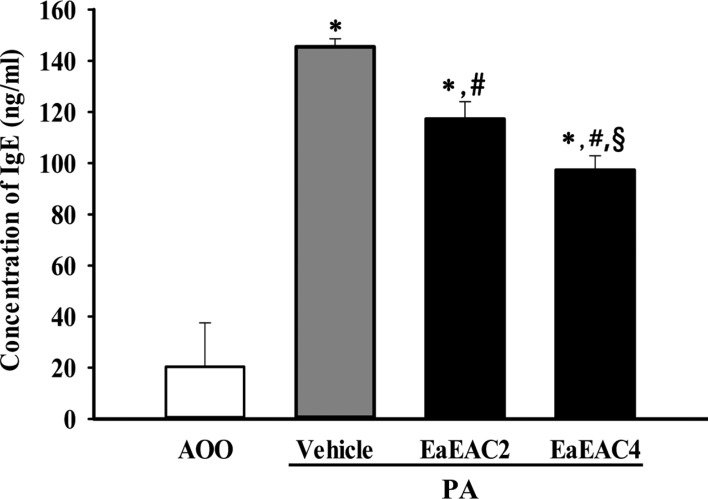
Additionally, repeated topical application of PA solution induced a rapid increase of serum IgE concentrations in IL-4/Luc/CNS-1 Tg mice. However, these levels decreased significantly by 19% and 25% in the PA+EaEAC2 and PA+EaEAC4 treated groups, respectively (Figure 3). Taken together, these results suggest that EaEAC treatment may contribute to the decrease in the weight of lymph nodes, as well as recovery of the IgE concentration in IL-4/Luc/CNS-1 Tg mice treated with PA.
Effect of EaEAC treatment on histopathological structure of ear tissue
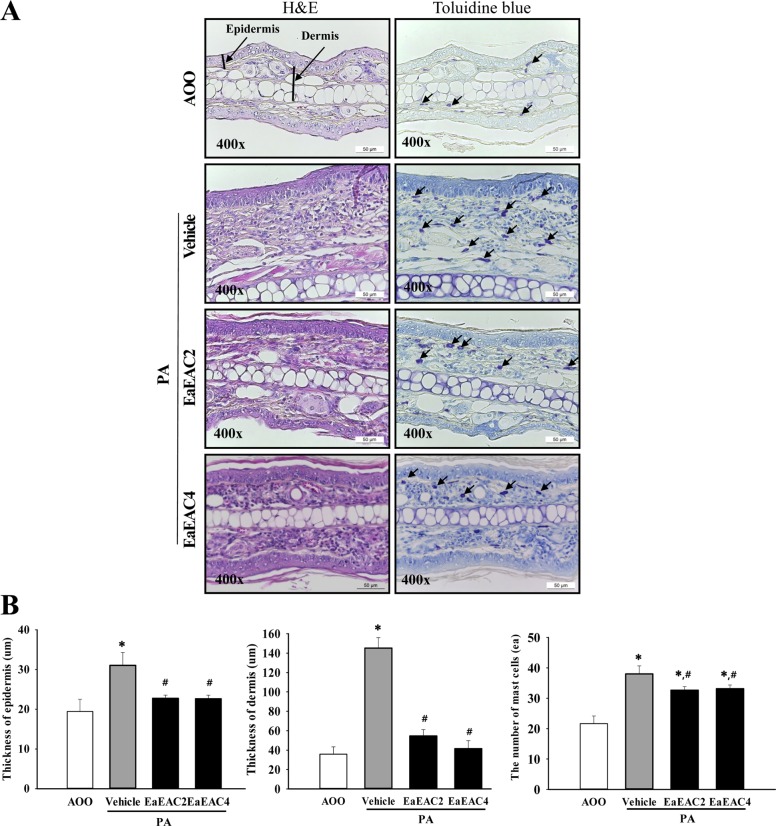
To investigate the suppressive effects of EaEAC treatment on histological structure of ear tissue, the histopathological features of ear tissue of IL-4/Luc/CNS-1 Tg mice were evaluated after EaEAC treatment for two weeks. The thickness of the epidermis and dermis of the ear tissue was increased in the PA+Vehicle treated group relative to the AOO treated group. However, these levels decreased significantly by 62–72% (dermis) and 29% (epidermis) after EaEAC treatment, and this decrease was does dependent (Figure 4A, 4B). In addition, the PA+EaEAC treated group showed the disappearance of infiltrated lymphocytes, while the PA+Vehicle treated group showed a large number of lymphocytes (Figure 4A). Furthermore, large numbers of mast cells were stained blue in the dermis in the PA+Vehicle group relative to the AOO treated group. However, the number of stained cells was significantly decreased in the PA+EaEAC2 and PA+EaEAC4 (15%) treated groups (Figure 4). Therefore, the present results indicate that EaEAC treatment may improve the histological changes in PA-induced skin inflammation, as well as contribute to the suppression of mast cells infiltration in the dermis of ear skin.
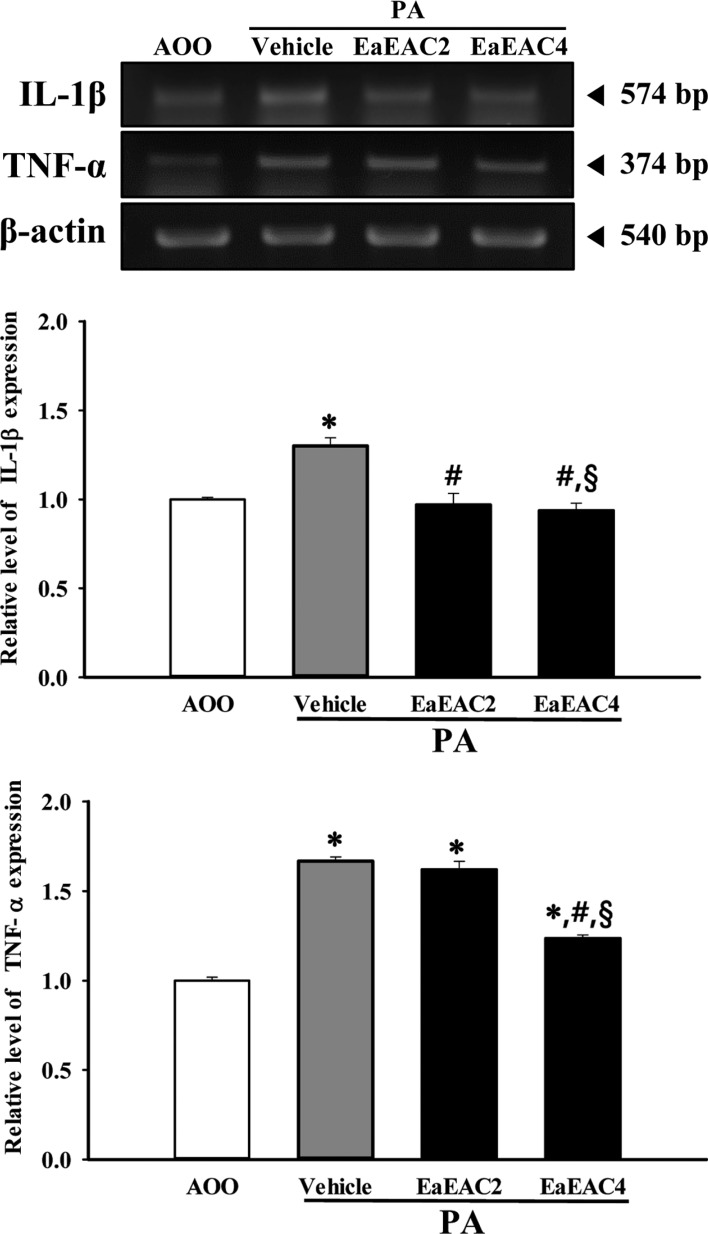
Effects of EaEAC treatment on the expression of inflammatory cytokines
To determine if EaEAC treatment could induce alterations in the inflammatory cytokines in PA-induced skin inflammation, the level of IL-1β and TNF-α transcripts were measured in the lymph nodes of AOO, PA+Vehicle and PA+EaEAC treated group. The pattern of IL-1β and TNF-α expression in AOO and PA treat group was similar to the intensity of the luciferase signal, although the rate of decrease varied among groups. The expression of IL-1β and TNF-α was generally higher in the PA+Vehicle treated group than the AOO treated group. However, these levels in the PA+EaEAC2 and PA+EaEAC4 groups were dramatically decreased to the level of the AOO treated group (Figure 5). Overall, the present results suggest that suppression of IL-1β and TNF-α expression by EaEAC treatment contributes to the relief of skin inflammation.
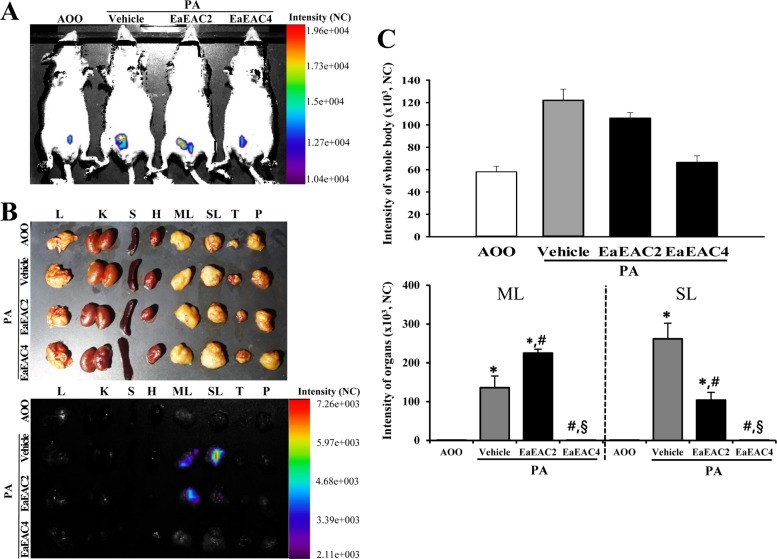
Suppressive effect of EaEAC treatment on the luciferase signal derived from IL-4 promoter
Finally, we investigated the role of IL-4 cytokines during the anti-inflammatory action of EaEAC in IL-4/Luc/CNS-1 Tg mice. To achieve this, the luciferase signal, which is a marker indicating the skin inflammation in PA treated IL-4/Luc/CNS-1 Tg mice, were measured throughout the body and in eight organs of IL-4/Luc/CNS-1 Tg mice after EaEAC treatment using the Living Image software. In case of the whole body image, the luciferase signals were higher in the abdominal region of the PA+Vehicle group than that of the AOO treated group. However, the increase in the signal with PA treatment decreased significantly as the dose of EaEAC increased (Figure 6A, 6C). As shown in the organ image, high luciferase signals were observed in SL and ML among the eight investigated organs of the PA+Vehicle group, while extremely low levels of signal were observed in the same organs of the AOO treated group. However, the luciferase signal was reduced in the ML and SL of the PA+EaEAC2 and PA+EaEAC4 group, and complete recovery was observed in the PA+EaEAC4 group (Figure 6B, 6C). Therefore, these results indicate that overactivation of the IL-4 promoter can successfully reflect alterations in the phenotypes of skin inflammation, and that IL-4 may play an important role in the suppression of EaEAC in PA-induced skin inflammation.
Discussion
Identification of novel natural products with high antiinflammatory activity without the negative immunosuppression side effects has long been the subject of a great deal of attention. Some compounds used to treat skin inflammation by effectively blocking inflammatory mediators produced by skin tissue and immune cells have been considered good candidates for anti-inflammation therapy [4849]. As part of the aforementioned research, we investigated the possibility that the extract of A. cochinchinensis roots can improve skin inflammation induced by PA treatment. The results presented herein indicate that EaEAC treatment can effectively improve the skin inflammation induced by PA exposure. Furthermore, they show that IL-4 cytokine may play an important role in the mechanism by which EaEAC suppresses skin inflammation of IL-4/Luc/CNS-1 Tg mice.
IL-4/Luc/CNS-1 Tg mice used in this study were first developed to measure the effects of allergens including a respiratory sensitizer, vaccine additives, and crude extracts of natural allergens without necropsy because IL-4 has been identified as a potentially important Th2 cytokine in the development of allergies [45]. In addition, this mouse has been applied to evaluate the therapeutic and protective effects of anti-allergic and anti-inflammatory substances. The luciferase signal derived from IL-4/Luc/CNS-1 Tg mice was significantly inhibited by the aqueous extract of Liriope platyphylla (AEtLP) and aqueous extract of Cheonggukjang (CKJ) containing a high concentration of GABA [1415]. In this study, this model was successfully applied to investigate the therapeutic effects of EaEAC on skin inflammation. The suppression of luciferase signal observed in previous studies was also detected in the PA+EaEAC group.
To date, only one study has reported the therapeutic effects on the skin inflammation of A. cochinchinensis roots, although several studies have reported antiinflammatory activity of A. cochinchinensis extract in astrocyte and microglial cells [4150]. In the above study, 70% ethanolic extract from A. cochinchinensis reduced the ear thickness and weight, cytokine production, MPO activity and histological alterations in TPA-induced mouse ear edema [41]. Similar results were observed in response to ethyl acetate extract from A. cochinchinensis roots in the present study after EaEAC treatment, even though different extracts and animals were used in this study. Therefore, the above results indicate that some candidates for anti-inflammatory compounds distributed in A. cochinchinensis roots may be commonly extracted in 70% ethanol and ethyl acetate.
Th1 and Th2 cytokines generally contribute to the regulation of inflammatory and immune response. Th2-secreted cytokines including IL-4 stimulate humoral immunity, whereas cytokines secreted from Th1 cells including IFN-γ, induce activation of cellular immunity [25]. TNF-α and IL-1β play an important role in regulation of inflammatory responses in various conditions induced by allergens. In TPA-induced skin inflammation, the protein level of two inflammatory cytokines (TNF-α and IL-1β) in the serum was reduced by 70% ethanol extract from A. cochinchinensis [50]. Similar results were also observed in the PA+Liriope platyphylla (LP) treated group, although different types of cytokines were analyzed. Following treatment with LP extracts, IL-6 and VEGF expression was dramatically recovered in ear tissue of IL-4/Luc/CNS-1 Tg mice [14]. In the present study, the expression levels of two cytokines were measured in the lymph nodes of IL-4/Luc/CNS-1 Tg mice treated with PA+EaEAC. Significant recovery of cytokine expression was similar to that observed in previous studies was found in the present study. Therefore, our results provide additional evidence that identification of novel natural products with the same ability to suppress inflammation as Th1 and Th2 can be considered an important concept in treatment of skin inflammation.
In this study, we examined the therapeutic effects of EaEAC in skin inflammation induced by PA treatment using the inflammatory markers and luciferase signal in IL-4/Luc/CNS-1 Tg mice. The general phenotypes of skin inflammation were significantly decreased in the PA+EaEAC treated group, while the suppressive effects of EaEAC were successfully reflected in the luciferase signal derived from IL-4 promoter. Therefore, our results suggest that EaEAC should be considered a candidate for the treatment and prevention of inflammatory reactions in skin.
 XML Download