

 PDF
PDF Citation
 Print
Print


INTRODUCTION
DNA damage, including base substitution, DNA cross-links, single- or double-strand break (DSB), are phenomena that occur as a result of environmental assaults such as chemotherapy, radiation, polycyclic hydrocarbons, and ultraviolet light. Activating cell cycle checkpoints through the DNA damage response (DDR) occurs in response to DNA damage in mammalian cells [1]. During this process, a temporary arrest or delay in transition occurs at certain stages of the cell cycle (G0/G1 or G2/M phase), allowing cells to correct possible defects in the genome [2]. This reaction eventually restores the continuity of DNA double strands and helps cells avoid propagation of genetic lesions to daughter cells. However, it triggers cell death pathway if DNA lesions are irreparable.
Mitochondria are important for the control of cell survival and cell death. The ability of mitochondria to modulate cell death is generally related to their roles in reactive oxygen species (ROS) production and ATP generation [3]. Mitochondrial dysfunction is usually accompanied by loss of transmembrane potential and accumulation of ROS [4]. The mitochondrial membrane gradient’ collapse increases electron leakage in the electron transport chain (ETC) and potentially leads to excessive ROS levels. When ROS concentration reaches a certain threshold level and overwhelms the antioxidant function, this causes damage to macromolecules and organelles, eventually leading to cell death [5]. However, moderate ROS levels are important for redox-dependent signaling to maintain physiological functions, including cell differentiation, proliferation, and survival.
Malignant mesothelioma (MM) is a highly lethal tumor arising from the mesothelium of serous cavities of the lung, pleura or peritoneum. Although combination with pemetrexed and cisplatin is currently the first-line treatment for patients with MM [6], this therapeutic regimen has shown poor outcome due to drug resistance. Impaired capacity to undergo apoptosis is known to be one of the leading causes of treatment failures and relapses [7]. Deregulation of many molecules that regulate apoptosis, such as intrinsic pathway (bcl-2 family, PI3K-Akt and Wnt signalings), or extrinsic pathway (TRAIL, NF-kB and ERK1/2 signalings) has been shown in MM tumorigenesis [8]. Therefore, the development of therapeutic approaches that restore apoptosis or trigger non-apoptotic cell death can overcome treatment resistance for MM and provide an opportunity to address the unmet need for this deadly disease.
Apoptosis is considered a well-defined form of programmed cell death (PCD), whereas necroptosis, one of PCD pathways, still has much to be proven. Necroptosis is initiated by activation of receptor-interacting protein kinase (RIPK) 1, which then binds to RIPK3 and activates it to form a necrosome. These events will ultimately trigger necroptosis by activating mixed lineage kinase domain like protein (MLKL) [9]. Several chemotherapeutic drugs, including etoposide, taxol, 5-fluorouracil, and camptothecin, as well as several natural products such as shikonin, β-lapachone, and eupomatenoid-5 can induce necroptosis in various cancer cells [10,11]. Evidence has shown that necroptosis can function as a protective mechanism to kill cancer cells that lack the mechanism(s) of DNA damage-induced apoptosis, suggesting that targeting necroptosis is an attractive anticancer strategy for apoptosis-resistant tumors [11].
Among the many bioactive substances in nature, apigenin (4´,5,7-trihydroxyflavone), a flavone abundant in parsley, orange, celery, chamomile, and onion, because of its chemopreventive and chemotherapeutic effects on various types of cancers, including breast, thyroid, prostrate, liver, and breast cancer cells [12], it has been reported as an anticancer agent. Apigenin can inhibit cancer cell proliferation by inducing apoptosis, modulating the cell cycle, inhibiting invasion and metastasis, and stimulating the immune responses [12-14]. During those processes, apigenin regulates many signaling pathways, including PI3-kinase/Akt, p38/MAPK, JNK/STAT, and NF-κB. Although anti-cancer effects of apigenin have been proven in several studies, little is known about its effect on MM.
Two-dimensional monolayer cultures of cancer cells do not adequately reproduce the natural structure of tumors in vivo, interactions of cells with cells or microenvironments in tumor mass [15]. In addition, metabolic stresses such as hypoxia and acidic pH found in tumor microenvironments are considered as main causes of tumor aggressiveness and chemoresistance [16]. Therefore, establishing experimental conditions considering effects of extracellular acidic pH in a tumor microenvironment might be useful for the development of more effective treatment candidates. To compensate for the shortcomings of 2D cell culture and to mimic the in vivo environment, we analyzed effects of apigenin after adapting cells to an acidic environment through prolonged preconditioning in a culture medium containing lactic acid and confirmed the results obtained in 2D monolayer cell culture with a 3D spheroid culture model.
The study aims to verify the efficacy of apigenin as a candidate anticancer agent for MM and underlying mechanism(s) involved in anti-cancer effect. We present here that apigenin can cause cell death by targeting necroptosis through ROS-mediated mitochondrial dysfunction and DNA damage as a novel mechanism.
Go to : 
METHODS
Reagents and cell culture
Apigenin (catalog no. 149930, ≥ 95.0% purity), lactic acid, 3-(4,5-dimethylthiazol-2-yl)-2,5-diphenyltetrazolium bromide (MTT), cisplatin (catalog no. P4394), fluorescein diacetate (FDA), propidium iodide (PI), casein blocking buffer, dimethylsulfoxide (DMSO), 2',7'-dichlorodihydrofluorescein diacetate (DCF-DA), rhodamine 123, and Tween-20 were purchased from Sigma-Aldrich (St. Louis, MO, USA). Antibodies for MLKL (catalog no. 14993), p-MLKL (catalog no. 91689), RIP3 (catalog no. 13526), p-RIP3 (catalog no. 93654), p-ataxia-telangiectasiaSer1981 (ATMSer1981; catalog no. 5883), p-ATM-relatedSer428 (ATRSer428; catalog no. 2853), p-histone H2A.XSer139 (catalog no. 9718), Bax (catalog no. 5023), Bcl-2 (catalog no. 2820), caspase-3 (catalog no. 9665), cleaved caspase-3 (catalog no. 9664), PARP (catalog no. 9542), and cleaved PARP (catalog no. 9541) were purchased from Cell Signaling Technology, Inc. (Danvers, CO, USA). Goat anti-rabbit IgG-horseradish-peroxidase (HRP; catalog no. sc-2004), mouse anti-goat IgG-HRP (catalog no. sc-2354), and goat anti-mouse IgG-HRP (catalog no. sc-2005) were purchased from Santa-Cruz Biotechnology (Dallas, TX, USA). Human mesothelioma cell lines MSTO-211H and H-2452 and human mesothelial cell line, MeT-5A, were obtained from the American Type Culture Collection (ATCC, Manassas, VA, USA). Human mesothelioma cell lines MSTO-211H and H-2452 and human mesothelial cell line MeT-5A were obtained from the American Type Culture Collection (ATCC). MSTO-211H and H-2452 cells were preadapted to acidic medium by continuous exposure to lactic acid (3.8 µM) via serial passage over 4 times over 15 days. Cells were then maintained in RPMI-1640 medium supplemented with 10% fetal bovine serum, 3.8 µM lactic acid, 1 mM glutamine, 100 units of penicillin/ml and 100 µg of streptomycin/ml. Normal methothelial MeT-5A cells were maintained in completed M-199 (Welgene, Daegu, Korea) medium including 3.3 nM epidermal growth factor. They were then treated with apigenin for further analysis.
Cell viability assay
Cells were seeded into 96-well plates at density of 5 × 10³ cells in 100 µl complete medium per each well. The next day, cells were treated with vehicle (DMSO) or apigenin at various concentrations shown in the Figure legends (Figs. 1–3, and 5). After adding MTT reagent to each well, the plate was incubated at 37°C for 4 h. Absorbance values representing the amount of reduced MTT were measured at wavelength of 540 nm using a GloMax-Multi Microplate Multimode Reader (Promega Corporation, Durham, NC, USA). Cell viability was determined by comparing absorbance values to those of vehicle-treated cells (100%).
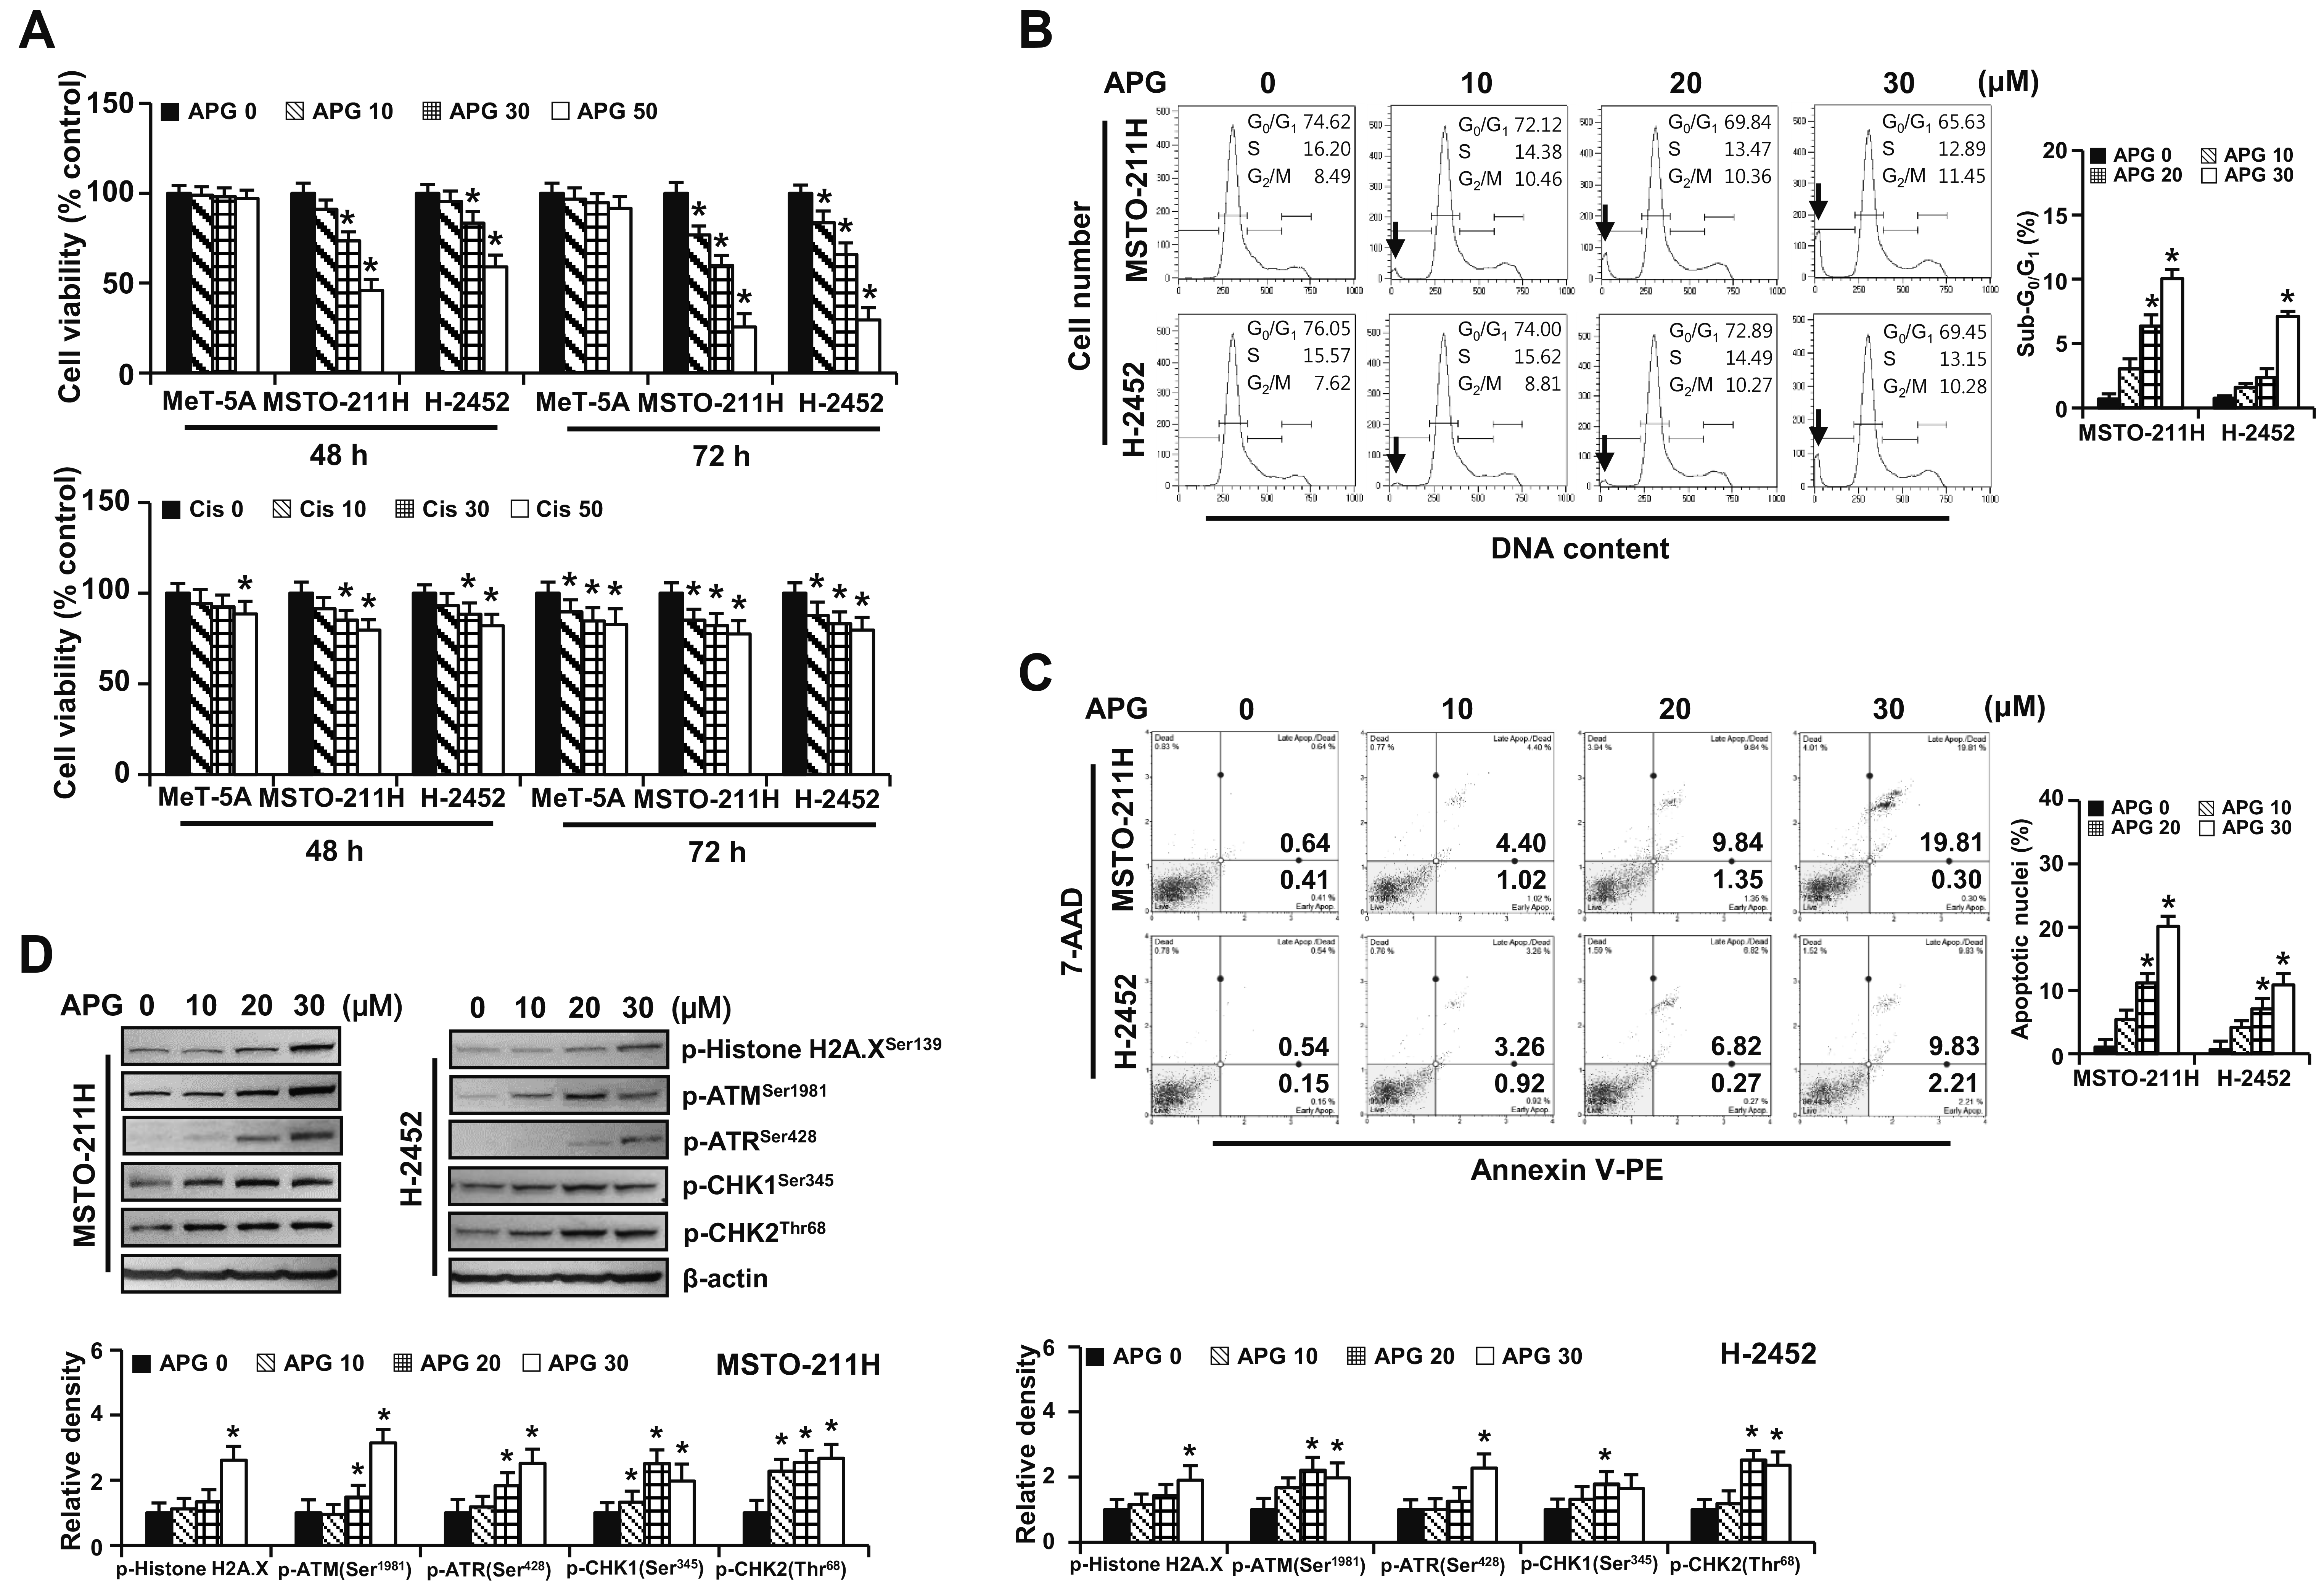 | Fig. 1Apigenin-induced cytotoxicity.Two MM cell lines, MSTO-211H and H-2452, and normal mesothelial cell line MeT-5A were treated with increasing concentrations (0, 10, 30, and 50 μM) of apigenin or cisplatin for 48 h and 72 h. (A) Cell viability was measured by MTT assay. (B) Cell cycle distribution was determined by flow cytometry following staining with propidium iodide (20 μg/ml). (C) Apoptotic cell fraction was analyzed using annexin V-PE binding assay. (D) Levels of DNA damage response proteins were assessed by Western blotting. MM, malignant mesothelioma; APG, apigenin; 7-AAD, 7-amino-actinomycin D; Arrows, sub-G0/G1 peak. *p < 0.05 vs. respective control group.
|
Cell cycle analysis
Cell cycle was analyzed by quantifying the DNA content in cells stained with PI. Briefly, cells were harvested, fixed with 70% ethanol, and left at –20°C overnight. After washing and resuspended in 1× PBS, Muse Cell Cycle reagent (Merck Millipore, Burington, MA, USA) was added to cells. DNA distribution from 10,000 cells was analyzed with MACSQuant Analyzer and MACSQuantify software version 2.5 (Miltenyi Biotec GmbH; GmbH, Bergisch, Germany).
Annexin V-PE binding assay
Apoptotic and necrotic cell distribution were determined by using Muse Annexin V & Dead Cell Assay kit (Merck KGaA). Briefly, cells were harvested after treatment with apigenin and labeled with annexin V-phycoerythrin and 7-amino-actinomycin D at room temperature for 20 min in the dark. Stained cells (5 × 10³) were then analyzed with Muse Cell Analyzer (Merck KGaA).
Western blot analysis
Cells were washed and lysed with 1× RIPA buffer. Protein quantitation was then performed by using a BCA protein assay kit (Thermo Fisher, Waltham, MA, USA). Proteins (40 µg) of each cell lysate were loaded onto 4%–12% NuPAGE gel (Invitrogen, Carlsbad, CA, USA) for electrophoresis and electro-transferred to a polyvinylidene difluoride (PVDF) membranes (GE Healthcare Life Science, Munich, Germany). After blocking for 2 h with 1× casein blocking buffer (Sigma-Aldrich), PVDF membranes were incubated with primary antibodies at 4°C overnight. After washing the membrane with 1× PBS containing Tween-20, it was incubated with HRP-conjugated secondary antibodies at room temperature for 2 h. Reactive proteins were visualized on an X-ray film by using enhanced chemiluminescence detection kit (Cyanagen Srl, Bologna, Italy). Membranes were re-probed with antibodies to anti-β-actin (Sigma-Aldrich) which served as a loading control.
Measurement of ROS and mitochondrial membrane potential
Cells were seeded into 6-well culture plates at density of 105 cells in 2 ml complete medium/well overnight. The next day, cells were then treated with apigenin in complete DMEM for the indicate time shown in the Figure legends (Figs. 3, 4). Cells were harvested by centrifugation, and then stained with 10 µM DCF-DA and 30 nM rhodamine 123 to measure the levels of ROS and mitochondrial membrane potential (ΔΨm), respectively, in the dark at 37°C for 30 min. After washing cells with 1× PBS, the average fluorescence intensity of 10,000 cells was measured by using the MACSQuant Analyzer with MACSQuantify software version 2.5.
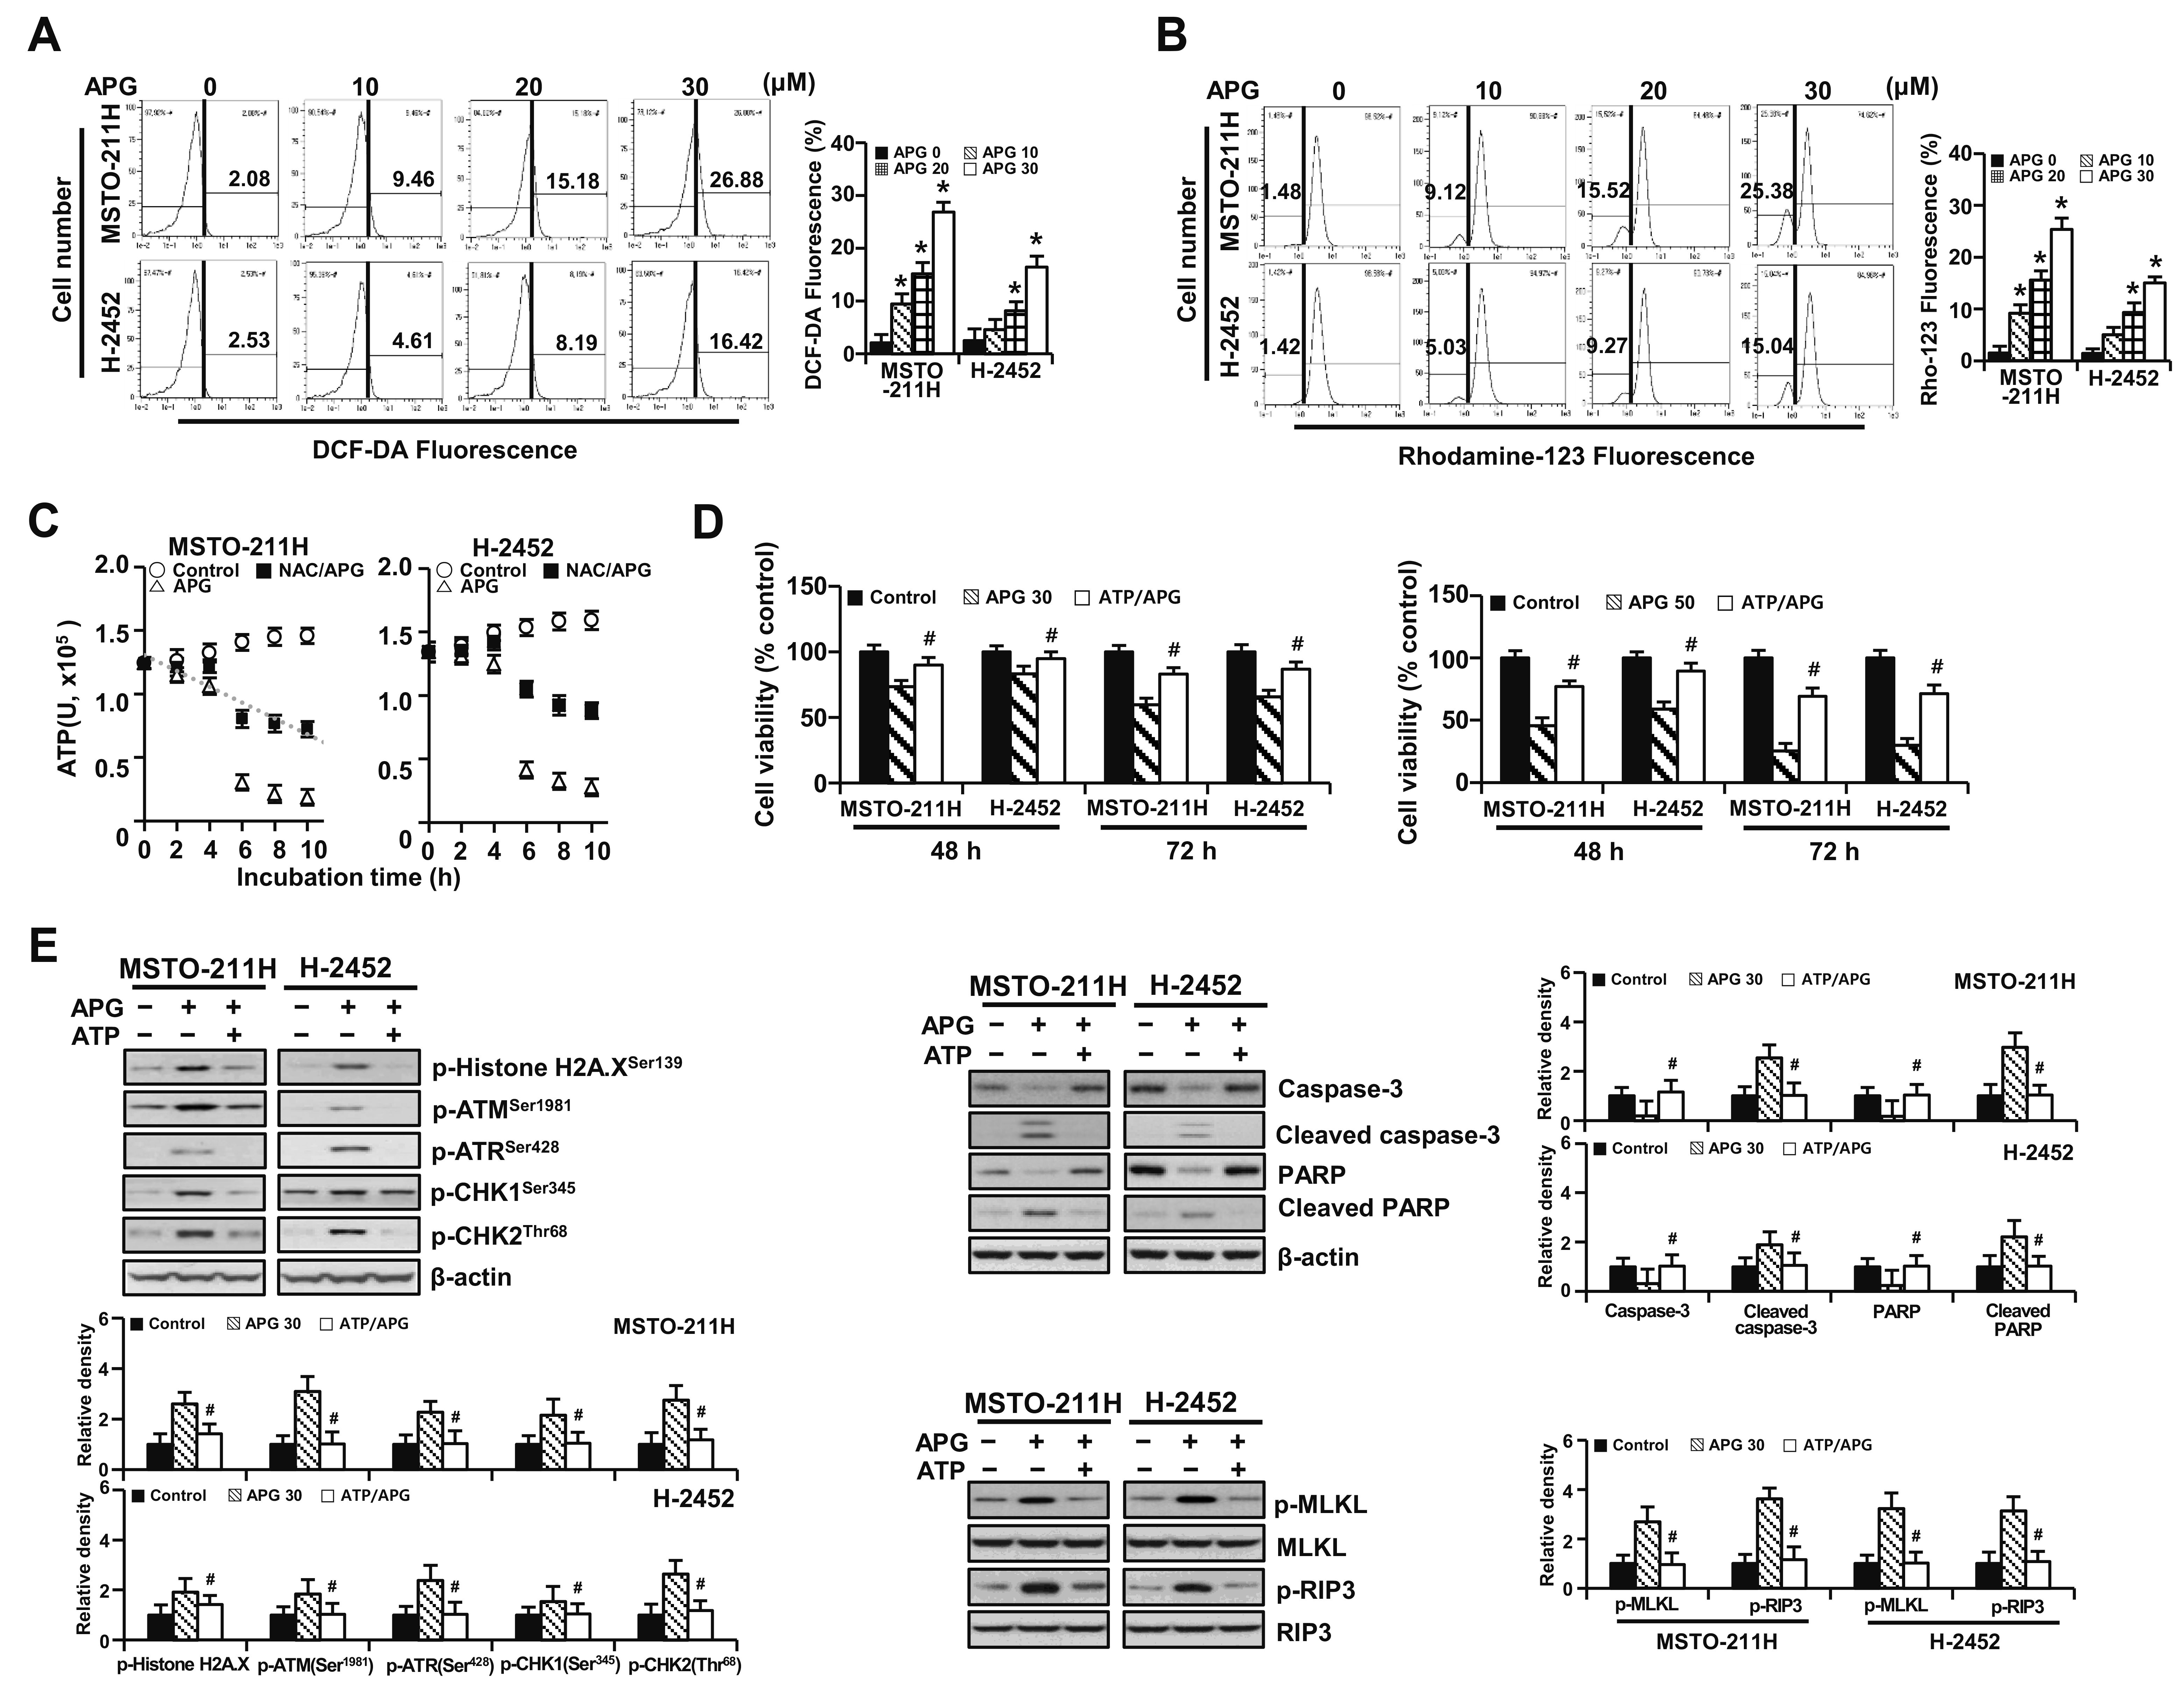 | Fig. 3Effects of apigenin on mitochondrial function in MSTO-211H and H-2452 cells.(A, B) Cells were treated with indicated concentrations of apigenin for 48 h. Intracellular ROS levels were measured after cells were stained with 10 μM DCF-DA (A). Mitochondrial membrane potential was measured after staining cells with 30 nM rhodamine123 (B). (C–E) Cells were pretreated with 5 mM NAC or 1 mM ATP for 2 h prior to treatment with 30 μM apigenin for 48 h. Cellular ATP levels were measured by CellTiter-Glo luminescent cell viability assay (C). Cell viability was measured by MTT assay (D). Levels of DNA damage response-, apoptosis-, and necroptosis-related proteins were assessed by Western blotting (E). APG, apigenin; NAC, N-acetylcysteine; ROS, reactive oxygen species. *p < 0.05 vs. respective control group. #p < 0.05 vs. group treated with APG alone.
|
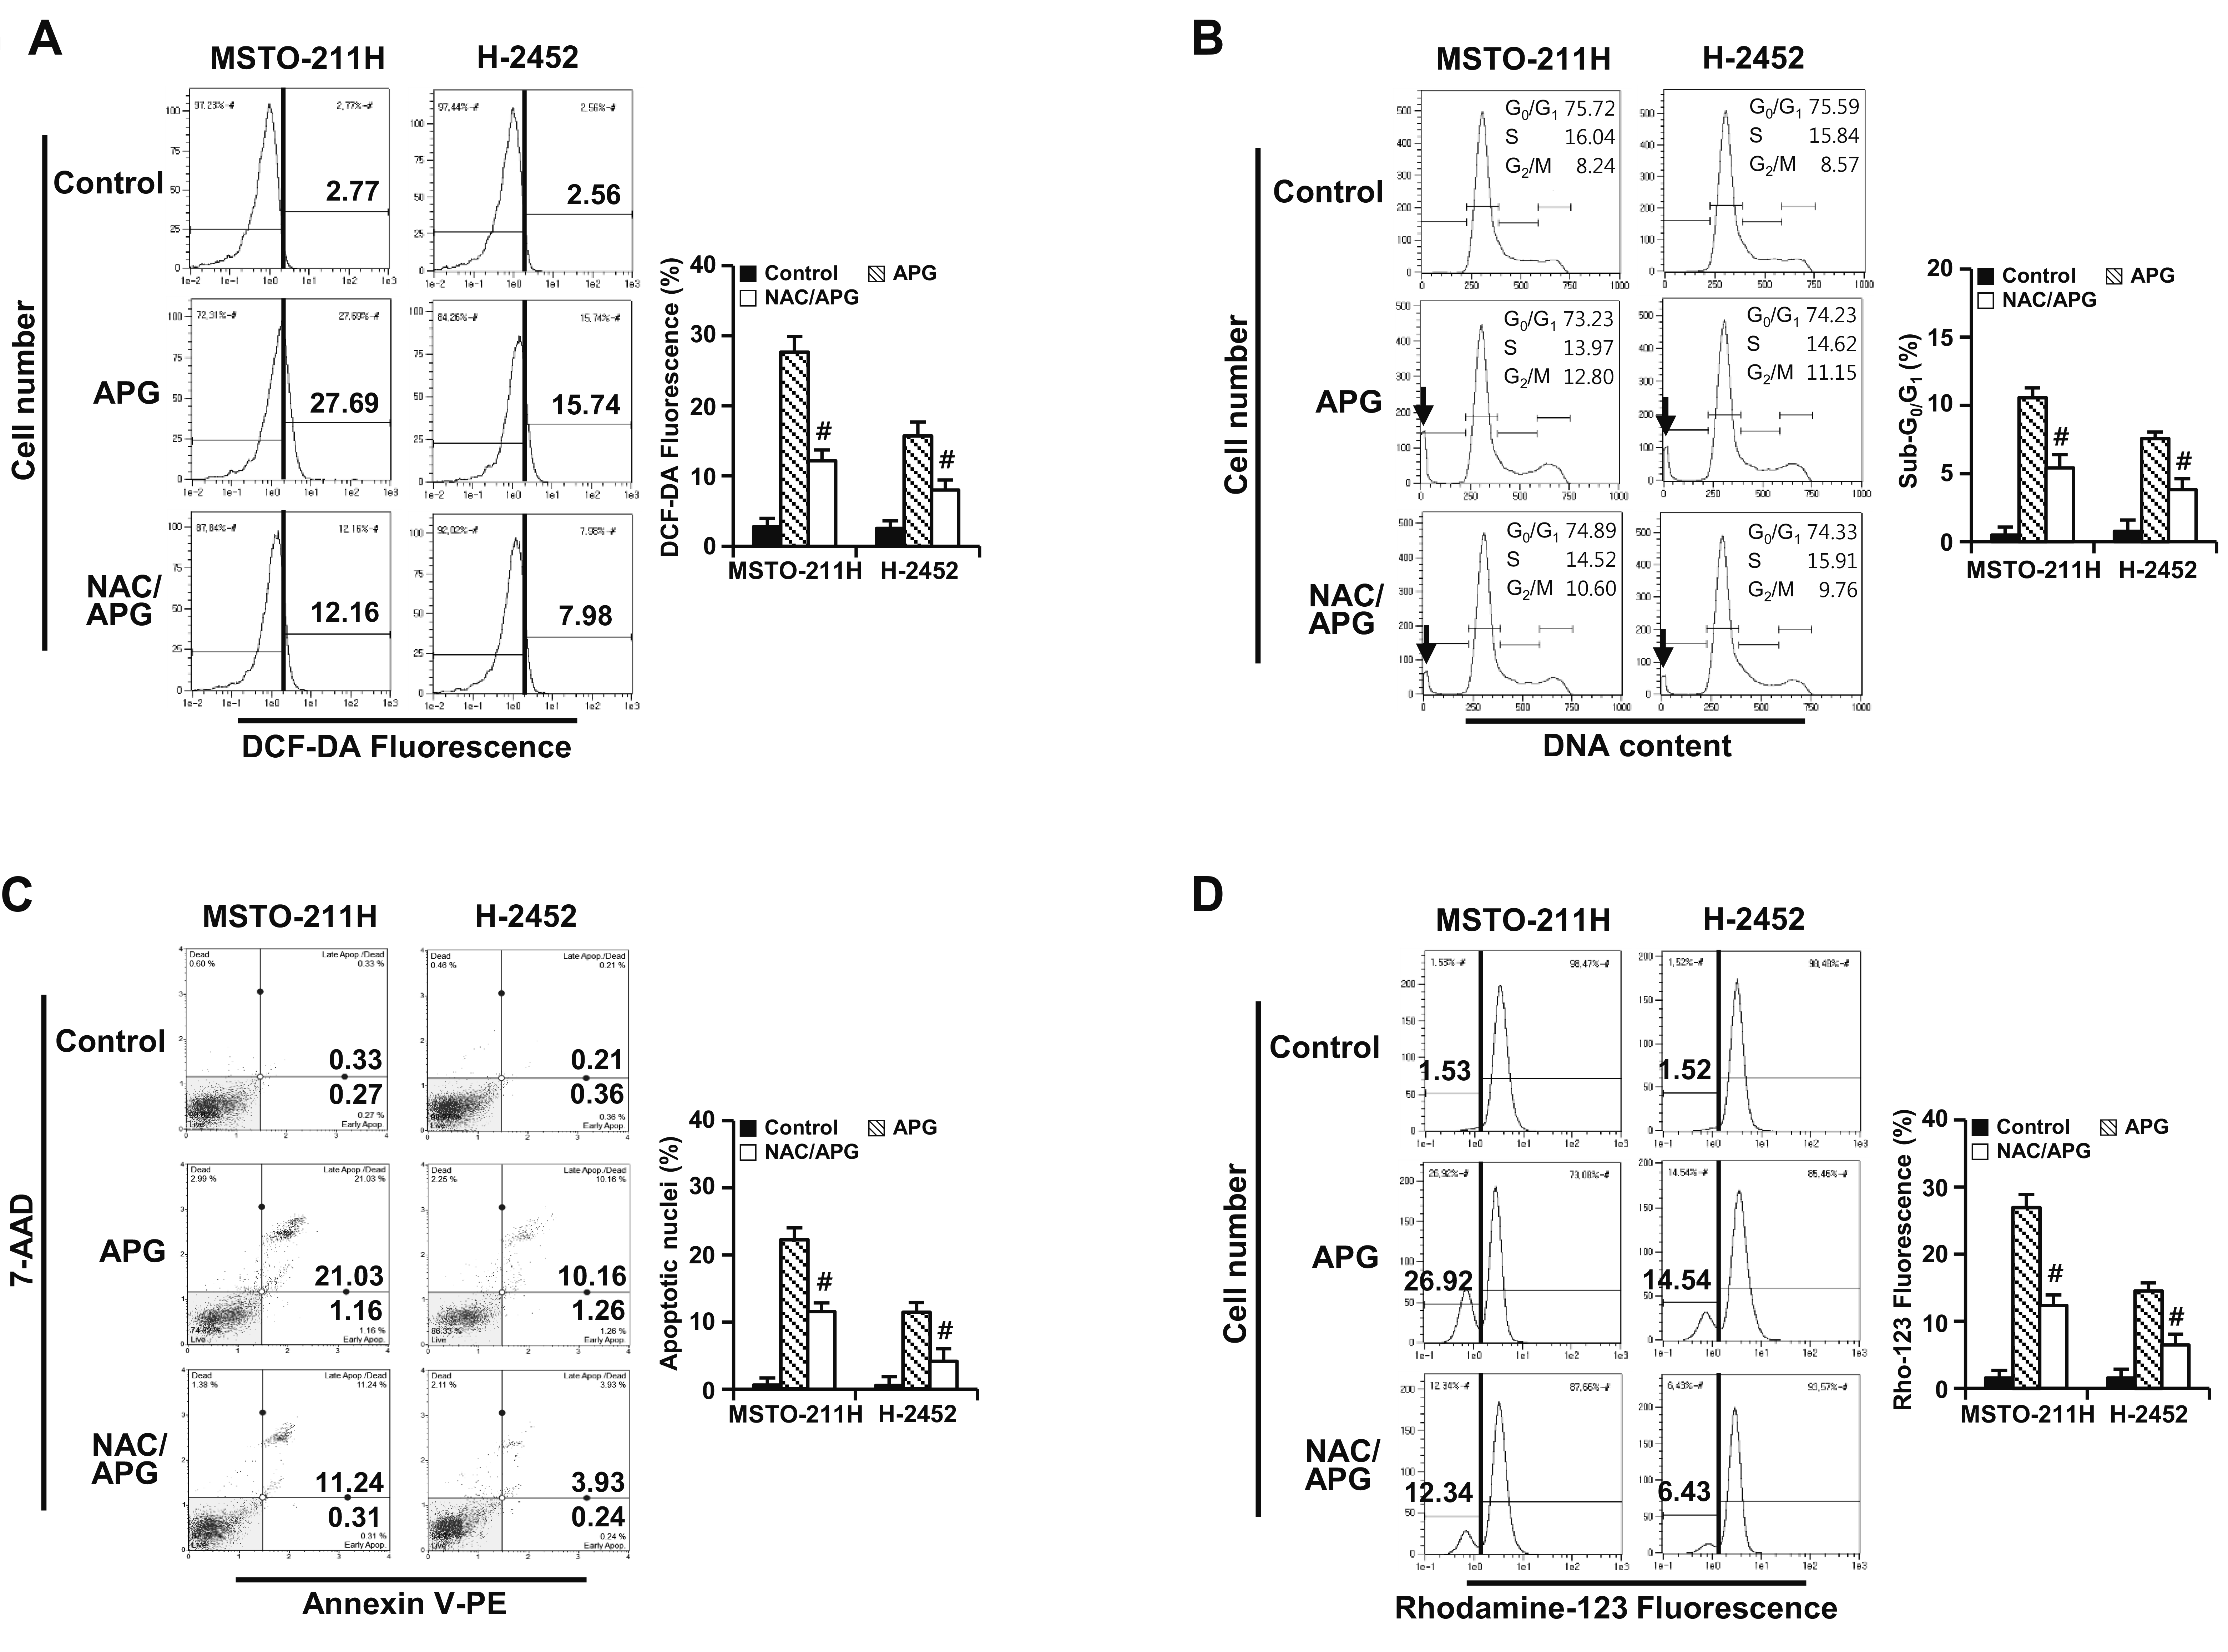 | Fig. 4Apigenin-induced oxidative stress in MSTO-211H and H-2452 cells.Cells were pretreated with or without 5 mM NAC for 2 h prior to treatment with 30 μM apigenin for 48 h. (A) Cellular ROS levels were measured by staining cells with 10 μM DCF-DA. (B) Cell cycle distribution was determined by flow cytometry following staining with propidium iodide (20 μg/ml). (C) Apoptotic cell fraction was analyzed using annexin V-PE binding assay. (D) ΔΨm was measured by staining cells with 30 nM rhodamine123. APG, apigenin; NAC, N-acetylcysteine; Arrows, sub-G0/G1 peak. #p < 0.05 vs. group treated with APG alone.
|
Measurement of intracellular ATP level
Intracellular ATP levels were measured by using the CellTiter-Glo Luminescent Cell Viability Assay (Promega Corporation). Briefly, cells were treated with apigenin for different time periods, after which CellTiter-Glo reagent (100 µl) was added to each well. Luminescence values produced by the luciferase-catalyzed luciferin was measured using a GloMax-Multi Microplate Multimode Reader. These values were compared to those of vehicle-treated control cells (100%) for each time point.
Spheroid culture and viability assay
Cells were seeded into ultra-low attachment 96-well plates at density of 104 cells/well. Plates were centrifuged at 1,000 rpm for 10 min to facilitate clustering of the cells, as described by Chambers et al. [17]. Cells were then maintained them in the complete DMEM. Spheroids were treated with apigenin for 48 h. Phase-contrast images of them were taken using a Leica inverted microscope. Spheroid viability was determined by using an enhanced cell viability assay kit (CellVia, Seoul, Korea). Briefly, after adding 10 µl of Cellvia solution to each well, the plate was kept at room temperature for 1 h and then mixed by shaking for 1 min. Formazan formed by living cells was measured at wavelength of 450 nm using a GloMax-Multi Microplate Multimode Reader.
Spheroid staining
Cells were kept in the dark after adding FDA (5 µg/ml) and PI (10 µg/ml) to stain both the viable and the dead cells, respectively. FDA, a cell-permeable esterase substrate, indicates viable cells by assessing enzymatic activity and cell-membrane integrity, while PI passes through damaged areas of dead or dying cell membranes into the nucleus and binds to DNA. Cells were imaged by using a Leica EL6000 fluorescence microscope with LAS version 4.3 software (Leica Microsystems Inc., Buffalo Grove, IL, USA).
Statistical analysis
Statistical comparisons were conducted using ANOVA and Tukey’s post hoc correction in SPSS 17.0 (SPSS, Inc., Chicago, IL, USA). Data are shown as a mean ± standard deviation of three independent experiments. A p < 0.05 meant statistical significance.
Go to :
RESULTS
DNA damage, transitional delay at G2/M phase, and cell death in apigenin-induced cytotoxicity
In MTT assay, when MSTO-211H and H-2452 cells were treated with increasing concentrations (0, 10, 30, and 50 µM) of apigenin for 48 h and 72 h, apigenin inhibited cell growth in a concentration and time-dependent manner (Fig. 1A). Although these cells were sensitive to apigenin treatment, MSTO-211H cells were more sensitive to such treatment than H-2452 cells. However, cisplatin treatment at the same concentration as apigenin showed low toxicity to MSTO-211H and H-2452 cells. In human normal mesothelial MeT-5A cells, apigenin showed cell viability of 90% or more at 48 h and 72 h treatment at 50 µM concentration. Cell cycle analysis of MM cells after apigenin treatment showed a concentration-dependent increase in the G2/M phase cells along with a sub-G0/G1 peak suggesting cell death (Fig. 1B). The percentage of annexin V-PE positive cells increased to 21.1% for MSTO-211H cells treated with 30 µM apigenin compared with 12.04% for H-2452 cells (Fig. 1C). To evaluate the effects of apigenin on DNA damage, we examined the phosphorylation levels of markers for DDR and DSB. As shown in Fig. 1D, apigenin increased the phosphorylation of ATMSer1981, ATRSer428, CHK1Ser345, and CHK2Thr68 as well as histone H2A.XSer139, a DSB marker, suggesting that apigenin could cause DSB and activate the ATM/ATR signaling pathway.
Apigenin-induced cytotoxicity accompanies concurrent induction of apoptosis and necroptosis
To elucidate mechanisms underlying cytotoxic effects of apigenin on MM cells, expression level of proteins involved in apoptosis and necroptosis were measured by Western blotting. As shown in Fig. 2A, apigenin increased levels of the cleaved forms of caspase-3 and its substrate PARP as well as an increase in the Bax/Bcl-2 ratio. Furthermore, apigenin increased expression levels of p-MLKL and p-RIP3 known to be necroptosis mediators. Inhibition of necroptosis or of apoptosis, either by pretreatment with necrostatin-1 or Q-VD-Oph-1, significantly enhanced cell viability at 48 h and 72 h treatment of apigenin (30 and 50 µM), suggesting that apigenin-induced cell death depended on apoptosis and necroptosis (Fig. 2B).
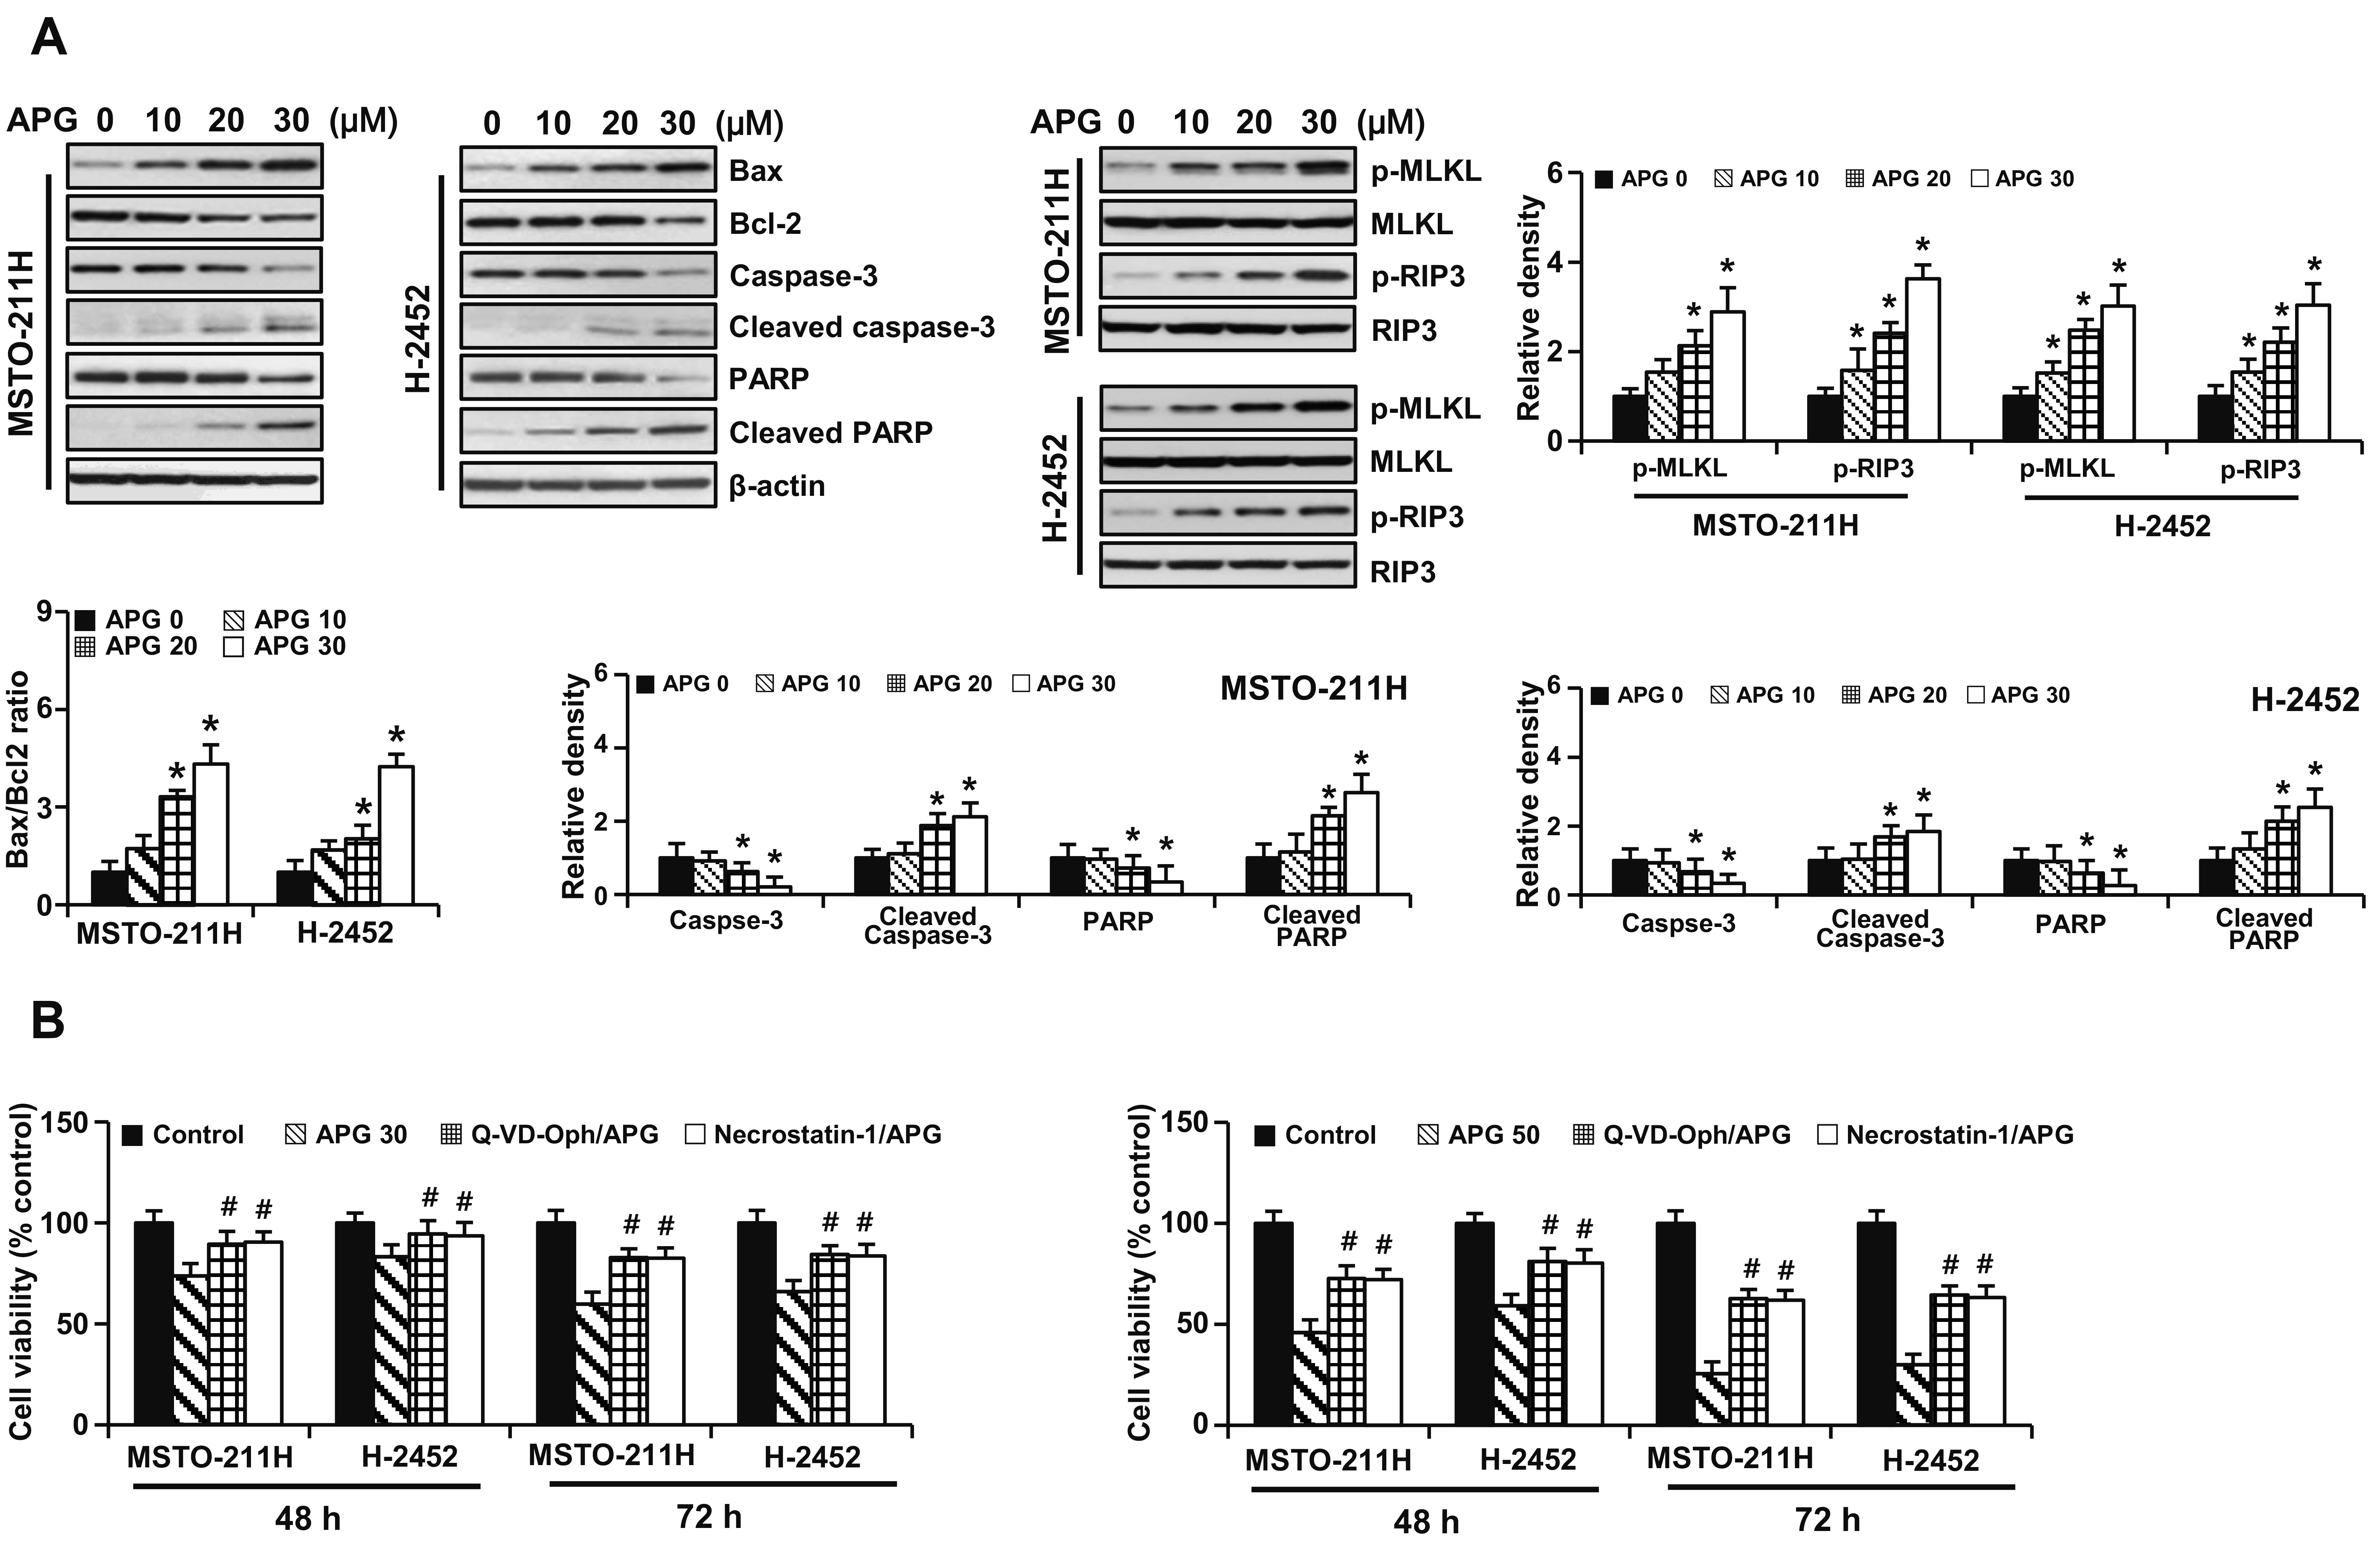 | Fig. 2Apigenin-induced apoptosis and necroptosis in MSTO-211H and H-2452 cells.(A) Cells were treated with increasing concentrations (0, 10, 30, and 50 μM) of apigenin for 48 h. Levels of apoptosis- and necroptosis-related proteins were assessed by Western blotting. (B) Cells were pretreated with 25 μM necrostatin-1 and 10 μM Q-VD-Oph-1 2 h prior to treatment with apigenin (30 and 50 μM) for 48 h and 72 h. Cell viability was measured by MTT assay. APG, apigenin. *p < 0.05 vs. respective control group. #p < 0 .05 vs. group treated with APG alone.
|
ROS and ATP play critical roles in apigenin-induced cytotoxicity
To investigate the role of intracellular ROS as upstream molecules of cytotoxicity induced by apigenin, DCF fluorescence assay was performed using flow cytometry. With increasing concentration of apigenin, the ROS level tended to gradually increase, but it showed a marked increase at 48 h of treatment (Fig. 3A), suggesting that apigenin-induced cytotoxicity might be in part due to excessive ROS. Next, we measured the ΔΨm to evaluate changes in the mitochondrial function after apigenin treatment. ΔΨm loss after apigenin treatment was higher in MSTO-211H cells compared to H-2452 cells (Fig. 3B). To evaluate the role of ATP in cytotoxicity that apigenin causes, changes in intracellular ATP level were measured in the apigenin-treated cells. In parallel with impaired mitochondrial function, ATP levels began to decrease within 2 h after apigenin treatment and was found to drop abruptly at 6 h (Fig. 3C). However, pretreatment with ROS scavenger N-acetylcysteine (NAC) restored ATP levels reduced by apigenin. ATP supplementation improved cell viability (Fig. 3D) and recovered DDR-, apoptosis-, and necroptosis-inducing molecules upregulated by apigenin to near-basal levels (Fig. 3E). These findings indicated that apigenin-induced cell death was caused by ATP depletion, at least in part.
Given the observation that excess ROS was linked to increased cytotoxicity, the effect of ROS scavenging on apigenin-treated cells was evaluated. Pretreatment of cells with NAC effectively restored ROS levels (Fig. 4A) and improved a series of effects induced by apigenin, including increased sub-G0/G1 peak and cell accumulation in G2/M phase of the cell cycle (Fig. 4B), increased annexin V-PE positive cell fractions (Fig. 4C), and an increased percentage of cells showing ΔΨm loss (Fig. 4D). In addition, pyknotic and fragmented nuclei observed in DAPI staining of apigenin-treated cells were not found in NAC treatment (Fig. 4E).
To determine whether the results of 2D cell culture matched those of 3D spheroid culture, spheroids derived from MSTO-211H and H-2452 cells were pre-incubated with or without NAC for 2 h, then treated with apigenin for an additional 48 h. Both viable and dead cells were visualized under a fluorescence microscope after having double stained them with FDA (green) and PI (red), respectively. As shown in Fig. 5A, apigenin increased red fluorescence in the necrotic core with green fluorescence on the spheroid surface. In parallel with the morphological findings, apigenin decreased cell viability in spheroids. However, this effect was blocked by NAC pretreatment (Fig. 5B). Cell viability after treatment with apigenin was slightly higher for 3D spheroid culture compared to that for 2D monolayer cell culture, Next, we investigated whether the expression of proteins related to apoptosis and necroptosis was affected by apigenin. As shown in Fig. 5C, levels of necroptosis-related proteins observed in the 3D spheroid culture after apigenin treatment showed similar trends as those found in 2D cell culture. However, we could not detect cleaved caspase-3, an executioner caspase in apoptosis in the 3D culture.
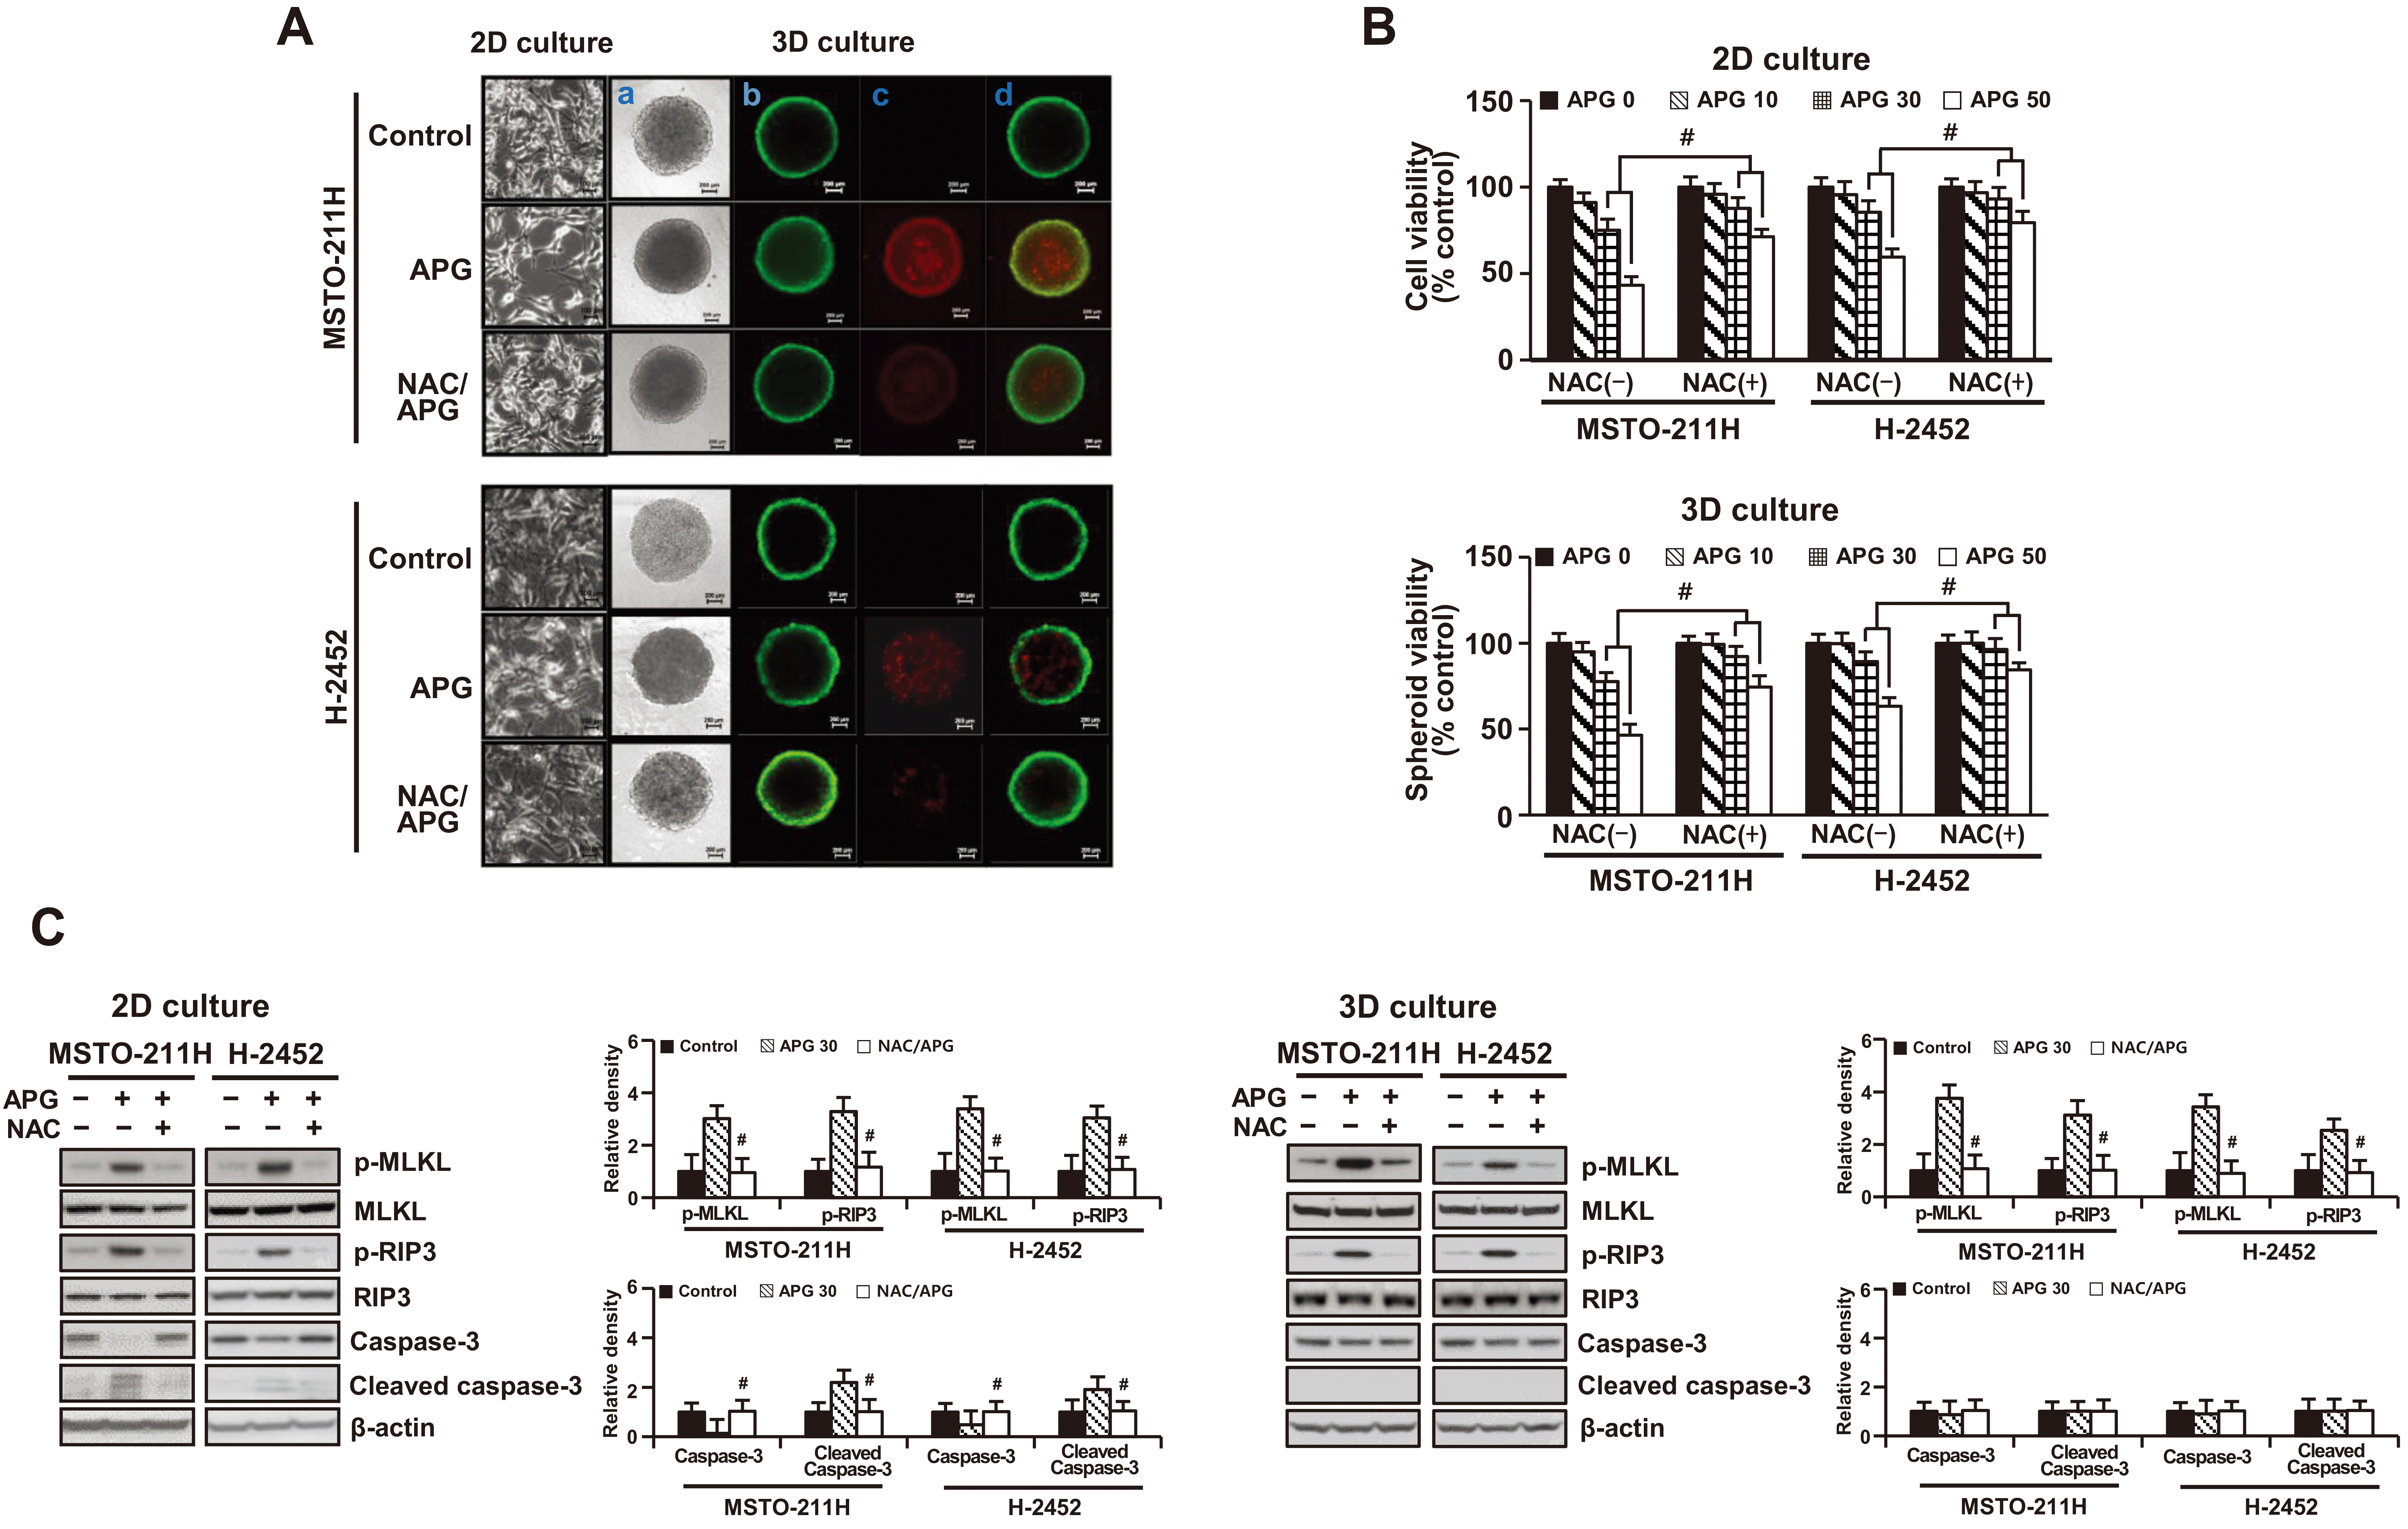 | Fig. 5Effects of pretreatment with N-acetylcysteine on apigenin-induced cytotoxicity in 3D cultures of MSTO-211H and H-2452 cells.Spheroids were cultured in ultralow cluster 96-well plate and pretreated with or without 5 mM NAC 2 h prior to treatment with 30 μM apigenin for 48 h. (A) Vitality staining of spheroids (from left to right: phase-contrast image [a], fluorescent images of FDA(+) living cells in green [b], PI(+) dead cells in red [c], and merged [d]) (×100). (B) Cell and spheroid viability were measured by MTT assay and the enhanced cell viability assay kit. (C) The levels of necroptosis- and apoptosis-related proteins were analyzed by Western blotting. APG, apigenin; NAC, N-acetylcysteine. *p < 0.05 vs. respective control group. #p < 0.05 vs. group treated with APG alone.
|
Go to :
DISCUSSION
Investigating the anti-cancer effects of apigenin on MM cells, we found the following changes in cellular response. First, apigenin treatment produced a significant cytotoxic effect, which was evidenced by an enhancement of DDR, a delayed transition at the G2/M phase in the cell cycle, and cell death. Second, the cell growth-inhibiting effect of apigenin was mediated by mitochondrial dysfunction through excessive ROS, MMP loss and ATP depletion. Third, increased cell death was caused by simultaneous induction of apoptosis and necroptosis. Fourth, compared to the results of 2D cell culture, the occurrence of necroptosis induced by apigenin was confirmed in 3D spheroid culture, although there was no change in the level of cleaved caspase-3.
Clinically, the side effects of chemotherapy are serious. They contribute to relapses and a poor prognosis after receiving chemotherapy. Taking this into consideration, we screened naturally occurring flavonoid compounds showing low toxic properties in normal mesothelial cell line MeT-5A with strong anti-cancer activities against MM cell lines MSTO-211H and H-2452, leading to the identification of apigenin which was subjected to further evaluation. In particular, cisplatin was much less toxic to MM cells at the same treatment concentration compared to apigenin. Extracellular acidification and release through exosomes are considered possible causes of cisplatin resistance [18].
Increased DDR and a transitional delay at G2/M phase of cell cycle analysis, observed in the present study, indicate activation of DNA repair pathways in response to DNA damage. DNA damage signaling can subsequently activate DNA damage checkpoints to stop cell-cycle progression or to eliminate damaged cells through apoptosis [2]. At the center of DNA damage signals are ATM and ATR kinases, which activate checkpoint kinases, CHK1 and CHK2, respectively, followed by phosphorylation of substrates that control DNA repair, checkpoint control, apoptosis, and transcription [2,18]. Moreover, phosphorylation of histone H2A.XSer139, a DSB marker, recruits a number of DDR-related molecules onto damaged chromatins to facilitate DNA repair and checkpoint signaling [19]. The ultimate outcome of the DDR may be cell survival or death. If a cell successfully repairs DNA damage, DDR can be turned off and coaxed in a cell cycle. However, DNA repair failure activates programmed cell death pathways to prevent damaged cells from further replication, eventually removing genetically altered cells. This rationale was support by the concurrence of apoptosis and necroptosis following a transitional delay at G2/M phase in this study.
Apigenin-induced apoptosis has been reported to have effects on MM cells by increasing the activities of p53 and caspase-9 [20]. This effect has been associated with increased ROS production and DNA damage. In our data, induction of apoptosis by apigenin was caspase-dependent, consistent with previous report of Masuelli et al. [20] using in vivo and in vitro models. However, the necroptosis-inducing ability of apigenin through activation of the RIPK3/MLKL pathway has not been previously reported. Some evidence has suggested that targeting non-apoptotic cell death pathways might be an important strategy to develop new anti-cancer therapies since cancer cells can develop resistance to anti-cancer drugs by escaping apoptosis [21]. In this regard, activating necroptosis using agents like apigenin can be an alternative way to overcome anticancer drug resistance, thus killing cancer cells that cannot be killed by apoptosis. In addition, inhibiting both apoptosis and necroptosis after pretreatment of necroptosis inhibitor necrostatin-1 or apoptosis inhibitor Q-VD-Oph-1 has indicated that these two cell death modes are compatible to each other and that the common signals regulating them could be transmitted, although the exact mechanism remains elusive. Similar induction of apoptosis and necroptosis has been observed in ovarian cancer cells co-treated with berberine and cisplatin [22]. Caspase-8 and alternative splicing isoforms of FADD-like IL-1β-converting enzyme-inhibitory protein (cFLIP) such as cFLIPL and cFLIPS have been reported as key molecular mediators that regulate the final outcome of cell death signaling [23,24]. However, the development of additional specific markers is needed to identify the cross-communication of these two cell death modes.
Much is known about ROS as upstream regulators that mediate cell death modes. ROS are byproducts of oxidative phosphorylation in mitochondrial ETC. Mitochondria are also vulnerable to ROS [25]. Emerging evidence has revealed that mitochondrial dysfunction is involved in apoptosis and necroptosis [26]. In the present study, we found that apigenin treatment caused excessive ROS levels with ΔΨm loss and a sharp decline in ATP level. Such effects were significantly prevented by scavenging ROS. Similar to effects of NAC, ATP supplementation also improved cell survival and brought levels of DDR-, apoptosis-, and necroptosis-related proteins back to basal levels. This finding indicates that the cytotoxicity of apigenin through apoptosis and necroptosis is attributed to increased ROS levels and ATP depletion, supporting previous evidence showing that cellular ATP levels can control both cell death processes [27]. In our study, recovery of cell viability and necroptosis-related protein levels by NAC pretreatment in 3D culture was consistent with results of 2D culture in which ROS acted as an upstream molecule of cell death caused by apigenin. In particular, the slightly higher cell survival after treatment with apigenin that is found in the 3D spheroid culture, could be attributed to certain morphological structures of 3D spheroids known to mimic structures in vivo. The absence of apoptosis in 3D cell culture could also affect this discrepancy, although induction of necroptosis was observed in both 2D and 3D cell cultures.
In conclusion, this study showed that apigenin exert a cytotoxic effect on human MM MSTO-211H and H-2452 cells by inducing necroptosis in an acidic environment. This effect of apigenin targets the mitochondria and is mediated by excessive ROS and ATP depletion. These results suggest that apigenin might have potential as a new anti-cancer agent. However, to clearly demonstrate the role of necroptosis in anti-cancer therapy, it is necessary to identify the crosstalk mechanism between necroptosis and apoptosis with the development of specific necroptosis markers and physiologically relevant systems.
Go to :
 XML Download