

 PDF
PDF ePub
ePub Citation
 Print
Print


Introduction
Myopathy is a rare incurable disease of gait ability loss and joint stiffening from muscle weakness and atrophy due to gradual loss of muscle mass. Respiratory care through a respirator may be required for the weakening of the respiratory muscles [1]. Complications suffered by myopathy patients include scoliosis, respiratory diseases, and cardiomuscular diseases, while acute respiratory failure and cardiac conditions caused by respiratory depression, cardiac hypofunction due to muscle weakening, and rachiocampsis are the most common causes of death among these patients [2].
Although there are many genetic factors including chromosomal abnormalities that can cause myopathy, these disorders can also occur as a result of genetic mutations, regardless of family history. In addition, there are a variety of other causes, including inflammation, metabolic abnormalities, endocrine dysfunction, and toxicity. According to the cause, the types of myopathy can be classified as progressive muscular dystrophy, myotonia, inflammatory muscle disease, metabolic muscle disease, or congenital muscle disease [1]. Among these, progressive muscular dystrophy is the most common disorder with poor prognosis, and thus, myopathy in general refers to progressive muscular dystrophy [3].
Since there are no accurate surveys on the current state of myopathy, the number of myopathy patients in Korea cannot be determined accurately [1]. The number of myopathy patients enrolled in the National Health Insurance system is 5,748 [4], but relevant organizations predict that the actual number of patients is higher than the number of officially enrolled patients. The Korea Muscle Disease Foundation (2011) estimates the number of myopathy patients in Korea to be approximately 20,000 and expects the number to steadily increase [1].
In myopathy patients, fat mass increases as the disease progresses, while lean body mass decreases [56]. Moreover, the nutritional state of myopathy patients is generally poor relative to that of healthy individuals, since they perform insufficient physical activity and have excessive body fat making up the body composition, even though the body mass index (BMI) is within the normal range [7].
Therefore, accurately identifying the nutritional state and related factors in myopathy patients, along with providing proper nutrition and implementing weight management, can slow the deterioration of the respiratory and motor functions and delay the onset of musculoskeletal and cardiovascular complications, which in turn can increase the effects of rehabilitation therapy to ultimately improve the life expectancy and quality of life (QOL) in these patients [7].
Recently, bioelectrical impedance analysis (BIA), which indirectly measures body composition by sending a weak current through the body, has come to be seen as a reliable, non-invasive and simple method of measuring various types of body composition. It has also been reported to be highly associated with the patient's clinical outcome. A recent study by Ling et al. [8] found that using BIA and conventional dual-energy X-ray absorptiometry (DEXA) to measure fat-free mass in the body showed a correlation of 96% in males and 95% in females. Therefore, BIA has potential for various future uses in a wide range of nutritional management processes, from nutritional assessment to nutritional intervention.
In Korea, studies that have used BIA in examining nutritional status and clinical disease outcomes include those conducted on hemodialysis [9] and intensive care patients [10], while studies on myopathy patients are almost non-existent. Recently, a study by Kim reported using BIA on amyotrophic lateral sclerosis (ALS) patients, and as such, the need for its utilization is increasing [11].
Moreover, according to a study by Motlagh et al. [12], myopathy patients tend to have nutritional deficiencies due to lack of exercise and difficulties in chewing and swallowing. As a result, they are often unable to meet the recommended nutrient intake (RNI). Thus, accurate nutrition assessment of the subjects in conduction with body composition analysis will provide a better understanding of nutrition and the disease state of the population [12]. Currently, besides the study on the assessment of dietary intake and nutritional status in ALS patients according to the severity of their disease, there are virtually no other in-depth nutrition-related studies being conducted in Korea on the assessment of myopathy patients [11].
Accordingly, the present study aimed to investigate the overall nutritional status of Korean myopathy patients through surveys of diet and dietary habits, BIA, and biochemistry tests, as well as the examination of related factors.
Materials and Methods
Study period and participants
The study was performed from March to September 2015 with approval from the Institutional Review Board at the Yonsei University Gangnam Severance Hospital (No. 3-2015-0003, 2015). The study subjects were myopathy patients who were incapable of walking on their own and/or those who were using an artificial respirator. The exclusion criteria were patients with diminished cognitive function, to the point where they could not complete the survey process and/or patients who had undergone gastrostomy. Seventy-five subjects (65 males and 10 females) provided written informed consent for study participation.
Study design
This study was composed of a questionnaire on general characteristics, a dietary assessment questionnaire [13], nutrient analysis with 24hr recall method (Computer aided nutritional analysis program version 4.0), biochemistry tests (general chemistry and complete blood count), body composition measurement (InBody S10, InBody, Co. Ltd, Seoul, Korea), a QOL measurement questionnaire, and a bowel habit questionnaire.
General characteristics
For the general characteristics of the participants, the patients' gender, age, diagnosis, and anthropometric data (height, weight) were collected via their electronic medical records (EMR). Moreover, height and weight were used to calculate BMI and percentage of ideal body weight (PIBW).
Dietary habits
With the dietary assessment questionnaire from the Korean Dietetic Association [13] as the basis, a survey was conducted using questions related to regular diet, balanced diet, diet, and health.
Nutrient analysis
A trained nutritionist collected a 24-hr dietary recall via a face-to-face interview with the participant or a guardian who was familiar with the details of the patient's diet. Food models were used to aid the recall process in verifying the intake amount. For the nutrient analysis, CAN Pro version 4.0 (Korean Nutrition Society, 2011) was used to calculate consumption of calories, proteins, fat, carbohydrates, vitamins, and minerals based on the food and nutrition database of Dietary Reference Intakes for Koreans 2010 (KDRIs 2010).
Biochemistry test
Nutrition-related biochemistry test results, such as general chemistry and complete blood count were collected from the patients' EMR.
BIA
A BIA device InBody S10 (Biospace Co., Ltd., Seoul, Korea), was used to measure the body components, such as muscle mass and percent body fat. BIA devices are non-invasive and easy to use, and the InBody S10 used in the current study allows measurements to be performed with patients in lying, sitting, and standing positions. Since almost all of the patients in this study required measurements in the lying position, the device was suitable for this study. Measurements were performed with the patient lying down or in a wheelchair, depending on the patient's condition. After entering the patient's height, weight, age, and gender, measurements were taken using the 4-electrode 8-point touch electrode method by wiping the areas where the 8 electrodes would be attached (one each on thumb and middle finger on both hands and one each on both ankles) with electrolyte tissue and connecting the holder electrode. Although it was difficult to obtain measurements with patients' extremities extended straight because of the disease characteristics of myopathy patients, body positions were adjusted as much as possible for the measurements.
QOL
QOL was scored through measurements taken using a Korean version of the World Health Organization Quality of Life-BREF (WHOQOL-BREF). WHOQOL-BREF is a condensed version of WHOQOL-100, which has shown a high correlation (0.89–0.95) and good internal consistency (0.66–0.84) with WHOQOL-100 [14]. WHOQOL-BREF comprises 26 questions regarding physical health (7 questions), psychological health (6 questions), social relationships (3 questions), and environment (8 questions) domains, in addition to the general QOL-related questions (2 questions). Each question uses a 5-point Likert scale, with 1 point for "Not at all" (Very unsatisfied); 2 points for "A little" (Unsatisfied); 3 points for "A moderate amount"; 4 points for "Very much" (Satisfied); and 5 points for "An extreme amount" (Very satisfied). Each score is viewed as having a score intensity of 0% for 1 point; 25% for 2 points; 50% for 3 points, 75% for 4 points; and 100% for 5 points. Since low scores on questions related to pain and discomfort, dependency on medication or medical assistance, and negative thoughts represented higher QOL, the scores for these questions were inverted (1 to 5; 2 to 4; 3 to 3; 4 to 2; and 5 to 1) for analysis, so that all higher scores indicated higher QOL and the score for each domain was expressed as the mean value of scores from the questions in that domain [15].
Bowel habit questionnaire
The internationally recognized Rome Diagnostic Criteria were used to examine patients' bowel habit to determine whether they suffered from functional constipation [1617]. The Rome Diagnostic Criteria were first developed in 1988 and the present study used the latest version, Rome III Diagnostic Criteria, which were revised in 2006. Any patient who satisfied two or more of the below criteria was classified as having functional constipation [18]:
1. Straining during at least 1 out of 4 times of defecations.
2. Lumpy or hard stools in at least 1 out of 4 times of defecations.
3. Sensation of incomplete evacuation for at least 1 out of 4 times of defecations.
4. Manual maneuvers to facilitate at least 1 out of 4 times of defecations.
5. Sensation of anorectal obstruction/blockage for at least 1 out of 4 times of defecations.
6. Fewer than three defecations per week.
Statistical analysis
For descriptive analysis in this study, the mean, standard deviation, and 95% confidence interval were calculated for continuous data, while frequencies and percentages were calculated for categorical data. Correlation analysis results were obtained using Pearson correlation method, while the trends in the ordinal scale between groups were tested using the Jonckheere-Terpstra test. Statistical significance was set at p < 0.05 and all statistical analyses were performed using SPSS version 22.0 or higher (IBM SPSS Statistics for Windows, IBM Corp., Armonk, NY, USA).
Results
General characteristics and anthropometric measurements
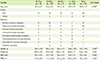
The general characteristics of the participants are shown in Table 1. The study examined the participants according to their age, dividing them into age groups of 10–19 years, 20–29 years, 30–39 years, and ≥ 40 years. Myopathy is a congenital disorder due to genetic factors. It was divided by subjects with age because many cases of age and disease duration are similar. With respect to age group, the greatest number of participants was found in the 20–29 y group, accounting for 37 out of a total of 75 participants. The mean age of all participants was 28.0 ± 11.7 years. There were 65 males (86.7%) and 10 females (13.3%). The mean height and weight of all participants were 157.6 ± 10.5 cm and 43.3 ± 18.0 kg, respectively. BMI by age groups was found to be 16.2 ± 6.4 kg/m2, 15.7 ± 5.8 kg/m2, and 18.0 ± 6.7 kg/m2 in the 10–19 y group, 20–29 y group, and 30–39 y group, indicating all patients in those groups to be underweight, whereas the mean BMI in the ≥ 40 y group was 23.2 ± 7.1 kg/m2, which corresponded to being overweight.
Correlations among general characteristics, blood index, and BIA
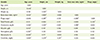
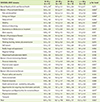
Correlations among the general characteristics, blood index, and BIA are shown in Table 2. Correlation analysis results indicated that increase in age showed significant positive correlations with height (p < 0.01), BMI (p < 0.01), creatinine (p < 0.01), and cholesterol (p < 0.01), whereas, increase in age showed significant negative correlations with albumin (p < 0.01), hemoglobin (p < 0.05), and hematocrit (p < 0.05). Moreover, increase in BMI showed a significant negative correlation with phage angle (PhA) (p < 0.05) while increase in total protein showed a significant positive correlation with PhA (p < 0.05).
Correlations among nutrient analysis, blood index, and QOL
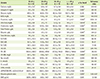
Correlations among nutrient analysis, blood index, and QOL are shown in Table 3. Correlation analysis result indicated that the increased energy intake had significant positive correlations with albumin (p < 0.05) and hemoglobin (p < 0.05). Overall increase in QOL domain scores showed significant positive correlations with vegetable fat intake (p < 0.05), vegetable protein intake (p < 0.05), and dietary fiber intake (p < 0.05).
Biochemistry test results
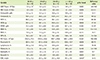
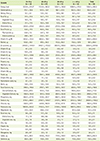
Biochemistry test results are shown in Table 4 and Table 5. With respect to creatine kinase (CK) and CK-MB, which are diagnostic indicators of myopathy, all groups deviated significantly from the reference value range. In all groups, the level of creatinine and total protein appeared to be lower than the reference value range. The level of alkaline phosphatase appeared to be higher than the reference value range in the 10-19 y group and the ≥ 40 y group, while aspartate aminotransferase appeared to be higher than the reference value range in the ≥ 40 y group. Meanwhile, the level of lactate dehydrogenase appeared to be higher than the reference value range in the 10–19 y group and ≥ 40 y group, while B type natriuretic peptide appeared to deviate significantly from the reference value range in the 10–19 y group compared to other age groups. The erythrocyte sedimentation rate (ESR) appeared higher than the reference value range in age groups of 20–29 years, 30–39 years, and ≥ 40 years, except the group of 10–19 years. Levels of remaining blood indices did not deviate significantly from their respective reference value ranges.
QOL assessment
QOL questionnaire scores from the participants are shown in Table 6. In the physical health domain, the scores were 12.4 ± 2.3, 12.2 ± 2.7, 10.6 ± 2.5, and 9.0 ± 3.2 points in the 10–19 y, 20–29 y, 30–39 y, and ≥ 40 y groups, respectively, showing a decreasing trend in physical health domain scores according to increased age (p < 0.01). All age groups of 20–29 years, 30–39 years, and ≥ 40 years, except the group of 10–19 years scored highest in the psychological domain, while the 10-19 y group showed the highest score in the environmental domain. On the other hand, the domain with the lowest scores was the social relationships domain for all age groups except the ≥ 40 y group, which scored the lowest in the physical health domain. Total scores by age group were 63.1 ± 11.5, 62.1 ± 11.6, 60.0 ± 7.7, and 53.2 ± 12.3 in the 10–19 y, 20–29 y, 30–39 y, and ≥ 40 y groups, respectively, showing a decreasing trend in total QOL score according to increased age (p < 0.05).
Average nutrient intake
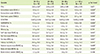
Average nutrient intake results according to nutrient analysis of the participants are shown in Table 7. Energy intake by age group was 1253.9 ± 374.3, 1123.9 ± 382.2, 1226.7 ± 388.8, and 1090.5 ± 275.0 kcal in the 10–19 y, 20–29 y, 30–39 y, and ≥ 40 y groups, respectively, with the mean energy intake of all participants being 1158.0 ± 365.3 kcal. This indicated that all groups had relatively insufficient energy intake according to KDRIs 2010. The mean dietary fiber intake of all participants was 14.6 ± 6.6 g, which represented 58.4% of the 25 g recommended by KDRIs 2010 as sufficient dietary fiber intake for adults. The mean calcium intake of all participants was 412.6 ± 194.8 mg, which represented 55.0% of the 750 mg indicated by KDRIs 2010 as the recommended calcium intake for adults. The mean magnesium intake of all participants was 51.5 ± 31.9 mg, which represented only 14.9% of the 340 mg indicated by KDRIs 2010 as the recommended magnesium intake for adults. Moreover, investigation of dietary supplement intake via the recall method revealed that 12 patients (16%) among the 75 participants were taking dietary supplement(s).
BIA results
The BIA results for all participants are shown in Table 8. PhA value was obtained by the following formula: [PhA = resistance / reactance × (180 / π)]. PhA, which in most people is said to be between the 3–15° range, was below 3° in all groups. Body fat percentage was found to be 29.0 ± 18.9%, 30.4 ± 17.8%, 39.5 ± 13.3%, and 44.3 ± 14.3% in the 10–19 y, 20–29 y, 30–39 y, and ≥ 40 y groups, respectively, showing a tendency for groups with higher age to have higher body fat percentage (p < 0.05).
Dietary habit analysis
Among all participants, the highest response rate for the number of daily meals was seen for two meals (54.7%), while having breakfast everyday (68.0%) and always having regular meals (77.3%) also showed the highest response rates. With respect to eating speed, slow (42.75%) was the most common response and do not overeat (89.3%) was the highest. Survey of all participants regarding food intake showed the highest response rates in the 3 times for the grain group (57.3%), twice for the fish group (45.3%), once or less for the vegetable group (56.0%), once or less for the fat group (56.0%), rarely for the milk group (42.7%), and rarely for the fruits group (49.3%). With the exception of 2 participants, all participants did not consume alcohol and all participants were non-smokers. With respect to exercise status, 93.3% of the participants did not exercise. As for rehabilitative training, 46.7% of the 10-19 y group responded that they participate, while 53.3% responded that they do not, and among all participants, 85.3% were found to be not involved in rehabilitative training. A recent change in dietary habits was reported by 24.0% of participants, and 81.3% responded that they have had some experience with nutritional counseling.
Bowel habits
Results of surveying the constipation status of the participants via a bowel habit questionnaire showed that symptoms of constipation were seen in 9 (64%), 30 (81%), 11 (100%), and 8 (71%) participants from the 10–19 y, 20–29 y, 30–39 y, and ≥ 40 y groups, respectively, indicating that 58 (79%) participants had symptoms of constipation.
Discussion
Myopathy patients manifest clinical symptoms, such as muscle weakness and gait impairment, with most losing their gait ability around the age of 12. Myopathy is a fatal disease that can cause respiratory or cardiac complications, with an average age of mortality of 20 [25]. However, survival has been extended in recent times through proper respiratory care, and long-term nutritional care has also emerged as an important factor in the care of myopathy patients [7].
This study was conducted on 75 myopathy patients hospitalized in a university hospital for the purpose of identifying the overall nutritional status of myopathy patients in Korea through the use of diet and dietary habit surveys, BIA, biochemistry tests, QOL measurement questionnaire, and a bowel habit questionnaire.
In the present study, the energy intake of all participants was found to be insufficient at only 44.5% of KDRIs 2010 [19], whereas protein intake was rather sufficient at 89.8% of KDRIs 2010. According to a study by Kasarskis et al. [20] that examined ALS, a form of neuromuscular disease, the rate of energy intake of ALS patients relative to the recommended daily allowance (RDA) was insufficient at 84%, whereas protein intake was 126%, indicating greater nutrients intake than the RDA. A study by Kim et al. [11] also found that 64% of the study subjects had a relative energy intake of < 75% compared to the estimated energy requirement, and 47% had a relative protein intake of < 75% compared to the average protein requirement, indicating that more than half of the patients showed insufficient energy intake, while showing sufficient protein intake. The findings in the present study also showed similar patterns to the previous studies [1120]. It is believed that the reason why protein intake was not lacking was that the study participants mostly consumed foods with soft texture such as tofu and eggs.
Dietary fiber intake of participants in the present study was found to be 58.4% of the sufficient dietary fiber intake for adults suggested by KDRIs 2010, indicating insufficient intake of dietary fiber. Among the participants, only 10% of patients had daily vegetable intake of ≥ 3 times while 56.0% of patients had daily vegetable intake of ≤ 1 time, and such insufficient dietary fiber intake seems to be the result of insufficient intake of vegetables, seaweed, and mushrooms due to chewing difficulties.
Moreover, calcium intake was found to be 55.0% of the recommended intake for adults according to KDRIs 2010, which was related to 42.7% of the participants having daily dairy product intake of ≤ 1 time, and such results were believed to be the outcome of insufficient intake of milk and dairy products, the food sources of calcium, as well as insufficient intake of other sources of calcium, such as anchovies and green vegetables due to chewing difficulties. According to a study by Murakami et al. [21], insufficient intake of magnesium is associated with the increased prevalence of functional constipation in 18–20-year-old Japanese women. Since it was also found that magnesium intake in the participants was insufficient at 14.9% of KDRIs 2010, and 79% of the participants had functional constipation in this study, it is believed that magnesium intake insufficient and functional constipation are associated. Moreover, it is believed that the reason for insufficient magnesium intake can be attributed to sources of magnesium, such as whole grains, green vegetables, and nuts not being readily consumed due to chewing difficulties.
With respect to QOL, overall increase in QOL domain score showed significant positive correlations with vegetable fat intake, vegetable protein intake, and dietary fiber intake, which indicated an association between QOL and a vegetarian diet. It is believed that a higher QOL score reflects the fact that chewing function in participants who were able to consume vegetables was much better than in those who were unable to consume vegetables. Moreover, in a study by Lee et al. [22] on the overall QOL levels of people with spinal injuries, a significant difference in QOL score was seen between youth and middle-aged groups, with the youth group showing higher overall QOL. A closer examination of the result demonstrated that the youth group obtained significantly higher QOL scores than the middle-aged group in QOL sub-domains of overall health and assessment of QOL, as well as in physical health and environmental domains. These findings were similar in pattern to the study result that showed decreased QOL score according to increased age of the participant, where increased age resulted in lower scores in both overall QOL level and the physical health domain.
In BIA, PhA and extracellular water/total body water (ECW/TBW) have been reported by precedent studies to be indicators of survival and prognosis, as well as effective indicators for determining nutritional status, and among all measuring values in BIA, they are least affected by other factors. Theoretically, PhA is an indicator that reflects the health status of cells or cell membranes. Increase in the completeness and functionality of the cell membrane structure increases PhA, whereas structural damage to the plasma membrane or decreased selective barrier function can lead to decreased PhA. According to a study by Joao [23], PhA is within a range of 3–15° in most people, while Kyle et al. [24] had suggested 5.0° for males and 4.6° for females as the PhA cutoff values for sensitive determination of nutritional status. If this is applied to the present study, since the mean PhA of all participants was found to be 2.49 ± 0.93°, it would be considered below the cutoff value, reflecting the seriousness of the disease in those myopathy patients. A significant positive correlation between PhA and total serum protein is considered to have demonstrated the potential applicability of PhA as an indicator in nutritional status assessment, and as such, further studies on changes in PhA are deemed necessary. Moreover, according to a study by Kim [9], ECW/TBW is used as an edema index, and analysis was conducted by classifying patients with an edema index of < 0.40 as the euvolemic group and an index of ≥ 0.40 as the hypervolemic group. The mean ECW/TBW value in the present study appeared higher than 0.40, which is believed to show a similar pattern to a previous study that reported such results meant total body fluid and intracellular fluid level were lower, rather than confirmation of the presence of edema [9].
For proposing dietary guidelines for myopathy patients through the findings in the present study, the evidential basis for such action is somewhat lacking. However, it is believed that as a study that examined nutrient analysis and the dietary habits of myopathy patients in Korea, the present study can be meaningful as a precedent study for future studies that aim to present dietary guideline for patients suffering from rare and incurable muscle diseases. Development and intake of foods with high nutrient density are considered necessary for patients suffering from chewing difficulties, and since only 16% of the participants were found to consume nutritional supplements, it is necessary to recommend supplementing energy intake through the intake of high-density nutritional supplements. Moreover, in order to supplement energy and magnesium, the intake of which was found to be insufficient, follow-up intervention studies on methods for effectively increasing energy intake through the development of easy-to-chew foods, such as groundnuts that are a food source of magnesium, are needed.
Conclusion
The energy intake of all participants was 44.5% of Dietary Reference Intakes for Koreans 2010 (KDRIs 2010), whereas protein intake was 89.8% of KDRIs 2010, which indicated that energy intake was insufficient, while protein intake was satisfactory. Dietary fiber intake was found to be 58.4% of sufficient dietary fiber intake for adults according to KDRIs 2010. With respect to QOL, overall increase in QOL domain score showed significant positive correlations with vegetable fat intake, vegetable protein intake, and dietary fiber intak, which indicated an association between QOL and a vegetarian diet. With respect to BIA, the mean phage angle of all participants was found to be 2.49 ± 0.93°, which was below the cutoff value, and this was considered to reflect the seriousness of the disease in those myopathy patients. The present study is meaningful in providing the basic data for future studies that aim to present dietary guidelines for patients suffering from rare and incurable muscle diseases.

 XML Download