Abstract
Recently, studies on mitochondrial DNA (mtDNA) have increased rapidly. Conventional parameters, such as diversity index, pairwise comparison, are used to interpret and validate data on autosomal DNA; however, the use of these parameters to validate data from mitochondrial DNA databases (mtDNA DBs) needs to be verified because of the different transmission patterns of mtDNA. This study was done to verify the use of these conventional parameters and to test the “coverage concept” for a new parameter. The mtDNA DB is not very big; however, it is necessary to check how the change in parameters corresponds to the DB size. For this, we artificially rearranged a Korean DB into several small sub-DBs of variable sizes. The results show that the diversity in nucleotide variations and the different haplotype numbers do not vary as the size of DB increases. However, the “coverage”changed a lot. The coverage increased from 0.113 in a DB of 100 people to 0.260 in a DB of 653 people. Additionally, using the “coverage concept”, we predicted how the total number of haplotypes changed with variations in the sub-DB size and compared the predicted result with final result. In conclusion, “coverage”, in addition to conventional statistical parameters, can be used to check the usability of an mtDNA DB. Finally, we tried to predict the size of the whole mtDNA number in Korea using “saturation concept”.
REFERENCES
1. Torroni A, Achilli A, Macaulay V, et al. Harvesting the fruit of the human mtDNA tree. Trends Genet. 2006; 22:339–45.

2. Torroni A, Schurr TG, Cabell MF, et al. Asian affinities and continental radiation of the four founding Native American mtDNAs. Am J Hum Genet. 1993; 53:563–90.
3. Egeland T, B�velstad HM, Storvik GO, et al. Inferring the most likely geographical origin of mtDNA sequence profiles. Ann Hum Genet. 2004; 68:461–71.

5. Huang SP, Weir BS. Estimating the total number of alleles using a sample coverage method. Genetics. 2001; 159:1365–73.

6. Egeland T, Salas A. Estimating haplotype frequency and coverage of databases. PLoS one. 2008; 3:e3998.

7. Tajima F. Statistical method for testing the neutral mutation hypothesis by DNA polymorphism. Genetics. 1989; 123:585–95.

8. Pereira L, Cunha C, Amorim A. Predicting sampling saturation of mtDNA haplotypes: an application to an enlarged Portuguese database. Int J Legal Med. 2004; 118:132–6.

9. Pfeiffer H, Brinkmann B, Hu ¨hne J, et al. Expanding the forensic German mitochondrial DNA control region database: genetic diversity as a function of sample size and mi-crogeography. Int J Legal Med. 1999; 112:291–8.

10. Haas PJ, Ko ¨nig C. A bi-level Bernoulli scheme for database sampling. In proceedings of the 2004 ACM SIGMOD international conference on Management of data. ACM. 2004. 275–86.
11. Mao CX. Predicting the conditional probability of discovering a new class. JASA. 2004; 99:1108–18.

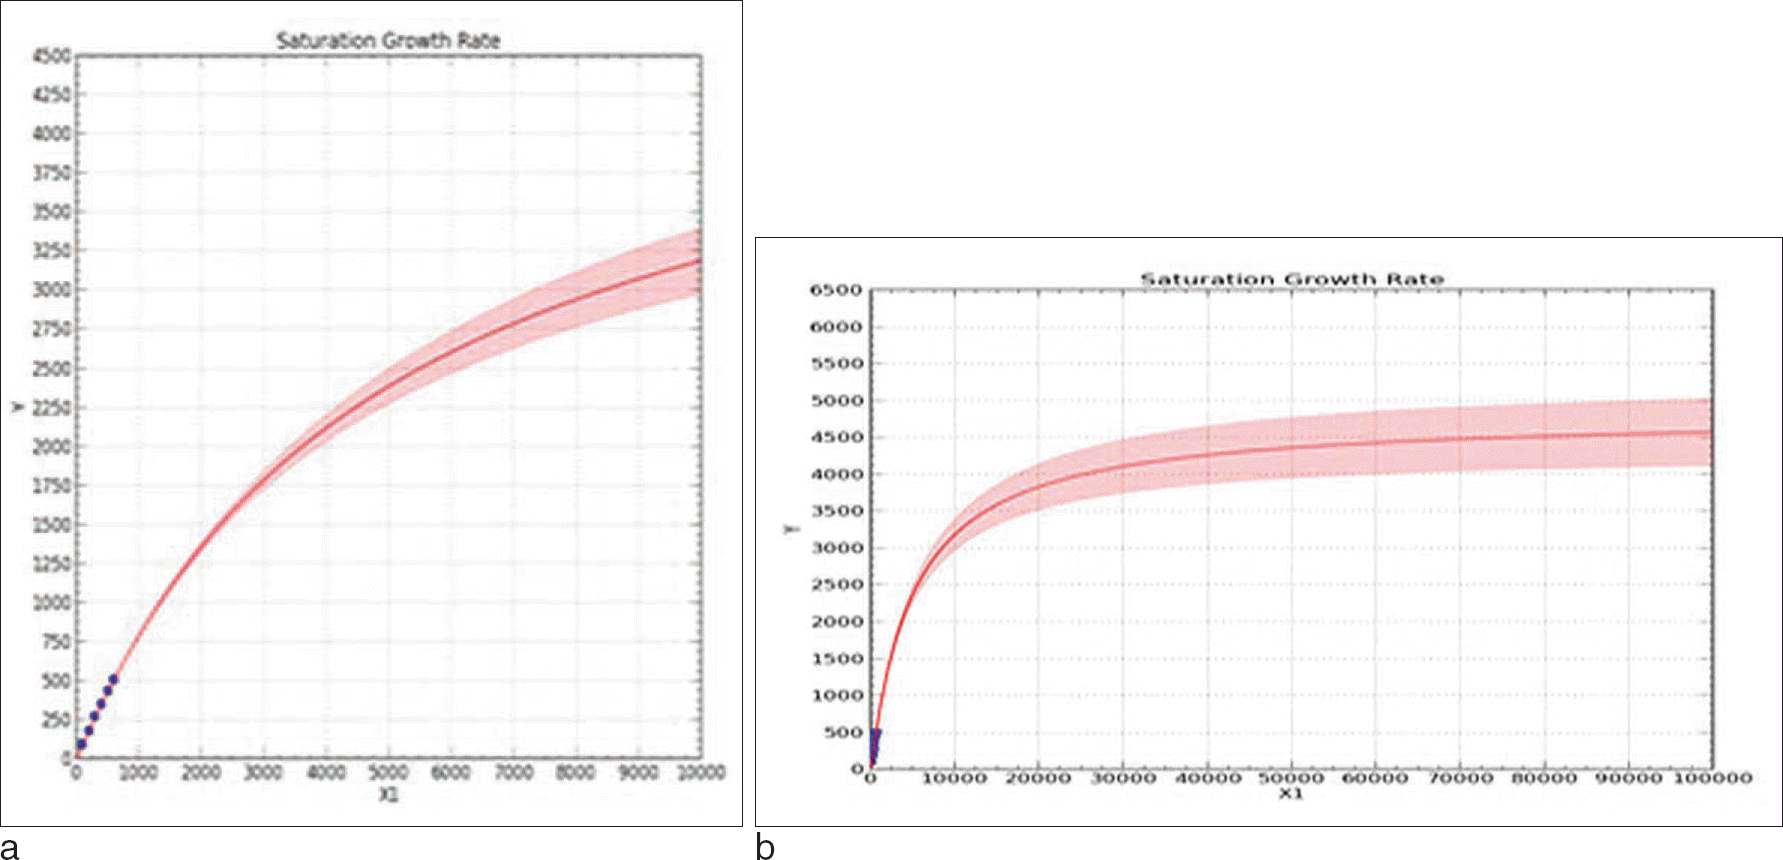
Fig. 1.
Saturation curves of expanded sample sizes. a. Expanded up to 10,000 people b. Expanded up to 100,000 people A result of examining the number of possible observed haplotypes when group size increased up to 10,000, 100,000, the final expected number of haplotypes was 4,500 over. The shaded portion of the graph is the confidence interval upper and lower limits.

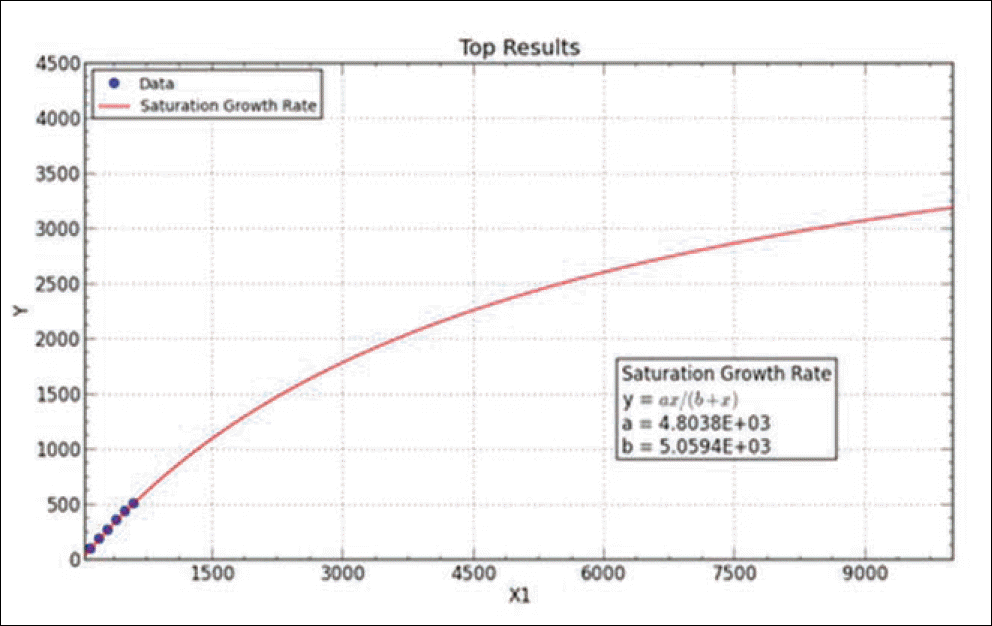
Fig. 2.
Result of simulated saturation curve from N. of observed haplotypes. Graph is obtained by curve expert professional 1.6.5 version. The fit converged to a tolerance of 1e-006 in 5 iterations. No weighting is used.

Table 1.
Primers used to Sequence the D-loop of mtDNA
Table 2.
Variation of Sequence Diversity and Number of Sequence Changes at each Sample Sizes∗
| HV Ⅰ | HV Ⅱ | HV Ⅰ+HV Ⅱ | D-loop | |||||
|---|---|---|---|---|---|---|---|---|
| n† | H† | n | H | n | H | n | H | |
| N§= 100 | 82 | 0.9419 | 46 | 0.8685 | 128 | 0.9509 | 154 | 0.963 |
| N = 200 | 96 | 0.0944 | 47 | 0.8750 | 143 | 0.9522 | 172 | 0.9627 |
| N = 300 | 113 | 0.9438 | 60 | 0.8737 | 173 | 0.9521 | 210 | 0.9630 |
| N = 400 | 125 | 0.9465 | 71 | 0.8693 | 196 | 0.9523 | 237 | 0.9632 |
| N = 500 | 129 | 0.9465 | 72 | 0.8730 | 201 | 0.9523 | 240 | 0.9629 |
| N = 600 | 135 | 0.9460 | 75 | 0.8718 | 210 | 0.9525 | 258 | 0.9632 |
| N = 653 | 139 | 0.9454 | 84 | 0.8763 | 223 | 0.9533 | 266 | 0.9636 |
Table 3.
Number of observed Haplotypes and Comparison of Statistic Parameters∗
| No. of Observed Haplotypes | ||||||||||||
|---|---|---|---|---|---|---|---|---|---|---|---|---|
| Total | H† | C† | CI§ | f1‖ | f2‖ | f3‖ | f4‖ | f5‖ | f6‖ | f7‖ | f8‖ | |
| N = 100 | 93 | 0.9894 | 0.113 | (0.065~0.159) | 86 | 6 | 1 | 0 | 0 | 0 | 0 | 0 |
| N = 200 | 183 | 0.9939 | 0.123 | (0.083~0.151) | 171 | 11 | 0 | 0 | 0 | 0 | 1 | 0 |
| N = 300 | 269 | 0.9954 | 0.168 | (0.130~0.195) | 246 | 18 | 4 | 0 | 0 | 0 | 1 | 0 |
| N = 400 | 351 | 0.9970 | 0.207 | (0.177~0.233) | 313 | 30 | 5 | 2 | 0 | 0 | 0 | 1 |
| N = 500 | 433 | 0.9978 | 0.223 | (0.196~0.247) | 382 | 36 | 11 | 2 | 0 | 1 | 0 | 1 |
| N = 600 | 509 | 0.9983 | 0.252 | (0.227~0.275) | 443 | 47 | 13 | 4 | 0 | 0 | 0 | 2 |
| N = 653 | 546 | 0.9979 | 0.260 | (0.239~0.281) | 477 | 48 | 14 | 3 | 2 | 0 | 0 | 2 |
Table 4.
Comparison of Coverage by the Way Simulated and Nonselected DB Showing no Significant Selection Effect
| Sim-1∗ | Sim-2∗ | Non-selected† | |
|---|---|---|---|
| N = 100 | 0.050 | 0.020 | 0.113 |
| N = 200 | 0.132 | 0.130 | 0.118 |
| N = 300 | 0.138 | 0.145 | 0.166 |
| N = 400 | 0.180 | 0.200 | 0.205 |
| N = 500 | 0.219 | 0.247 | 0.222 |
| N = 600 | 0.253 | 0.272 | 0.252 |
| N = 653 | - | - | 0.26 |
Table 5.
Unique Haplotype Comparison between Observed One and Estimated One using Mao Equation
The estimated values were calculated from the equation Δ(t) = f1t-f2t2+f3t3--….
This formula is valid t ≤ 1 and t = 1 corresponds to a doubling size. The column M (t = 1) are the estimated values when the expected number of the doubled size, M (t = 0.5) are the 1.5 times, M (t = 0.25) are the 0.5 times. The result of the qui-square test, p value was 0.97 (α= 0.05). For N = 100 ~ N = 653, total means sum of the number of observed haplotypes within each data size. For N ≥ 800 only estimated one was presented. The bolds mean estimated value using Mao equation.


 PDF
PDF ePub
ePub Citation
 Print
Print


 XML Download