

 PDF
PDF ePub
ePub Citation
 Print
Print


Introduction
Obesity is defined as medical condition where there is an excessive fat accumulation that may harm health. For instance, it is associated with increased risk of diabetes, hypertension, cardiovascular disease, cancer, liver disease, sleep apnea and respiratory problems.12 To classify for obesity or overweight, body mass index (BMI) has been commonly used. BMI is a simple index of weight-for-height and calculated as a person's weight in kilograms divided by the square of height in meters (kg/m2). For adults, World Health Organization (WHO) established cut-point for overweight and obesity by using BMI greater than or equal to 25 kg/m2 and 30 kg/m2 respectively.3
However, BMI is inaccurate and indirect measures for obesity assessment, because it does not consider the fat distribution. Aging is associated with increase in central and intra-abdominal fat, combined with decrease in lower body subcutaneous fat.4 These age-related changes in body composition can occur independent of changes in total adiposity, weight or waist circumference.5 Especially for postmenopausal women, estrogen deficiency essentially contributes to obesity, because estrogen plays a vital role in fat storage and distribution.6 Before menopause, estrogen deposits fat in thigh, hips, and buttocks. During and after menopause, decrease in estrogen leads to an overall increase in total body fat (TBF) but now more so in central portion.7 In addition, BMI does not reflect sex, age, or race differences, so it should be considered when clinically applied. For instance, in Western populations, WHO defines the obesity as a BMI greater than or equal to 30 kg/m2 and obesity is a key risk factor for diabetes.89 But Asian populations generally have a higher percentage of body fat than do Western populations at the same BMI levels.10 Therefore overweight is defined as a BMI from 23.0 kg/m2 to 24.9 kg/m2 and obesity as a BMI greater than or equal to 25 kg/m2 by 2014 guideline of the Korean Society for the Study of Obesity.11
There are many techniques to measure the body composition. Whole body dual-energy X-ray absorptiometry (DXA) provides precise measurement of body fat composition, but DXA is very expensive and limited to use. Instead, other more accessible techniques such as bioelectrical impedance analysis (BIA) are commonly used by clinicians. There is a significant correlation between the percentage of TBF by DXA and the one measured by BIA.12
The aim of this study is to evaluate the validity of BMI standards relative to TBF and to estimate new BMI criteria that correspond to TBF for obesity, especially for postmenopausal women.
Materials and Methods
1. Study design and population
A total 5,930 women participated in this cross-sectional study who visited to the health promotion center at Pusan National University Hospital in Busan, Korea between 2008 and 2014. Patients with uncertain medical information were excluded from analysis. Finally 3,936 patients were included in this study, including 1,565 premenopausal and 2,371 postmenopausal women.
At the time of visit, demographic data and information were collected through self-report questionnaires and interviews with healthcare providers. Menopause was defined as the time when there has been no menstrual periods for 12 consecutive months or as status of both ovarian resection. In case of the patients with previous hysterectomy, serum follicle stimulating hormone level over 40 mIU/mL was defined as menopause state. All the medical records and data used for this study were given consent by each patient.
2. Anthropometric measurements
Height, weight, and waist circumference were measured separately and BMI was calculated as weight in kilograms divided by height in meters squared. Obesity index (%) was calculated as weight divided by standard weight multiplied by 100. Muscle mass (kg) and TBF ratio (%) were obtained from BIA with X-scan plus II (Jawon Medical Co., Ltd., Seoul, Korea).
In this study, we defined overweight as a BMI from 23.0 to 24.9 kg/m2 and obesity as a BMI greater than or equal to 25 kg/m2 based on BMI classifications suggested by 2014 guideline of the Korean Society for the Study of Obesity.11 On the other hand, there is no consensus on cut-point for obesity according to TBF. According to previous report by Kim et al.,13 cutoffs of percentage body fat for predicting obesity-related cardiovascular disease risk factors in Korean women is 32%. We here settled the range of TBF from 25% to 40% at interval of 1% and investigated the new BMI cutpoint.
3. Statistical analysis
R program version 3.3.2 (R Foundation for Statistical Computing, Vienna, Austria) was used for statistical analysis. All data were presented as mean ± standard deviation. Independent t test or Wilcoxon rank sum test was used for continuous variables in comparisons of two groups. P value < 0.05 is considered as statistically significant. Sensitivity, specificity, positive predictive value (PPV), negative predictive value (NPV) and Youden's index were used to assess the validity of BMI-defined obesity and to establish optimal BMI cut-point by using MedCalc version 18 (MedCalc Software, Mariakerke, Belgium).
Results
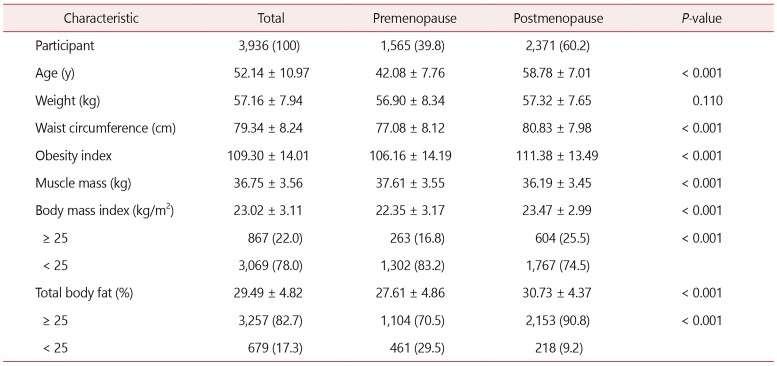
Table 1 presents the demographic characteristics of the study participants. A total 3,936 women were included in this study, composed of 1,565 (39.8%) premenopausal women and 2,371 (60.2%) postmenopausal women. There were statistically significant differences in parameters of age, waist circumference, obesity index, muscle mass, mean BMI and mean TBF (all P < 0.001). By comparison, there was no significant difference in body weight.
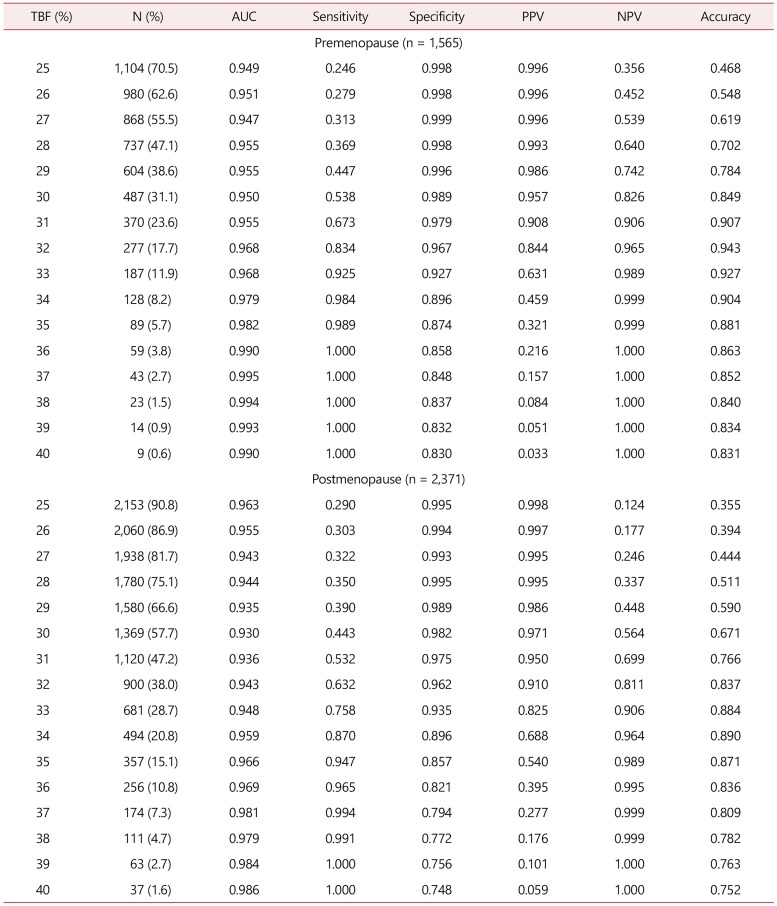
Table 2 demonstrates the validity of BMI cut-point of 25 kg/m2 comparing to TBF reference values ranging from 25% to 40%. All of the area under the curve (AUC) values exceed 0.9. The highest value of AUC for premenopausal women is TBF 37% (0.995). The AUC of TBF 40% is highest in postmenopausal women (0.986). The sensitivity and specificity ranged from 24.6% and 99.8% for TBF 25% to 100% and 83.0% for TBF 40% in premenopausal women. In case of postmenopausal women, the sensitivity and specificity ranged from 29.0% and 99.5% for TBF 25% to 100.0% and 74.8% for TBF 40%.
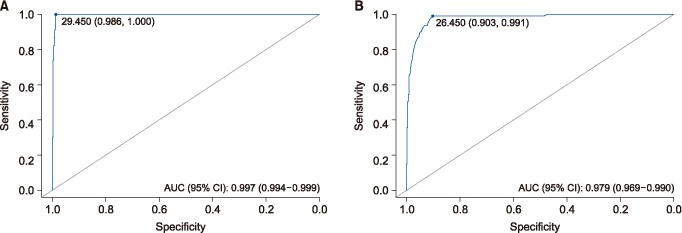
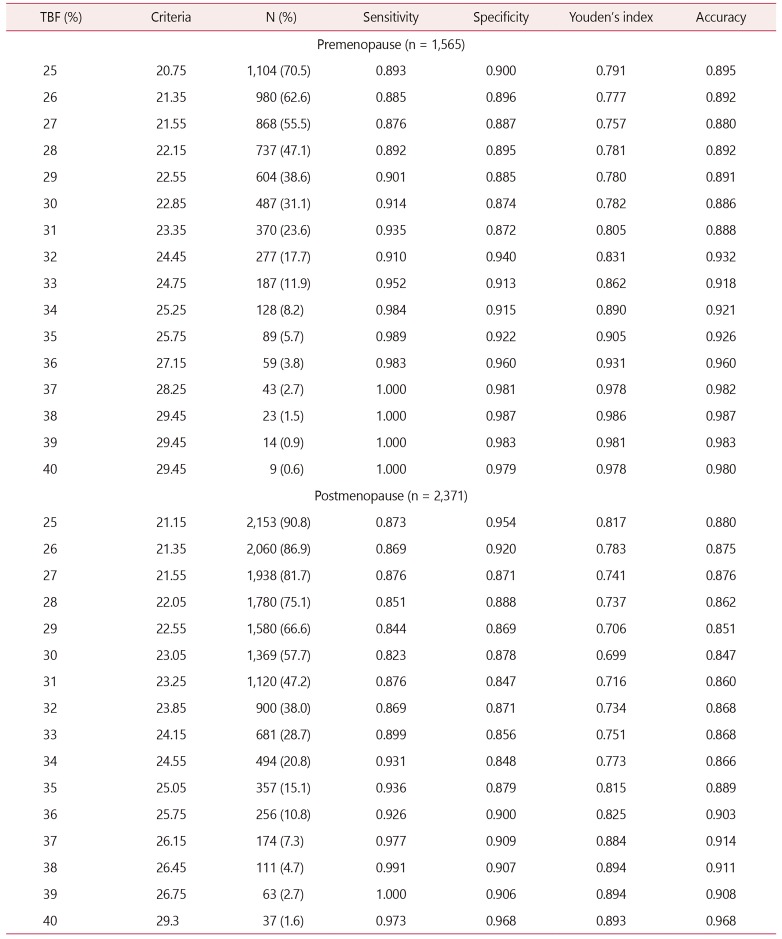
Table 3 demonstrates the empirical optimal BMI cut-point to define obesity by using Youden's index and overall accuracy. In premenopausal women, TBF ≥ 38% indicated the highest Youden's index (0.986) and corresponding BMI value was > 29.45 kg/m2. In comparison, postmenopausal women who were TBF ≥ 38% and 39% showed the same highest Youden'sindex (0.894). Out of them, TBF ≥ 38% had higher overall accuracy (0.907) and corresponding BMI value was > 26.45 kg/m2.
Discussion
As for defining obesity, the results of this study indicate that current BMI criteria are too low for Korean women and there is a difference depending on menopausal status of women.
In this study, the prevalence of obesity was quite different between premenopausal and postmenopausal women. In premenopausal women, 263 patients were obese by BMI and the prevalence was 16.8%. By comparison, 604 postmenopausal women were obese and the prevalence was 25.5% (P < 0.001). The proportion of TBF ≥ 25% in premenopausal and postmenopausal group was 70.5% and 90.8%, respectively (P < 0.001). In common, the rate of obesity was higher in postmenopausal group. Chang et al.14 showed similar results that BMI and TBF percentage were significantly increased through menopausal transition.
We evaluated the validity of BMI cut-point of 25 kg/m2 comparing to TBF reference values from 25% to 40% at interval of 1%. In Table 2, all AUC values for each TBF exceed 0.9. Therefore, BMI-defined obesity (≥ 25 kg/m2) is quite good diagnostic test.
As TBF reference value increases from 25% to 40%, the sensitivity increases and the specificity decreases. However, the degree of sensitivity increase (+75.4% in premenopausal women, and +71.0% in postmenopausal women) was much higher than that of specificity decrease (−16.8% in premenopausal women and −24.7% in postmenopausal women). These results mean that by using TBF, we can define obese women who are truly obese. Also, PPV values of both groups have a larger variation than NPV values. It means that the probability that someone who is truly non-obese is classified as non-obese will be raised by using TBF.
We demonstrated the optimal BMI cut-point to define obesity by using Youden's index and overall accuracy in Table 3. In premenopausal women, TBF ≥ 38% indicated the highest both Youden's index and overall accuracy, and corresponding BMI value was 29.45 kg/m2. In comparison, postmenopausal women who were TBF ≥ 38% showed the highest Youden' s index and overall accuracy, and corresponding BMI value was 26.45 kg/m2 (Fig. 1). Youden's index is defined as the difference between the true positive rate and the false positive rate. It means the likelihood of a positive test result in subjects with the condition versus those without the condition. Maximizing this index allows to find an optimal cutoff point from receiver operating characteristic (ROC) curve independently from the prevalence. This index has a value between 0 (worthless test) and 1 (perfect test).15
Banack et al.16 demonstrated that the empirical optimal BMI cut-point to define obesity is 26.49 kg/m2 for TBF > 38% in postmenopausal women. In our report, it showed similar results as the corresponding BMI cut-point for TBF ≥ 38% is 26.45 kg/m2. Considering that most of the patients who participated in Banack et al.'s study were White, we might assume that the body shape of Koreans is gradually becoming Western. Also, it may reflect that BMI criteria currently being applied on the Asian is too low and should be applied on the basis of 30 kg/m2 just like Westerners.
This study has some limitations. First, we used BIA instead of DXA for body fat percentage measurement. Previous studies found that BIA was less accurate than DXA17; however, recent studies shows that there is high level of correlation between two methods when measuring TBF percentage.1218 Although DXA is the most accurate way to measure fat composition, there is no choice but to use BIA in real clinical practice due to cost or accessibility issues.
Second, there is no exact information on participants' race or ethnicity. But it is highly likely that most of them are Korean, and as far as we know, there has been no study that compares BMI and TBF for obesity in Korean. Especially, we intended to reflect the fat disposition according to status of menopause.
Third, range of age is too narrow because the proportion of 20s or 30s is extremely low. Yet, there is significant difference between premenopausal and postmenopausal women (P < 0.001), so ti is meaningful in this respect.
In conclusion, though BMI has been commonly used in epidemiological study because it is simple to apply and it has correlation with body fat percentage, we should consider that this relationship is significantly influenced by age and gender.19 The percentage of body fat, irrespectively of body weight itself, is associated with obesity-related diseases such as hypertension, diabetes, dyslipidemia, metabolic syndrome and cardiovascular disease.20 BMI is good diagnostic test, but by using TBF standards, the change that we can define obese women who are truly obese and someone is classified as non-obese who is truly non-obese will be higher. In this study, we established new BMI cut point according to TBF. BMI > 29.45 kg/m2 and BMI > 26.45 kg/m2 are suitable to define obesity for premenopausal and postmenopausal women, respectively.
Further studies that evaluate the validity of these BMI cutpoint values according to obesity-related diseases should be conducted.
 XML Download