

 PDF
PDF ePub
ePub Citation
 Print
Print


Introduction
Since Bowen introduced composites in 1962, composite resins have almost replaced amalgam for dental restorations because of the remarkably improved aesthetics and excellent mechanical properties.1 However, the dimensional stability of the esthetic composite restorative material is compromised by the polymerization reaction of the matrix phase. The conversion of the monomer molecules into a polymer network is accompanied with a closer packing of the molecules, which leads to polymerization shrinkage. Polymerization shrinkage of composite resin leads to many clinical problems such as marginal staining, recurrent caries and restoration failure at the restoration/tooth interface, and remains a major concern for the clinical performance of restorations using composite resins.2,3 Considerable efforts have been made to slow or eliminate polymerization shrinkage in composite resins. Recently, a new silorane-based low-shrinkage composite resin was introduced to dentistry.4,5,6,7 Silorane has the configuration of siloxane and oxirane molecules. Siloxane molecules are hydrophobic, so silorane-based composite resin is expected to exhibit a reduced water sorption and water-mediated exogenous discoloration. A low shrinkage property can be achieved by oxirane molecules that extends their linkage through ring-opening, flattening and extending toward each other.8
The curing depth of composite resins is related directly to their thickness.9,10,11 It can also affect the amount of photons from light source received at the top and bottom surfaces of resin composite restoration. Because the polymerization process is initiated by external light, variations in the transmission and attenuation of incident light between specimens of different thicknesses can have a range of outcomes. Research on the polymerization in the transmission and attenuation of the light that passes through the various thicknesses of the silorane-based composite resin is quite limited.
Furthermore, evaluating the degree of polymerization in the specimen surface is important for the proper placement of restorative materials. Factors, such as the organic matrix composition, type and amount of filler particles and the refractive index of the polymeric matrix, can affect the light transmittance and the degree of polymerization of composite resins.12,13 The surface hardness was evaluated to verify indirectly the degree of conversion of composite resins. The degree of polymerization of light-activated composite resins is important for their clinical success and directly affects their mechanical properties. Several studies have documented the degree of polymerization of Bis-GMAbased composite resins, and stated that it is important to compare silorane-based composite resins.9,10,11,12,13,14,15
The present study examined the influence of resin thickness on the degree of polymerization of silorane-based composite resin.
Materials and Methods
One silorane-based (Filtek P90, 3M ESPE, St. Paul, MN, USA) and two methacrylate-based (Filtek Z250 and Z350, 3M ESPE) composite resins were used. Table 1 lists their compositions.
Light-curing unit (LCU) and photon count
For light curing, a quartz-tungsten-halogen (QTH)-based LCU (Optilux 501, Kerr, Danbury, CT, USA) was used with an intensity of 900 mW/cm2, as measured using a built-in radiometer. The tip of LCU was conventional type. To measure the number of photons, specimens of different thicknesses (diameter, 7 mm; thickness, 1, 2 and 3 mm) were prepared and placed over a 1 mm-thick stage with a 6 mm-diameter hole on it. Light was irradiated continually from the top surface of the hole. A photodiode detector (M1420, EG&G PARC, Princeton, NJ, USA) connected to a spectrometer (SpectroPro-500, Acton Research, Acton, MA, USA) was placed under the hole in a fixed position to consistently measure the photons.
Vikers Microhardness measurement
Disc-shaped specimens (diameter, 4 mm; thickness, 1, 2 and 3 mm) were prepared to evaluate the surface microhardness of the specimens (n = 5). A 200 µm-thin slide glass was placed on the table. A metal mold was placed over the glass and packed with composite resin. After packing, the top surface of the mold was covered with a thin slide glass, pressed firmly and light-cured using the LCU for 40 senconds by placing the end of the light-guide in contact with the top surface of the slide glass. After light-curing, the specimens were removed from the mold and kept in a dark chamber at 37℃ for 24 hours. The microhardness of the top and bottom surfaces was measured (n = 15) using a Vickers hardness tester (MVK-H1, Akashi Co., Tokyo, Japan) with a 200 gf load and a 15-second dwell time. The microhardness of the top and bottom surfaces measured three times each on specimen.
Degree of conversion (DC)
The specimens (n = 5 for each condition) prepared for the microhardness measurement were also used to evaluate the DC (%). The DC of the specimens was determined by Fourier transform infrared (FTIR) spectroscopy (Nicolet 6700/8700, Thermo Fisher Scientific Inc., Waltham, MA, USA). Immediately after measuring the microhardness, the top and bottom surface of each specimen was scratched (thickness of 100 - 150 µm) using a scalpel to obtain a powder. The collected powder was dissolved in ethanol for transmission FTIR spectroscopy. The spectra were taken from 7,800 - 350 cm-1 after 32 scans with a 0.09 cm-1 resolution. The DC of the cured resins was evaluated using a baseline technique. For the methacrylate-based composite resins, the peak from the aliphatic C=C bonds (at 1,636 cm-1) and reference C-C aromatic ring bonds (at 1,608 cm-1) were determined. For the silorane-based composite resin, the stretching vibrations of the epoxy rings C-O-C (883 cm-1) and reference CH bond (1,257 cm-1) were chosen. Uncured resins were tested in a similar manner.
Refractive Index
The refractive index of the specimens was measured using a commercial Abbe-type refractometer (NAR-IT, ATAGO, Tokyo, Japan). For the measurement, a small amount of resin was sandwiched between 2 glass slides placed below the mold (thickness, 1, 2 and 3 mm), and light was irradiated from the top of the mold to the bottom for 40 seconds. The light-cured thin slabs were aged for 24 hours in a 37℃ dark chamber. One drop of monobromonaphthalene (nD = 1.64) was added to the specimens as a high refractive index interfacial contact agent. The milky-white refractor was then placed over the specimen to enhance diffuse scattering of the cured specimen. Diffuse scattering at the front surface is necessary to improve the measurement accuracy. Unless otherwise noted, refractive index readings were performed at room temperature (22.5 ± 1.0℃). The system used in this study gives light from the sodium D-line (589 nm).
Polymerization shrinkage measurement
A linometer was used (RB 404, R&B Inc., Daejeon, Korea) to measure the level of polymerization shrinkage (n = 5) during and after light irradiation. The measurement system was composed of a specimen holder, curing light, shrinkage-sensing part, software and computer. A Teflon (PTFE, polytetrafluoroethylene) disc mold (inner diameter, 4 mm; thickness, 1, 2 and 3 mm) was placed over the aluminum disc (the specimen stage) and filled with resin. The Teflon mold was removed after being filled completely with resin. A slide glass was then secured over the resin, so the resin was placed between the covering slide glass and aluminum disc on the specimen holder. The end of the light guide was placed in contact with the slide glass. Before light curing, the initial position of the aluminum disc was set to zero. Light was irradiated from the LCU for 40 seconds. As the resin polymerized, it shrank toward the light source and the aluminum disc under the resin moved toward the light source. The amount of disc displacement due to polymerization shrinkage was measured automatically for 130 secodns using an inductive gauge. A non-contacting type shrinkage sensor was used in this study. The resolution and measurement range were 0.1 µm and 100 µm, respectively.
Results
Photon count
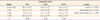
Table 2 lists the number of photons detected at the specimens with different thicknesses and attenuation coefficients (µ, mm-1) after exponential-curve fitting. In the subsurface, the incident light (photons) decreased exponentially. Among the specimens, P90 showed less light attenuation than the other two resin products.
Degree of conversion
Table 3 lists the DC of the specimens tested at the different depths. Among the specimens, P90 showed the highest DC at all depths. The results revealed a correlation between the specimen thickness and DC. Each resin product showed an inverse linear correlation between DC and depth (R = 0.98 - 0.99) with similar slopes.
Vickers Microhardness
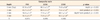
Table 4 presents the microhardness of the specimens at the surface of different depths. Among the specimens, P90 and Z250 showed the lowest (54.1 - 67.8 Hv) and highest (73.9 - 86.1 Hv) microhardness, respectively. According to curve fitting, the microhardness and specimen thickness showed an inverse correlation (R = 0.975 - 0.995) regardless of the resin products.
Polymerization shrinkage
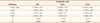
Table 5 shows the polymerization shrinkage of the specimens with different thicknesses. Among the specimens, P90 showed significantly lower shrinkage (6.5 - 10.4 µm) than the other two resin products (p < 0.05). The polymerization shrinkage of the specimens increased linearly with increasing specimen thickness (R = 0.99 - 1.00).
Refractive index
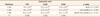
Table 6 lists the refractive index at the surface of specimens of different depths. Each resin product had a significantly different refractive index (p < 0.001). According to curve fitting, the refractive index and specimen thickness showed an inverse linear correlation (R = 0.98 - 0.99).
Evaluation of correlation between tested values
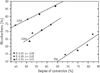
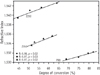
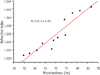
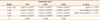
The correlations among the DC, microhardness and refractive index were evaluated. Figure 1 shows the correlation between the DC and microhardness. The DC showed a linear correlation with the microhardness (R = 0.92 - 0.99) and refractive index (R = 0.97 - 0.98) at different depths (Figure 2). A similar linear correlation was observed between the microhardness and refractive index (R = 0.93) of the tested resin products with different depths (Figure 3).
Discussion
The degree of polymerization of the silorane-based composite resin was examined in terms of the curing depth. The results were compared with those of methacrylate-based composite resins. For the light-curing composite resins, the polymerization process was initiated by activating the photoinitiator using an external blue light. In this process, the number of photons is important because it regulates the capacity to activate the photoinitiator. The number of photons is related to the intensity of incident light, where a high intensity implies a high quantity of photons. Within the specimen, the incident light was attenuated by scattering and absorption events with ubiquitously distributed fillers, pigments and photoinitiator. The number of photons decreased exponentially with increasing specimen thickness. Such an exponential decrease normally follows the Beer-Lambert law. Less frequent light scattering and absorption was observed in the subsurface of the specimens containing less filler, which increased the survival of the incident photons. The factors such as polymeric matrix, monomer type, filler typer and filler content, can influence the light transmittance of composite resins. There are the differences in filler and monomer component between methacrylate and silorane composite resin. In this study, among the specimens, P90 showed a slightly lower attenuation coefficient than the other two resin products, which might be due to the relatively lower filler content. A lower attenuation coefficient suggests that there are more photons surviving and fewer photons lost in the subsurface. With less photon loss, a higher degree of conversion can be expected compared to other resin products with the same depth.16,17
Previous studies reported that the DC of methacrylate-based resins ranged from around 55 - 75% using conventional curing technique.18,19 In this study, the DC of methacrylate-based resin specimens showed from 45.3 to 63.9%. On the contrary, the DC of silorane-based resin specimens was ranged from 66.8 to 81.9%, regardless of the subsurface position. The previous studies showed that the result of DC of silorane composite resin ranged from 50 to 64.9%.6,20,21,22,23 The results of this study do not support previous results in DC of silorane-based composite resin. These studies have been undertaken using different methodologies to determine the DC of silorane-based resin. In this study, immediately after measuring the microhardenss, scratched powder was used after dissolving in ethanol for transmission FTIR spectroscopy.8,24 Recently, one study reported that the result of DC of silorane-based resin in the depth of 2 mm specimen was 72.85%, which is higher than previous results.25 DC is related to the differences in monomer system, filler size, filler volume, and type between methacrylate and silorane based composie resin. Moreover, there are some differences in the photoinitiating component. Methacrylate-based composite resin is initiated by a two component system consisting of camphoroquinone and tertiary amine. Silorane-based composite resin is photoactivated with a three component initiating system consisting of camphoroquinone, iodonium salt and an electron donor.26 DC is influenced by complex interaction of these factors. The high DC of P90 is due partly to its lower light attenuation and partly to oxygen. Oxygen can be an inhibitor in free-radical mediated polymerization process. It can inactivate the free radicals by scavenging, impeding further polymerization.27,28 On the other hand, the cationic ring-opening process is probably insensitive to oxygen because of their cationic reaction, which explains the high DC of P90.
Curve fitting revealed an inverse linear correlation between the DC and subsurface depth, regardless of the exponential decrease in light intensity, which was attributed to the three-dimensional crosslinking process. Irradiated photons immediately reach the subsurface and initiate polymerization at the subsurface by crosslinking monomer molecules three-dimensionally from the top to bottom. The intensity of these photons, however, decreases exponentially with depth. Nevertheless, the insufficient DC due to the exponential decrease in photons can be compensated by the three dimensional crosslinking.
Depth of cure for light-activated dental composites has often been evaluated by measurement of the hardness of the material at specific depths. In general, higher hardness values are an indicator of more extensive polymerization.29,30 In this study, the specimens showed significantly different microhardness at different depths. Among the specimens, P90 and Z250 showed the lowest (54.1 - 67.8 Hv) and highest (73.9 - 86.1 Hv) microhardness, respectively. A linear correlation was observed between the microhardness and specimen depth (R = 0.975 - 0.995) regardless of the resin product. It is similar to the correlation between the DC and depth. Degree of polymerization of the specimens can be measured by both the DC and microhardness. In general, higher DC correlates with greater hardness.13 However, as the microhardness is the indirect methods to verify DC characterizing the monomer conversion, hardness values do not always predict the DC in comparisons of different resin materials. Despite of similar DC, 3-D structures of polymerized composite with different concentrations of C=C bonds can coexist in the same polymer structure.31 Also, microhardness can be influenced by monomer phase and filler phase. As the filler phase is harder than the polymer phase, therefore, the low filler content leads to a lower microhardness values.13,32 In this study, even with a highest DC of P90, the difference in the microhardness values between P90 and other tested methacrylate based composites could be attributed to the filler content (vol% / wt%: 55 / 76 vs. 59.5 / 84.5). The microhardness decreased gradient from top to bottom with the increase in thickness of all tested specimens. It has been suggested that the microhardness ratio from top to bottom should not exceed 10 - 20% for proper polymerization of composite resin restorations.15 In Z250, Z350, and P90, the each microhardness ration from top to bottom (3 mm thickness) were 15, 16 and 21%, which means that polymerization of P90 at the bottom surface (3 mm thickness) was insufficient to provide optimal mechanical properties.
Silorane-based composite resin achieves low shrinkage due to the ring-opening oxirane moieties, despite having the lowest filler content among the specimens tested.33 The silorane monomer ring differs from the chain monomers of methacrylate composites. In contrast to methacrylates, which are crosslinked via radicals, silorane is polymerized by a cationic reaction. The cationic curing initiation process involves an acidic center. After addition to an oxirane monomer, the epoxy ring is opened to from a chain or a network, in the case of multifunctional monomers.7 The opening of the oxirane rings during polymerization compensates for this polymerization shrinkage to some extent. The oxirane rings are responsible for the physical properties and low shrinkage. The polymerization of silorane-based composites occurs through a photocationic ring-opening reaction, which results in less polymerization contraction compared to the methacrylate-based composite.7 P90 exhibited less polymerization shrinkage and a slower shrinkage rate (ratio between polymerization shrinkage and specimen thickness: 0.35 - 0.65%) than Z250 and Z350 (0.55 - 1.13%), which are methacrylate-based composite resins. Regardless of the specimen, shrinkage increased linearly with increasing specimen thickness (R = 0.99 - 1.00), whereas the ratio between polymerization shrinkage and specimen thickness decreased. As the specimen thickness increased, the polymerization shrinkage rate decreased due to incomplete polymerization. The level of insufficient polymerization increased further in the deep subsurface due to the exponential decrease in photons.
The refractive index of a medium measures the speed of light in that medium and reflects the polymerization state. In the present study, the refractive index was significantly different in resin products and subsurface positions. For each resin product, the reflective index decreased linearly with increasing specimen thickness. Among the specimens, P90 showed the lowest reflective index. According to previous results, the DC and microhardness decreased linearly with increasing specimen thickness. These results suggest that the contraction of the top surface due to polymerization shrinkage is greater than that of the bottom surface. The higher DC and microhardness on the upper surface than on the lower subsurface can be explained by the larger number of photons on the upper surface than subsurface. Therefore, the density might decrease gradually from the top to bottom with a similar gradual decrease in refractive index from the top to bottom.34,35,36 In the tested specimens, there was a linear correlation among the DC, microhardness and refractive index. Nevertheless, it is unclear if this correlation is common to other composite resins. Hence, further investigation is needed.
Conclusions
The silorane-based P90 achieved the lowest polymerization shrinkage compared to other methacrylate-based composite resins independent of the specimen thicknesses. On the other hand, P90 had the lowest microhardness, despite having the highest DC among the specimens examined because it has the lowest filler content. The DC, microhardness and refractive index of the tested specimens showed an inverse linear correlation (in case of polymerization shrinkage, it showed a positive linear correlation) with the position (depth, thickness) in the subsurface despite the exponential decrease in incident photons within the specimens.

 XML Download