

 PDF
PDF ePub
ePub Citation
 Print
Print


INTRODUCTION
Atrial fibrillation (AF) is a cardiac electrophysiological rhythm disorder that results in the absence of normal atrial contractions. Approximately 20% of all ischemic strokes are associated with AF [1]. The prevalence of AF increases with age, and is up to 9% among those aged 80 years or older [2]. The number of individuals with AF is predicted to more than double by the year 2050 [3]. Although much has been discovered regarding the pathophysiology of AF, the exact mechanism remains unclear.
Autonomic nerves are abundant in the heart, and the autonomic nervous system (ANS) plays a significant role in atrial electrophysiology. ANS activation has been found to be associated with atrial arrhythmogenicity [4]. ANS activation may trigger activity related to enhanced automaticity, either early or delayed after depolarization [4]. Clinically, neuromodulations such as sympathetic and vagal denervation, ganglionated plexi (GP) ablation, and renal sympathetic denervation have been effective for the treatment of AF [4].
Acetylcholine (ACh) secreted by the parasympathetic component of the vagus nerve shortens the atrial refractory period by activating ACh-activated potassium channels (IKAch). In addition, ACh is rapidly broken down at its release site, resulting in a limited spread of ACh, and consequently, regional variation in the ACh concentration [4]. The shortened refractory period in combination with the heterogeneity of ACh distribution increases susceptibility to AF. However, the mechanism by which the pattern of the parasympathetic nervous system in the atrium affects cardiac wave dynamics is unclear. In this study, we examined the effects of the distribution of parasympathetic nerves on atrial wave dynamics using in silico modeling. The GPs and nerves were modeled in a realistic geometry of the atrium, and AF inducibility and the patterns of cardiac wave dynamics were simulated for various ACh concentrations.
METHODS
Atrial cell and tissue model
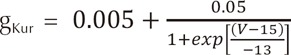
An ACh-dependent K+ current (IKAch) was added to the human atrial action potential model developed by Courtemanche et al. [5] to determine ion currents in each cell. For the mathematical form of IKAch, we used the model developed by Kneller et al.
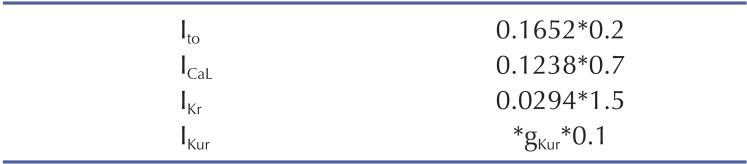
where Vm is the membrane potential; β is the membrane surface-to-volume ratio; Cm is the membrane capacitance per unit area; D is conductivity tensors; and Iion and Is are ion current density and stimulation current density, respectively. The computational domain consists of elements representing cardiac cells. Ion currents were adjusted to represent persistent AF (PeAF) conditions, as shown in Table 1. To obtain the restitution curve, ramp pacing was used. Initially, pacing was applied 8 times with a 1,000 ms cycle length. The cycle length was then decreased by 50 ms until it reached 250 ms. Afterwards, the cycle length was decreased by 10 ms until an alternan was observed (Fig. 1). The diastolic interval was measured at the eighth pacing at each cycle length, and the action potential duration was measured at the ninth pacing. The exponential equation used by Kim et al. [7] was applied to obtain the maximum slope of the restitution curve.
3D GP and nerve modeling
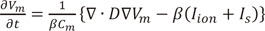
A realistic model of the left atrium (LA) was used to examine the effect of ACh in a 3D environment. LA geometry data extracted from CT images were smoothed before mesh generation on the geometry. Between 0.9 and 1 million prism-type meshes were generated and refined. Three types of ACh concentration spatial distribution were tested: random distribution (Fig. 2A), GP area only (Fig. 2B), and a model of the GP and nerve (Fig. 2C) based on the octopus hypothesis [8]. "Octopus" hypothesis explains the spatial gradient of atrial refractoriness and retrograde activation of GP from a remote stimulation by adopting octopus shape for nerve distribution [8]. Because the shape and structure of atrial neural network are currently not fully known, we adopted the octopus shape for one of the nerve models. For the random distribution of ACh concentration, the percentage of area with ACh activation was set to 30% of the total area. For the GP area only activation, ACh was applied to 4 GP areas: the inferior left ganglionated plexus (ILGP), the anterior right ganglionated plexus (ARGP), the inferior right ganglionated plexus (IRGP), and the superior left ganglionated plexus (SLGP). For both the GP area only model and the octopus hypothesis-based model of the GP and nerve, the GP locations were determined based on the electrophysiological mapping data of Katritsis et al. [9]. Each of the 4 GPs was modeled to have 8 nerves with a length of approximately 2 cm. ACh concentrations were modeled to decrease exponentially with increasing distance from the edges of the GP and nerves. AF inducibility was tested for 4 cases of ACh concentrations (µM): 0, 0.003, 0.03, and 0.3. For the pacing protocol to induce AF, a total of 24 pacings were applied with pacing intervals of 200 ms (8 times), 190 ms (8 times), and 180 ms (8 times). AF inducibility was confirmed when AF was sustained for over 20 s.
RESULTS
Validation of the effect of Ach in the single cell model
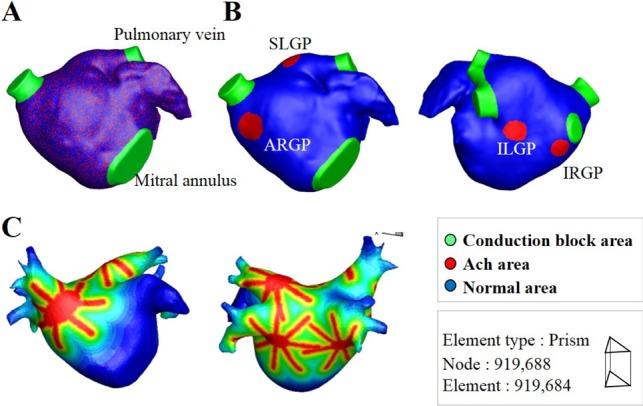
To validate the numerical model, we performed a single cell simulation of stimulation using a baseline model identical to the human atrial action potential model of Courtemanche et al. [5]. The model does not include IKAch, and the stimulation protocol used by Courtemanche et al. was identically applied. We compared the shape of the action potential curves of each ionic current with those shown in [5], and confirmed that the curves are identical (Fig. 3) [5].
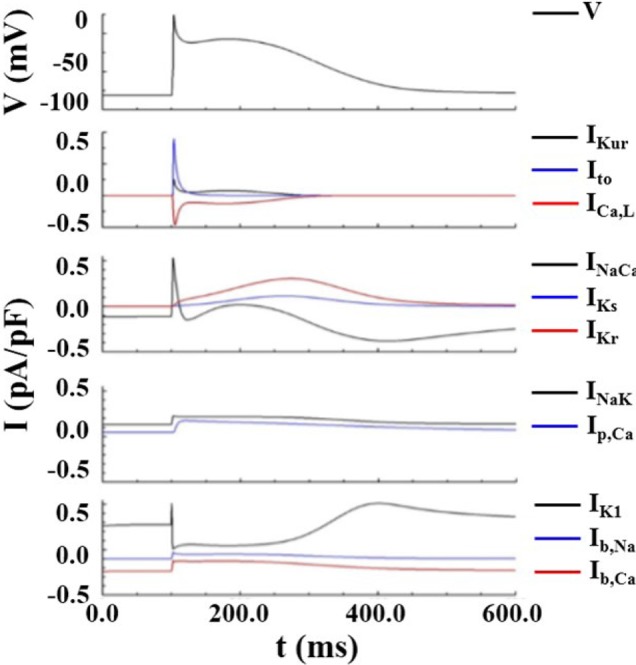
Fig. 4 shows the action potential and restitution curve for ACh concentrations of 0.03 and 0.1 µM, and for control conditions (ACh concentration of 0 µM) representing the PeAF condition described in the Methods section. APD90 decreased as the ACh concentration increased. APD90 also decreased as cycle length decreased. Fig. 4C shows that the maximal slope of the restitution curve increased with increasing ACh concentration. The slope of restitution curve is considered an index that represents cardiac wave instability leading to wave break [10].
Effect of Ach in the 3D model
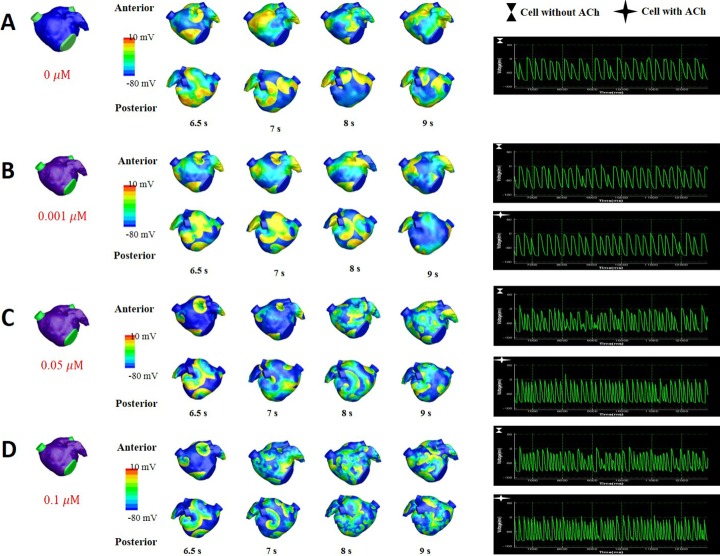
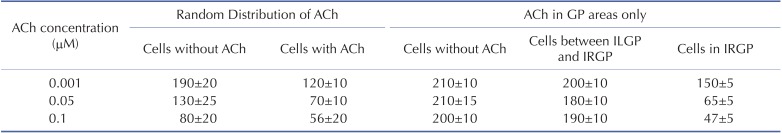
Fig. 5 shows the wave dynamics in a realistic model of the LA for different concentrations of ACh when ACh is distributed randomly. The number of cells under the influence of ACh was set to 30% of the total number of cells although all the cells in the model have ACh-activated K+ channels. Fig. 5A is the control case in which ACh is not present. When the ACh concentration was increased to 0.001 µM, any noticeable change in wave dynamics was not observed (Fig. 5B). However, when the ACh concentration was increased to 0.05 µM and 0.1 µM, APD shortening and an increase in the number of wavelets were observed in both the cell types with and without ACh (Figs. 5C and 5D, Table 2). APD shortening is known to increase the probability of AF maintenance [1112].
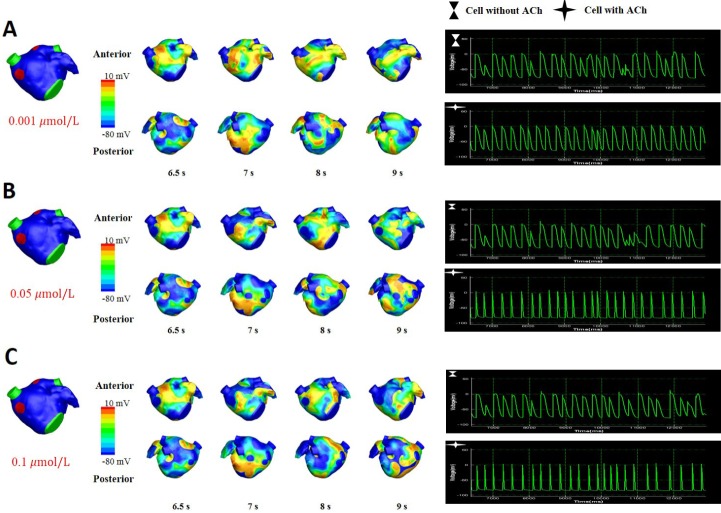
Fig. 6 shows the wave dynamics in the 3D model of the LA when ACh was present only in GP areas. The increase in ACh concentration up to 0.1 µM did not result in any noticeable change in the pattern of wave dynamics. The APD of the cells in GP areas decreased as the ACh concentration increased while the APD of the cells in the other areas did not change significantly (Table 2).
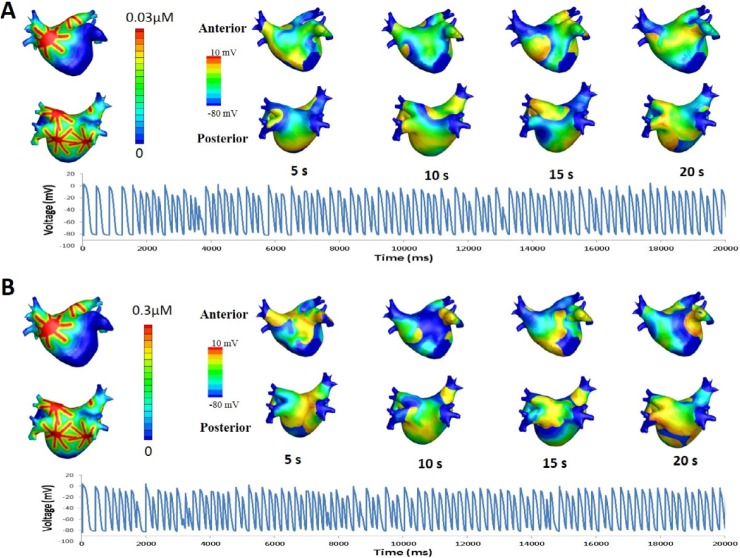
Fig. 7 shows the pattern of wave dynamics in the case of octopus hypothesis-based model of GP and nerve. When the maximal ACh concentration was 0 and 0.003 µM, the stimulation wave generated from the pacing protocol described in the Methods section disappeared at the end of the pacing. However, AF was induced and maintained for longer than 20 s for maximal ACh concentrations of 0.03 and 0.3 µM.
DISCUSSION
In this study, an in silico model of the GP and parasympathetic nerves was developed based on the octopus hypothesis and cardiac wave dynamics was simulated on a realistic geometry of the LA for different ACh concentrations. Two hypothetical distributions of ACh concentrations were also examined: randomly distributed ACh concentrations and ACh distributed in GP areas only. In the case of randomly distributed ACh, higher ACh concentrations promoted AF whereas ACh in the GP areas only did not result in any noticeable change in cardiac wave dynamics. In the GP and nerve model based on the octopus hypothesis, AF was induced at higher concentrations of ACh.
Role of Ach in AF
Autonomic nerve activity is known to play a significant role in AF. Vagal activation, which releases ACh, shortens the refractory period of cardiac cells by activating IKAch, thereby increasing the susceptibility to AF. Moreover, IKAch activation accompanied by sympathetic nerve activation, which increases the intracellular Ca2+ transient, is known to create the conditions for late phase 3 early after depolarizations [4]. The current in silico study demonstrated that an increase in the ACh concentration level promotes the instability of cardiac wave dynamics, leading to AF, in 3D. The dependence of the wave dynamics pattern on the ACh concentration was observed when ACh was distributed throughout the entire tissue or atrium. On the other hand, when ACh release was limited to the GP areas, no noticeable change in wave dynamics was observed. This is somewhat consistent with the study by Sosa et al. [13], which found that the outcome of selective vagal denervation is not superior to that of circumferential pulmonary vein (PV) isolation. In reality, the release of ACh is not limited to the GP areas, but spreads out to nearby regions around the GP areas [14]. The effect of the ACh concentration increase was evident when ACh was randomly distributed throughout the entire surface of the atrium in this study.
Spatial heterogeneity of vagal activation
Autonomic nerves are distributed throughout the epicardium of the heart. As sympathetic and parasympathetic nerves are colocalized, it is difficult to identify and model each nerve structure separately [14]. Although the octopus hypothesis on which the nerve model used in this study is based was not focused on the nerve structure, it constitutes a reasonable implication in regard to nerve modeling. As mentioned by Zhou et al. [8], the model agrees with anatomical observation that there are nerve density gradients away from the PV-LA junction [15]. As a result, the refractory period also has gradients. It is known that the spatial heterogeneity of refractoriness promotes AF [1617]. Although a spatially uniform distribution of ACh is unrealistic, the octopus hypothesis-based model of the GP and nerve examined in this study exhibits a highly heterogeneous spatial distribution of ACh (Fig. 2). As GPs are located at the PV-LA junctions, refractoriness in the PVs seems significantly affected by ACh. Clinically, the outcome of catheter ablation is better when GP ablation is combined with PV isolation than with GP ablation alone [9], indicating that the AF triggering and maintenance mechanisms in the PV areas are multifactorial.
Limitations
This study has some limitations. As the anatomical distribution of the parasympathetic nerves in the atrium is not known, the nerve structure model used in this study is based on a hypothesis. Another limitation is that the 3D model used in this study is a structurally homogeneous one. Wave propagation in the monolayer model was reported to be similar to that in the bilayer model, except for the area of abrupt change of fiber orientation [18]. However, bi-atrial modeling and the incorporation of thickness variation and structural characteristics such as fiber orientation could have affected wave propagation in the simulation.

 XML Download