

 PDF
PDF ePub
ePub Citation
 Print
Print


INTRODUCTION
Intrahepatic cholangiocarcinoma (iCCA) is the second primary liver malignancy, and while it only accounts for 10%–15% of cases of liver cancer, its incidence and mortality have recently increased [1]. Surgery remains the only treatment option with curative intent, but it is hard to diagnose iCCA in early stages due to a lack of specific symptoms; therefore, most patients are already at an advanced stage at the time of diagnosis. 18F-fludeoxyglucose (18F-FDG) PET/CT scanning has proven useful in the diagnosis of various malignancies. Although the efficacy of FDG PET/CT scanning in iCCA remains quite limited, recent studies have shown that FDG/PET is also effective in ICC for diagnostic accuracy as well as the prediction of survival [234].
Recently, the molecular mechanisms for the carcinogenesis and tumor progression of intrahepatic CCA have been evaluated. KRAS mutation and some multiple aberrantly regulated oncogenic pathways, including the activation of HER2, activation of receptor tyrosine kinase (RTK) pathway, and epidermal growth factor receptor (EGFR) signaling are characterized as poor prognostic factors in CCA [5678]. However, an integrative clinical and molecular analysis has yet to be fully explored, and the molecular characterization of CCA cannot be predicted based on clinical features.
PET with 18F-FDG, a glucose analog, is a less invasive diagnostic tool that measures the glucose metabolism potential of tumors by quantifying 18F-FDG uptake. The utility of measuring FDG uptake in human cancer has been proven in terms of cancer detection, staging, and prediction of prognosis. Increased maximum standard uptake value (SUVmax) is well established to be associated with poor patient outcome in various cancers as well as in cholangiocarcinoma [39]. In contrast to the well-documented clinical utility of 18F-FDG-PET scans, the genetic features related to FDG uptake have been studied in just a few types of cancer [1011]. Although GLUT1 expression and certain pathways such as cell cycle and acetylation have been shown to be related to FDG uptake in breast and lung cancer, these are not yet well explored. In particular, studies on identifying genome-wide expression across various FDG uptake levels in iCCA are very limited [1213].
If specific genetic characteristics were found to be related to FDG uptake in iCCA, we could predict molecular features based on FDG uptake patterns, and can use this as an approach to distinguish different types of treatment. In this era of genetic landscapes and precision medicine, it may lead to a specific molecular-radiographic imaging phenotype in iCCA. For those purposes, we analyzed RNA sequencing data using the next generation sequence (NGS) method in iCCA patients who underwent preoperative 18F-FDG-PET scans, and evaluated the gene expression signatures associated with FDG uptake patterns in iCCA.
METHODS
Patients, tissue samples, and clinical analysis
From March 2008 to August 2013, 56 patients with iCCA underwent curative-intent surgical resection at the Keimyung University Dongsan Medical Center. For 42 of these cases, frozen tumor tissues were available. We excluded 12 patients whose tissues did not qualify for RNA analysis or with other pathology (combined hepatocellular carcinoma and CCA). Among the remaining 30 patients, 22 patients who underwent preoperative PET scans were finally enrolled for this study. Patients with preoperative distant metastasis were excluded. The clinicopathological characteristics and survival data of these patients were retrospectively analyzed based on a prospectively collected database. Tumor stages were assessed according to the classification system of the American Joint Committee on Cancer, 7th edition [14].
The 22 fresh samples were saved frozen (−80℃) and used for analysis. A pathologist reviewed all hematoxylin and eosin-stained slides. Patients' clinical, radiologic, and survival outcomes were analyzed retrospectively. Palliative chemotherapy with gemcitabine base was performed in six patients after recurrence, and none of them responded to chemotherapy.
This study was approved by the Institutional Review Boards at Keimyung University Dongsan Medical (DSMC 2014-12-066) and included the secondary usage of human-derived materials. Informed consent for the human-derived materials was obtained from all patients prior to surgery.
18F-FDG PET/CT acquisition protocol and image analysis
18F-FDG PET/CT scans were obtained using 2 different scanners (Discovery STE-16, GE Healthcare, Milwaukee, WI, USA; and Biograph mCT-64, Siemens Healthcare, Knoxville, TN, USA) within 1 month prior to surgical resection. All patients were required to fast for at least 6 hours before the scan, and their blood glucose levels were measured in order to confirm that the level was <150 mg/dL before 18F-FDG injection. Patients received intravenous administration of 4.0 MBq/kg (Biograph mCT-64) or 7.0 MBq/kg (Discovery STE-16) of 18F-FDG, according to the PET/CT scanner used, and were encouraged to rest during the 18F-FDG uptake period. Imaging was performed 60 minutes after 18F-FDG administration. A noncontrast low dose CT scan was obtained for attenuation correction and localization before PET. Immediately following the CT scan, PET images were obtained from the base of the skull to the proximal thigh in 3-dimensional mode with an acquisition time of three minutes (Discovery STE-16) or 90 seconds (Biograph mCT-64), per bed position. The PET images were reconstructed iteratively using ordered subset expectation maximization. Attenuation correction of the PET images was performed using the CT data.
CT and PET scan data were coregistered on a dedicated workstation (SingoMMWP VE40A, Siemens Healthcare). 18F-FDG PET scan images were displayed on the transaxial, coronal, and sagittal planes, as well as with rotating 3D images (voxel size = 2.5 mm × 2.5 mm × 3.0 mm, transaxial resolution = 4-mm FWHM). Primary tumors were characterized as positive for 18F-FDG uptake if they showed abnormally increased uptake exceeding the physiologic uptake of the liver. If there was no significantly increased uptake visible in the liver, the case was characterized as negative for 18F-FDG uptake.
SUVmax was measured for all primary tumors. Circular regions of interest were manually drawn over the maximum 18F-FDG uptake lesions corresponding to the primary tumor on CT or MRI. The SUVmax was calculated using the following formula:
SUVmax = maximum activity in region of interest (MBq/g)/injection dose per body weight (MBq/g). Two nuclear medicine doctors measured the SUVmax initially, the other one nuclear medicine doctor reviewed them without long-term prognosis information.
mRNA sequencing library preparation and sequencing
Microdissection was performed in order to obtain tumor and adjacent normal liver from the frozen samples. Total RNA was extracted using TRIzol RNA Isolation Reagents (Life Technologies, Grand Island, NY, USA). The quality of the total RNA was evaluated using an Agilent 2100 bioanalyzer RNA kit (Agilent, Santa Clara, CA, USA). The isolated total RNA was processed in order to prepare the mRNA sequencing library by using the Illumina TruSeq Stranded mRNA Sample Preparation Kit (Illumina, San Diego, CA, USA) according to the manufacturer's protocol so as to have single 8-bp indices for multiplexing. The qualities and sizes of the libraries were evaluated using an Agilent 2100 bioanalyzer DNA kit (Agilent). All libraries were quantified by qPCR using a CFX96 Real Time System (Bio-Rad, Hercules, CA, USA) and sequenced on a NextSeq500 sequencer (Illumina) in pairs. Preprocessed and processed RNA sequencing data is available at gene expression omnibus (GEO; www.ncbi.nlm.nih.gov) with the accession number of GSE107943.
Preprocessing and genome mapping of sequence reads
The RNA sequencing samples were analyzed using a MAP-R Seq pipeline [15]. Paired-end reads were aligned by TopHatv2 [16] against the hg19 build of the human reference genome using a bowtie1 [17] aligner option. RSeQC was used to calculate various quality control metrics in order to identify sample-specific issues.
Quantifying gene expression
FeatureCounts software [18] was used to quantify gene expression. Each sample's mapped reads were aligned to ENSEMBL's GRCh37.75 RNA features reference gene definition file, then quantified. The number of raw reads aligning to each RNA feature was then normalized to RPKM (Reads PerKilobase of transcript per million mapped reads) values.
Identifying genes correlating with SUVmax value
In order to explore the genes which had a positive or negative linear correlation with the SUVmax value, correlation analyses between the SUVmax value and the gene expression value of RPKM were performed in R language. Strong and significant correlations were defined as cases with a Pearson coefficient > 0.5.
Gene set enrichment test and functional categorization of SUVmax related genes
In order to characterize the biological pathways associated with the SUVmax-correlated genes, significant genes were analyzed in the context of several databases, such as the Kyoto Encyclopedia of Genes and Genomes (KEGG; http://www.genome.ad.jp), gene ontology (GO) terms, and BioCarta (http://www.biocarta.com) using the Database for Annotation, Visualization and Integrated Discovery (DAVID; https://david.ncifcrf.gov/). The cutoff was defined at a false discovery rate (FDR) below 0.05.
In order to further explore specific signaling pathways for high SUVmax samples, gene sets of the MSigDB database were assessed for enrichment with the Gene Set Enrichment Analysis (GSEA) [19] using all gene expressions. Pathways that were significantly differentiated between high and low SUVmax were defined as cases with a FDR < 0.05.
Statistical analysis
A statistical analysis was performed using R (https://cran.r-project.org/) and IBM SPSS ver. 18.0 (IBM Co., Armonk, NY, USA). The cutoff value of SUVmax for dichotomizing high and low SUVmax was determined based on the receiver operating characteristics (ROC) curve. A comparison between the groups was performed using a Mann-Whitney U-test for nonparametric continuous variables and chi-square test or Fisher exact test for categorical variables. Overall and disease-free survivals were calculated using the Kaplan-Meier method, and survival differences between groups were assessed using the log-rank test.
RESULTS
Patients' demographic factors and clinical outcomes
The patient population consisted of 17 men and five women with a median age of 64.0 years (range, 49–79 years). All of the samples were mass-forming type cholangiocarcinoma. During the median follow-up period of 30.0 months (range, 6.6–112.6 months), 15 patients (70.0%) experienced disease recurrence and 13 (56.7%) of them died. The 3- and 5-year overall survival rates were 40.7% and 27.1%, respectively, and the 3- and 5-year disease-free survival rates were 34.5% and 23.0%, respectively.
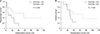
The median SUVmax intensity was 8.5, with the range between 1 and 13.8. According to ROC curve analysis, the cutoff value of SUVmax for predicting risk of recurrence was 9.04 with the area under the ROC curve of 0.733, a sensitivity of 53.3%, specificity of 100%, and 95% confidence interval was 0.733 (0.513–0.914).
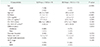
Patients with higher SUVmax than 9.0 (n = 9) had poorer disease-free survival than those with lower SUVmax (n = 13) (38.0% vs. 0% in 5-year disease-free survival, P = 0.035) (Fig. 1). There were no significant differences in clinical and pathologic findings between high and low SUVmax patients (Table 1). Detailed patients' clinical information with SUVmax is summarized at Supplementary Table 1.
Genes correlate with SUVmax
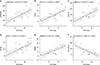
According to correlation analysis, 143 genes were positively correlated with SUVmax (Pearson coefficient of correlation > 0.5; Supplementary Table 2) and 119 genes were negatively correlated with SUVmax (Pearson coefficient of correlation < −0.5; Supplementary Table 3). Genes related to glycolysis and gluconeogenesis (G6PC, TPI1, ALDH1B1, PGAM1, etc), acetylation (LRRC59, DYNC1LI1, etc.), phosphorylation (LSM12, PRR11, S1PR1, etc.), and cell cycle (KIFC1, BYSL, CDC16, CDK1, BRCA1, CDKN3, CCNB1, etc.) were positively correlated with SUVmax. RRM2, which is a target of E2F transcription factors relating to the resistance and toxicity of gemcitabine [20], was also positively correlated with SUVmax. Meanwhile, SLC27A2, which is an acetylation-related gene and known as being cisplastin resistant in low expression [21], was negatively correlated with SUVmax. In addition, tumor suppressor genes, such as ST7L and BCL2, were negatively correlated with SUVmax (Fig. 2).
Pathway analysis of SUVmax related genes
Using 262 genes with significant correlations with SUVmax (143 genes with positively correlated and 119 genes with negatively correlated), DAVID was used to obtain the enrichment results related to SUVmax. GO analysis results showed that 262 genes were significantly enriched in process of cell division and nucleoplasm. According to UniProtKB keywords (UP_KEYWORDS), 5 enriched pathways comprised cell cycle, cell division, mitosis, phosphoprotein and acetylation (Table 2). Therefore, 262 genes which are correlated with SUVmax were related to cell cycle, cell division, and acetylation.
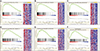
In order to further assess specific pathways associated with high SUVmax compared to low SUVmax, GSEA analysis using whole gene signatures was performed. Several oncogenic pathways were enriched in the high SUVmax samples, and the majority of these pathways were cell proliferation related pathways including cell cycle, cell division, genes encoding cell cycle related targets of E2F transcription factors, and genes involved in the G2/M checkpoint, such as in the progression through the cell division cycle. In addition, several metabolism-related pathways (Glycolysis, Oxidative phosphorylation, Pyruvate, pyrimidine, Glucose-6-phosphatase) were enriched in high SUVmax patients. Additionally, other oncogenic pathways including TNF-alpha and NFkB, PI3K, AKT and mTOR, MYC signaling, hypoxia, and inflammation related pathways were also enriched in high SUVmax patients (Supplementary Table 4, Fig. 3).
Survival genes
According to the Cox model comparing higher versus lower than median expression values for individual genes, 627 signatures were significantly associated with disease recurrence and 232 signatures were related with overall survival (P < 0.01) (Supplementary Tables 5 and 6).
DISCUSSION
Recently, due to the development of NGS methods, the molecular characteristics of many cancers, including iCCA, have been identified. However, although molecular characterization might be helpful for screening, the prediction of prognosis, and the development of target therapeutics, the application of these molecular signatures to clinical settings is still not feasible, because of the high cost of molecular evaluation. If molecular characteristics have specific clinical features, we can predict molecular features based on clinical findings, and this may be helpful for predicting potential target therapy. FDG uptake features may be used as a biomarker and provide additional genomic level information. This study is the first to report on the identification of gene expression signatures associated with FDG uptake features of iCCA. In particular, the present study found genes correlated with SUVmax and oncogenic pathways associated with high SUVmax.
In the present study, cell cycle, cell division, and metabolism related pathways were found to be associated with FDG uptake, and we could identify individual genes as being positively or negatively correlated with SUVmax. Controlling the cell division cycle is a crucial role for DNA synthesis and proliferation, DNA repair, or apoptosis. In many cancers, including CCA, the pathways regulating the cell cycle incorporate both oncogenes and tumor suppressors, and are dysregulated [22]. These cell cycle related pathways being dysregulated commonly leads to genetic instability. Meanwhile, the ability of a cell to enter the cell cycle critically depends on the availability of metabolites [23]. Therefore, cell cycle deregulation in cancer is associated with metabolism such as glucose, acetate, and choline, and those pathways may affect FDG uptake. Although those signatures are generally associated with FDG in other cancer, interestingly, the present study revealed that the MYC, NFkB, and PI3K-AKT signaling pathways were uniquely enriched in patients with high SUVmax in iCCA. These pathways are important oncogenic pathways in iCCA [5622]. Glucose and glutamine metabolism are reprogramed by the MYC and PI3K signaling pathways [24]. In particular, the PI3K-AKT pathway regulates cellular metabolism, promoting glucose transport and increasing the rates of glycolysis and lipid synthesis [25]. Increased MYC enhances glycolysis and glutamine catabolism, resulting in cancer cell growth [26]. Nuclear factor-kappa B (NF-κB) activation and PI3K-AKT activation are related to cell cycle progression [27] and NF-κB signaling is activated downstream by the production of lactate from glycolysis [28]. Additionally, enriched hypoxia signaling was noted in high SUVmax patients, which is related to glycolysis (Warburg Effect) [29], and this condition may contribute to the rapid division of cancer cell [30]. Therefore, the present study demonstrated that various pathways associated with FDG uptake are closely related to cell cycle and metabolism. Those signaling pathways found to be related to FDG uptake in the present study are similar to those in lymphoma and lung cancer [10]. Meanwhile, other poor prognostic oncogenic pathways of iCCA, such as activated HER2, RTK, ERBB2, and EGFR [56722] signaling pathways were not found to be associated with FDG uptake in the present study. Therefore, the enrichment of cell cycle and metabolism signaling pathways seem to be FDG specific pathways in iCCA.
Another important utility of FDG uptake is the assessment of treatment response monitoring by using metabolic reprograming of the cancer cell and changing tumor burden in brain, sarcoma, lung cancer, and so on [24]. Interestingly, in the present study, RRM2, which is related to gemcitabine resistance and complication, was found to be positively correlated with SUVmax, and SLC27A1, related to cisplatin response, was found to be negatively correlated with SUVmax. Therefore, we can assume that patients with high SUVmax may not respond to gemcitabine and cisplastin therapy. In the present study, 6 patients who underwent palliative gemcitabine-based chemotherapy did not respond. Because there were no patients with neoadjuvant chemotherapy, and recurrent tumors may have different characteristics from primary tumors, the assessment of responses to chemotherapeutics in this study is limited, and additional molecular and clinical evaluations are needed.
The novelty of our findings is identifying gene expression features associated with FDG uptake as well as evaluating associated gene pathway uniquely found in iCCA. Additionally, we suggested potential target therapy according to FDG uptake. However, this retrospective study is a small cohort single institution study. Although FDG-PET in CCA may have potential utility, including the prediction of tumor subtype as well as the prediction of targeted therapy, validation with larger cohort samples should be performed. In the era of genomics, integrative genomic analysis with mutation, gene alteration, and methylation, in addition to gene expression analysis, should be performed.
In conclusion, the genomic features of gene expression and pathways can be predicted by FDG uptake features in iCCA. Patients with high FDG uptake have enriched cell cycle, metabolism, and hypoxic pathways, and this knowledge may lead to a more rational, targeted approach to treatment.
 XML Download