

 PDF
PDF ePub
ePub Citation
 Print
Print


INTRODUCTION
Fungi are ubiquitous in the environment, and their spores are found widely in the air. As early as the 12th century, fungi were recognized as aeroallergens. Living in a damp or moldy environment has been reported to be associated with an increased risk of developing asthma, allergic rhinitis/sinusitis and atopic dermatitis as well as increasing severity of allergic diseases.12345678910111213
The prevalence of fungal allergy varies from 10%-80% among patients with allergic airway diseases and atopic dermatitis in different regions.5141516 More than 180 fungal species have been reported to induce IgE-mediated hypersensitivity in susceptible persons, among which Ascomycota (Alternaria, Aspergillus, Bipolaris, Candida, Cladosporium, Epicoccum, and Phoma) and Basidiomycota (Calvatia, Coprinus, Ganoderma, Pleurotus, and Psilocybe) phyla are considered to be of greater clinical importance.11171819
Previous studies using the gravity slide method have shown that the most predominant airborne fungi in Taiwan are Cladosporium species, followed by Ganoderma, Aspergillus, and Fusarium species.20 The prevalence of sensitization to airborne fungi has been reported to be around 10% among patients with asthma21 and 1.3%-9.3% among patients with allergic rhinitis in Taiwan.212223
Increasing evidence has shown positive associations of indoor dampness or the presence of fungi with the development and exacerbation of asthma as well as eczema and allergy. However, most published studies have involved qualitative assessments of dampness or fungi, such as moldy odor, visible water damage, or visible dampness,24 and only a few studies have quantitatively measured levels of specific fungal spores or culturable fungi for individual patients.
The aim of this study was to investigate the levels of fungal spores and culturable fungi in the houses of fungal allergic patients in central Taiwan during inactive and exacerbation (active) stages.
MATERIALS AND METHODS
Patient selection
Ten fungal allergic patients and 2 non-fungal allergic patients who were regularly followed up in the Allergy Clinic of Taichung Veteran's General Hospital, were recruited either by invitation of their physician (Y.H.C.) or by responding voluntarily to an advertisement. The levels of specific immunoglobulin E antibodies (IgE) to common inhaled allergens were analyzed using an ImmunoCAP System™ (Phadia AB, Uppsala, Sweden). A specific IgE level ≥0.35 kU/L was defined as a positive reaction according to the manufacturer's instructions.24 This study was approved by the Institutional Review Board of Taichung Veterans General Hospital (IRB No: CE11245).
Patients with a decrease in physician or patient global assessment using the visual analogue scale by more than 50% of their personal best were considered to have an exacerbation of allergic symptoms and to be in the active stage. Patients who maintained their physician and patient global assessment scores at their personal best for more than 3 months were considered to be in the inactive stage.
Environmental sample collection
From April 2012 to October 2013, air samples from the patient's bedrooms and an additional most commonly used rooms as well as the courtyards of the patient's house during active and inactive stages were collected using an air sampler (Coriolis®, Bertin, France) with a high flow rate of 300 L/min for viable spore collection.
In brief, 7.5 mL of 0.005% Triton-X100 was added to autoclaved sample bottles and then added every 10 minutes to maintain the volume at 7.5 mL, and the air velocity was set to 300 L/min for 30 minutes to allow for collection of an estimated total of 9 m3 of suspended particles. All samples were stored at 4℃ and sent to the laboratory as quickly as possible.
For indoor collection, the air sampler was placed in the center of the room, 120-150 cm above the ground and away from walls or corners by at least 50 cm. For outdoor collection, the air intake was faced into the prevailing wind, and people were prevented prevented from being upwind during collection. The power generator was set up at least 10 m downwind and away from the air sampler to exclude the effect of waste gas during outdoor collection.
Airborne fungal sample counting and identification
All the collected samples were centrifuged at 13,000 rpm to 1 mL, and then direct counting and viable counting were used to calculate the total number of spores and concentrations of dominant culturable fungal spores. For the direct count, 10 µL of the sample solution were added to a hemocytometer (Counting Chamber, Marienfeld, Germany) and were then counted under a microscope for total fungal spore concentration. Each sample was counted 3 times. For the viable count, samples were serially diluted with 0.005% Triton-X100 and then spread on 1/2 potato dextrose agar (PDA, Difco, Detroit, MI, USA). The plates were incubated at 25℃, and fungal colonies were counted after 3 to 5 days. Each assessment was performed in triplicate. The colonies were examined with a microscope to visually characterize and identify species.
Extraction of total DNA was performed on the mycelium of dominant fungal strains using the CTAB method reported by Doyle and Doyle.25 The internal transcribed spacer (ITS) region of ribosomal DNA (rDNA) was amplified with the primers ITS5/4 or ITS1/4.26 DNA sequencing was performed at Mission Biotech, Taiwan with the same primers. ITS sequences were used for molecular identification.
Data analysis
Logistic regression analysis was used to analyze correlations between exacerbations of allergic symptoms and total or viable count using R software (R Foundation for Statistical Computing, Vienna, Austria). Changes in the viable count of potential allergic species between the active and inactive stages were estimated by calculating the number of spores and colonies in the target patients and analyzed using paired t tests with R software. Statistical significance was set at P<0.05. In order to estimate the threshold levels of allergic fungi, we compared the viable count data of the target patients (a specific IgE level ≥0.35 kU/L and at least 1 colony in the active stage) during inactive and active stages. The threshold was reported at the highest level in the inactive stage.
RESULTS
Study subjects
Twelve subjects were enrolled in this study, including 10 fungal allergic patients and 2 non-fungal allergic patients as controls. The demographics of the study subjects are listed in Table 1. Among the 10 patients, 9 were allergic to Penicillium notatum, 7 to Cladosporium herbarum (C. herbarum), 8 to Aspergillus fumigates (A. fumigatus), 9 to Candida albicans, and 5 to Alternaria alternata (A. alternata). P4, P7, P9, and P10 were allergic to all tested fungi
Fungal concentrations in the patient's rooms of the patients
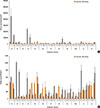
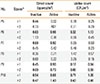
The total fungal concentrations were estimated by total and viable counts in 2 rooms of the patient's houses. The mean total and viable counts indoors in the active stage ranged from non-detectable to 4.52×10⁵ spores/m3 and non-detectable to 1.01×10³ CFU/m3, respectively compared to 1.99×10³ to 2.75×10⁴ spores/m3 and 9.61 to 445.78 CFU/m3 in the inactive stage, respectively (Fig. 1). Although the mean total and viable count were higher in the active stage than in the inactive stage, the results of logistic regression showed that there was no significant association between exacerbations of allergic symptoms and total or viable count (P>0.05, data not shown). The total and viable counts outdoors in the active stage ranged from 3.93×10³ to 8.45×10⁴ spores/m3 and 131 to 725 CFU/m3, respectively compared to 7.65×10³ to 3.87×10⁴ spores/m3 and 61 to 612 CFU/m3 in the inactive stage, respectively (Fig. 1).
Table 2 shows the indoor/outdoor (I/O) ratio calculated from direct and viable counts. The I/O ratio could be bigger or smaller in the active stage than in the inactive stage, and there was no consistent pattern. Logistic regression analysis also showed no significant association between allergy and the I/O ratio (P=0.693), suggesting that the I/O ratio is not suitable for predicting the occurrence or exacerbation of allergy.
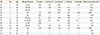
Prevalence of fungal species
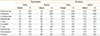
Table 3 lists the frequencies of occurrence of the fungal species. Cladosporium spp., C. oxysporum, C. cladosporioides, Aspergillus spp., Penicillium oxalicum, and Penicillium spp. were found most frequently during the active stage. However, the frequencies of occurrence during active and inactive stages were not significantly different.
Stage variations in the concentrations of some fungal species
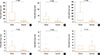
We then examined the effect of individual fungal concentrations on exacerbations of allergic symptoms (active stage) among different fungal allergens. The mean concentration of C. oxysporum among the target patients (P1, P2, P4, P6, P7, P9, and P10) during active and inactive stages ranged from 8.7 to 620.6 CFU/m3 and 0.9 to 88.3 CFU/m3, respectively (Supplemental Table, Fig. 2A). For Cladosporium cladosporioides (C. cladosporioides), the mean concentration among the target patients ranged from 0.9 to 157.3 CFU/m3 in the active stage, and from non-detectable to 26.2 CFU/m3 in the inactive stage (Supplemental Table, Fig. 2B). The indoor concentrations of C. oxysporum and C. cladosporioides were significantly higher during the active stage than during the inactive stage (P=0.03 and 0.04, respectively). There were also more Cladosporium spp. in the active stage than in the inactive stage (P=0.03) (Fig. 2C). With regard to Aspergillus niger, the indoor concentrations were significantly higher in the active stage than in the inactive stage (P=0.02), with the mean concentration ranging from non-detectable to 35.0 CFU/m3 during active stage and non-detectable to 12.2 CFU/m3 during inactive stage (Supplemental Table, Fig. 2D). With regard to Penicillium brevicompactum (P. brevicompactum), the mean concentration ranged from non-detectable to 26.2 CFU/m3 during the active stage, and non-detectable to 17.5 CFU/m3 during the inactive stage (Supplemental Table, Fig. 2E). For Penicillium oxalicum (P. oxalicum), the mean concentration ranged from non-detectable to 35 CFU/m3 during the active stage, and non-detectable to 26.2 CFU/m3 during the inactive stage (Supplemental Table, Fig. 2F). Differences in indoor concentrations of P. brevicompactum and P. oxalicum between active and inactive stages were not significant (P=0.05 and 0.13, respectively). Because A. flavus and A. fumigatus were only detected in 1 and 2 patents' houses, respectively, statistical analysis was not performed.
DISCUSSION
There were several studies to emphasize total spore concentrations, which found the correlation between the high concentration of total fungi and exacerbations of allergic symptoms.102627282930 We examined indoor total and specific allergenic fungal concentrations precisely in this study and found the importance of specific allergenic fungi in inducing exacerbation rather than total fungal concentration in triggering or exacerbating allergic symptoms among sensitized individuals. No association between total fungal counts and the occurrence of allergy was due to samples with lower fungal concentrations in the active stage than in the inactive stage. In P1 patient's house, for example the viable counts were 288 and 437 CFU/m3 in active and inactive stages, respectively. In inactive stage, there were higher total fungal concentrations but lower concentrations of allergenic fungi C. cladosporioides and C. oxysporum, and no A. niger or P. brevicompatum was detected. This kind of samples showed associations between total fungal concentration and occurrence of allergy, which did not reach statistical significance. Ross et al.31 reported that patients reporting visits to the emergency department were associated with total fungal concentration, although the statistical test result was not significant. The allergenic fungi ratio in total fungal concentration needs to be considered.
Recent studies reported that concentrations of Alternaria, Penicillium, and Cladosporium are correlated with infant wheezing27 and the development of rhinitis in later life.28 However, some reported that no association could be found between the spore concentration of these fungal genera in indoor air and asthma/allergy in children.32 A recent meta-analysis of 7 studies demostrated that the increased exacerbation of the asthma symptoms were significantly associated with increased level of specific fungal genera Cladosporium and Alternaria and that there was no association between exposure to Penicillium/Aspergillus and asthma.33 Several species of Aspergillus, Penicillium, and Cladosporium have been shown to be allergenic, but not all species in these genera were allergenic fungi. If they analyzed the allergenic species of these genera only, the resolution could have been improved.
The study subjects in this study showed their heterogenicity in allergenic fungal species. To study the roles of specific allergenic fungi, it is important to include patients with a positive reaction of specific IgE level to each fungus. This is the first field study to examine indoor fungi concentrations and species precisely and to report the threshold value of allergernic fungi.
Our results showed that the concentrations of specific allergenic fungi, including C. oxysporum, C. cladosporioides, A. niger, and P. brevicompactum, were significantly higher in the active stage than in the inactive stage. The exacerbation of allergic symptoms may have been correlated with increases in these specific fungal concentrations, which is consistent with recent studies reporting that the concentrations of indoor and outdoor levels of Alternaria, Penicillium, and Cladosporium are correlated with infant wheezing27 and the development of rhinitis in later life.28
According to individual fungal concentrations in active and inactive stages, we calculated the presumed threshold levels in the target patients (those with a positive fungal-specific IgE to that fungal allergen). The highest viable count of fungi during the inactive stage at the patient's house was presumed to be the threshold level for the exacerbation of allergic symptoms associated with that fungus. Based on these criteria, the threshold of C. oxysporum concentration was estimated to be 102 CFU/m3. In comparison, the concentration of C. cladosporioides during the inactive stage at the patients' houses was much lower, ranging from non-detectable to 26.2 CFU/m3. The proportion of C. cladosporioides in the total concentration of Cladosporium spp. was less than 35%. Therefore, the exacerbations may have been caused by the addictive effects of C. oxysporum and C. cladosporioides. It is possible that C. oxysporum and C. cladosporioides share similar antigens, although further studies are required to investigate the degree of protein homology between the 2 Cladosporium species.
For A. niger, a threshold level of 10 CFU/m3 was estimated. Although the difference in indoor concentration of P. brevicompactum was close to significance, we also estimated a threshold level of 10 CFU/m3. The viable count of P. oxalicum in the active stage was as high as that in the inactive stage (Fig. 2F). The threshold of P. oxalicum was not estimated in this study.
The high variations in the I/O ratio may be due to differences in building structure, air exchange rates, and seasonal variations in outdoor spores.29 Thus, it is difficult to clarify the sources of allergenic fungi only by the I/O ratio. Using our presumed threshold levels, the allergic fungi that caused the symptoms during the active stage were able to be determined in each patient. For example, patient P6 was sensitive to P. notatum, C. herbarum, and A. fumigatus. However, only the concentrations of P. brevicompactum and P. oxalicum in his house reached the threshold level and were higher in the active stage. Therefore, we inferred that P. brevicompactum and P. oxalicum caused the exacerbations in this patient. In the active stage of patient P6, the concentration of P. brevicompactum was 8.74 CFU/m3 indoors and 0.87 CFU/m3 outdoors, suggesting that the increase in P. brevicompactum was due to the indoor environment. In this context, the I/O ratio of P. oxalicum in patient P6's house was more than 1, indicating that the increase in these Penicillium species was due to the indoor environment. The exacerbation of allergic symptoms in patient P9 may have resulted from the increases in indoor concentrations of P. oxalicum and A. niger. This estimation may be helpful in making a correct diagnosis and recommendations for environmental control for fungal allergic patients.
Cladosporium herbarum is common in temperate zones.30343536 Approximately 60 antigens from C. herbarum have been identified, of which at least 36 have been shown to react with IgE antibodies from patients' sera and have been used for allergen-specific IgE assays in commercial diagnostic kits. A previous study showed that only 6% of 579 Taiwanese asthmatic patients had specific IgE to C. herbarum.37 We did not find the spores of C. herbarum in the households of any of our patients, and only C. oxysporum and C. cladosporioides were found with C. oxysporum being predominant. As Taiwan is located in a subtropical area, C. herbarum may not be the main allergic fungus. The use of appropriate diagnostic IgE antibodies for a tropical area is therefore needed.
It has been reported that in addition to fungal spores, the large fragments of fungi, such as airborne fungal hyphae, may also play a role in fungal allergy.38 However, the viable count method that we used to evaluate the amount of fungi could detect both active fungal spores and hyphae.
There are several limitations to this study. First, as the sample size is small in our study, the presumable threshold levels that we proposed in the above-mentioned discussion section may require a larger scale of study to confirm. Secondly, all the study patients were allergic to house dust mites. As we did not measure the concentrations of house dust mites in the patient's house, further studies are needed to elucidate whether there would be associations a reaction between the concentrations of house dust mites and fungi. In addition, most of our fungal allergic patients had both airway and skin allergies, and further studies are also needed to elucidate whether the influence of fungal concentrations on different allergic diseases are of equal importance. Alternaria is one of the important allergens, and because of the large spore size (23-34×7-10 µm), it is frequently found in house dust. As we focused on allergic fungi suspended in the air, the levels of dustborne fungi, such as Alternaria, may have been underestimated in this study.
In conclusion, our results showed that the concentrations of allergic fungi were correlated with disease exacerbations among fungal allergic patients, but total fungal spore concentration was not. The threshold levels of fungal concentration differed among species. The concentrations of Cladosporium, Aspergillus and Penicillium above threshold levels may be correlated with acute exacerbations of allergic symptoms in fungal allergic patients in Taiwan. These results may be useful in making a diagnosis and recommendations for environmental control for fungal allergic patients.
 XML Download