

 PDF
PDF ePub
ePub Citation
 Print
Print


INTRODUCTION
The prevalence of type 2 diabetes mellitus has increased at an epidemic rate, and it has now become a serious global health problem [1]. Obesity-associated insulin resistance is a strong risk factor for type 2 diabetes, the predominant form of diabetes [2]. In addition, insulin resistance is associated with metabolic syndrome, a cluster of metabolic abnormalities, including glucose intolerance, hypertension, hyperlipidemia, and a non-infective inflammatory state [3]. Metabolic syndrome can increase the risk of cardiovascular diseases (CVD) [4]. CVD is a major complication of type 2 diabetes, and a primary cause of immature death in patients with type 2 diabetes [5]. Thus, it is strongly recommended that the treatment strategy for type 2 diabetes focus on improving insulin resistance [6].
Accumulating evidence suggests that adipocytokines play an important role in regulating insulin sensitivity, which links obesity and insulin resistance [7,8]. Adipocytes increase the secretion of leptin, a hormone involved in energy expenditure [9], and proinflammatory cytokines such as tumor necrosis factor-α (TNF-α) [10] and interleukin-6 (IL-6) [11], but decrease adiponectin secretion in obesity [12]. Adiponectin is an adipocyte-derived hormone involved in glucose metabolism and increases insulin sensitivity [13], whereas TNF-α and IL-6 play a crucial role in the development of insulin resistance [14]. An obese condition elevates TNF-α and IL-6 to stimulate expression of monocyte chemoattractant protein-1 (MCP-1), a proinflammatory chemokine that induces insulin resistance [15,16]. Thus, suppression of obesity-induced inflammation could be useful for improving insulin resistance.
Myricetin is a bioflavonoid abundant in tea, berries, fruits, and vegetables [17]. The estimated daily intake of myricetin from food sources was about 0.98-1.1 mg per day [18]. Myricetin has been reported to have anti-inflammatory activity in vitro [19,20,21]. Myricetin reduces secretion of TNF-α and IL-1β in lipopolysaccharide (LPS)-stimulated RAW264.7 cells [19]. Myricetin inhibits LPS-induced production of IL-12 by downregulating transcription factor nuclear factor kappa-B (NF-κB) binding activity in RAW264.7 cells [20]. In addition, myricetin decreases IL-1β-induced production of IL-6 in synovial cells [21]. Therefore, myricetin could have the potential to alleviate obesity-induced insulin resistance through its anti-inflammatory activity.
Myricetin could be a promising therapeutic agent for treatment of type 2 diabetes. Liu et al. reported that injection of myricetin enhances insulin action in rats receiving fructose-rich chow [22]. Chang et al. found that dietary myricetin decreases body weight and improves the blood lipid profile in rats fed a high-fat diet [23]. However, the effect of myricetin on insulin resistance and inflammation in an animal model of type 2 diabetes is not fully understood. Thus, the purpose of this study was to investigate the effect of myricetin on adiposity, insulin resistance, and inflammatory markers in a diet-induced obese, insulin-resistant animal model. It has been reported that C57BL/6J mice fed a high-fat, high-sucrose (HFHS) diet develop obesity and type 2 diabetes [24,25,26]. In this study the effect of chronic consumption of myricetin on adiposity, blood lipid profile, glucose, insulin, adipocyte-derived hormones, and proinflammatory cytokines was determined in these animals fed HFHS diet.
MATERIALS AND METHODS
Animals and experimental protocol
Five-week-old male C57BL/6J mice (n = 28) were obtained from Bio Genomics, Inc. (Seoul, Korea). They were housed individually in plastic cages in a room with controlled temperature of 24 ± 5℃ and a relative humidity of 55 ± 5% and kept on a regular light cycle (06:00-18:00 light, 18:00-06:00 dark). All study procedures were approved by the Animal Resource Center at Inje University (approval no. 2013-8).
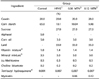
The mice were offered commercial chow for a 1-week adaptation period and were then divided randomly into four groups consisting of 7 mice each. One group was offered a basal diet containing 5% corn oil and 65% cornstarch (Control group), and the other three groups received a HFHS diet containing non, 0.06%, or 0.12% of myricetin (HFHS, 0.06 MTN, and 0.12 MTN groups) ad libitum for 12 weeks, respectively (Table 1). The HFHS diet contained 3% corn oil, 33% lard, 10.1% cornstarch, and 27% sucrose. The compositions of the basal and HFHS diets were determined based on previous studies [24,25,26]. The fat-calorie percentages of the basal and HFHS diets were 11.5% and 57.7%, respectively. HFHS diet contained the same amounts of minerals and vitamins per kilocalorie as the basal diet did. Myricetin was purchased from Sigma Chemical Co. (St. Louis, MO, USA). Casein, D,L-methionine, a mineral mixture, and a vitamin mixture were obtained from ICN Pharmaceuticals Inc. (Costa Mesa, CA, USA) and tert-butyl hydroquinone was purchased from Fluka Co. (Milwaukee, WI, USA). Cornstarch was obtained from Daesang Co. (Seoul, Korea), lard was from the Lotte Samgang Co. (Seoul, Korea), and the sucrose and corn oil were obtained from Cheiljedang Co. (Seoul, Korea). Body weight was measured weekly, and food intake was measured three times per week.
At the end of the experimental period, the mice were sacrificed by heart puncture following an overnight fast. Blood samples were collected immediately and centrifuged at 1,500g for 15 min to obtain serum, which was stored at -70℃ for further analysis. Epidydimal white adipose tissue (WAT) samples were collected and weighed.
Biochemical analyses
Serum glucose, triglyceride, and cholesterol levels were measured by an enzymatic method using commercial kits (Asan Pharmaceutical Co., Seoul, Korea). Serum leptin and adiponectin were measured by enzyme-linked immunosorbent assay (ELISA) using commercial assay kits (BioVendor Laboratorní Medicina a.s, Modrice, the Czech Republic). Serum levels of TNF-α, IL-6, and MCP-1 were also determined using ELISA kits specific for mice (eBioscience, Vienna, Austria). Serum insulin was measured with a commercial ELISA kit (Shibayagi Co., Ltd. Ishihara Shibukawa, Gunma, Japan). Homeostasis model assessment for insulin resistance (HOMA-IR) values were estimated as follows: HOMA-IR = [fasting insulin (µU/mL) × fasting glucose (mmol/L)]/22.5 [27].
RESULTS
Body weight, epidydimal fat pad weight, and food intake
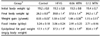
Body weights, weight gains, weights of epidydimal WAT, and food intake of the animals were listed in Table 2. The final body weight, weight gain, and epidydimal WAT weight were significantly higher in the HFHS group than those in the control group (P < 0.05). However, myricetin given at 0.12% of the total diet significantly reduced these levels by 14.0%, 27.6%, and 18.5%, respectively, compared with those in the HFHS group (P < 0.05). These values in the 0.06 MTN group were not significantly different from those in the HFHS and 0.12 MTN groups. Food intake was not significantly different among the four groups.
Serum lipid, glucose, and insulin concentrations
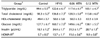
Serum lipid, glucose, and insulin concentrations of the animals were listed in Table 3. Serum triglyceride and cholesterol levels were significantly higher in the HFHS group than those in the control group (P < 0.05). However, consumption of 0.12% myricetin significantly lowered serum triglyceride and cholesterol levels by 15.9% and 16.8%, respectively, compared with those in the HFHS group. Serum triglyceride and cholesterol levels in the 0.12 MTN group were not significantly different from those in the control group. Serum triglyceride and cholesterol levels in the 0.06 MTN group were not significantly different from those in the control, HFHS, or 0.12 MTN groups.
Serum glucose and insulin levels were significantly higher in the HFHS group, compared with those in the control group. The 0.12 MTN group showed a 14.0% reduction in glucose and a 16.4% reduction in insulin levels compared with those in the HFHS group. Serum glucose and insulin levels in the 0.06 MTN group were not significantly different from those in the HFHS and 0.12 MTN groups. HOMA-IR values, an index of insulin resistance, were significantly elevated by the HFHS diet compared with those in the control group. Consumption of 0.12% myricetin, but not 0.06% myricetin, significantly decreased these levels by 28.0% compared with those in the HFHS group.
Serum concentrations of leptin, adiponectin, and proinflammatory cytokines
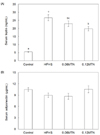
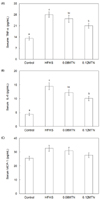
Serum leptin in the HFHS group was significantly higher than that in the control group. The 0.12 MTN group showed reduced leptin compared with that in the HFHS group (Fig. 1). Serum leptin in the 0.06 MTN group was not significantly different from that in the HFHS and 0.12 MTN groups. Serum adiponectin levels among the four groups were not significantly different. Serum levels of TNF-α and IL-6 increased significantly in the HFHS group compared to those in the control group (Fig. 2). However, consumption of 0.12% myricetin significantly decreased these levels compared with those in the HFHS group. Serum levels of TNF-α and IL-6 levels of 0.06 MTN group were not significantly different from those in the HFHS and 0.12 MTN groups. Serum MCP-1 levels in the control and HFHS groups were not significantly different. Consumption of 0.12% myricetin tended to decrease MCP-1 levels compared to those in the HFHS group, but the difference was not statistically significant.
DISCUSSION
We investigated the beneficial effect of chronic consumption of myricetin on the development of obesity and insulin resistance as well as the modulation of inflammatory markers in C57BL/6J mice fed an HFHS diet. Chronic consumption of HFHS diet induces obesity, hyperinsulinemia, and hyperglycemia in these animals [24,25,26,28]. In this study, consuming the HFHS diet for 12 weeks resulted in obese C57BL/6J mice, whereas 0.12% dietary myricetin reduced body weight, weight gain, and epidydimal WAT weights in mice fed the HFHS diet (Table 2). However, 0.06% myricetin did not significantly affect these values. Myricetin (0.12%), but not 0.06% myricetin, also effectively reduced serum triglycerides and cholesterol compared to those in HFHS diet fed mice (Table 2). The average daily intake of myricetin by the 0.12 MTN and 0.06 MTN groups was calculated to be 120 ± 7 and 61 ± 3 mg/kg, respectively, based on food intake and average body weight. Previous studies have reported that dietary myricetin administered at 75 mg/kg decreases body weight and epidydimal fat pad weight without a beneficial effect on the blood lipid profile, whereas 150 mg/kg myricetin is effective at exerting anti-obesity effect and improving atherogenic index in rats fed a high fat diet [23]. In our study, 120 mg/kg myricetin inhibited the development of HFHS diet-related obesity and hyperlipidemia in mice. Myricetin induces the expression of hepatic peroxisome-activated receptor-α (PPARα) protein and reduces sterol regulatory element binding protein (SREBP) expression, resulting in increased fatty oxidation in high-fat diet-fed rats [23]. Modifying the expression of these proteins could contribute to improving obesity and hyperlipidemia in mice fed the HFHS diet. Weight management has been suggested to be the most important method of reducing risk factors for cardiovascular complications such as hyperglycemia, hyperlipidemia, and hypertension in obese patients with type 2 diabetes [29]. Thus, myricetin could be beneficial in the management of type 2 diabetes.
Consuming the HFHS diet elevated serum insulin and glucose levels, as well as HOMA-IR relative to the control group (Table 3), suggesting that the HFHS diet induced insulin resistance. It was reported that the injection of myricetin (1 mg/kg per injection, thrice daily) improved insulin resistance in rat fed a high-fructose diet [22]. Yang et al. [28] reported that HFHS diet-induced hyperinsulinemia and hyperglycemia are related to the downregulation of genes involved in insulin signaling. In the present study, 0.12% myricetin was effective for decreasing insulin and HOMA-IR in mice fed the HFHS diet and reduced serum glucose levels near to those of the control group, suggesting that myricetin improved insulin resistance and hyperglycemia.
Although consuming the HFHS diet did not significantly influence serum adiponectin, it elevated serum leptin levels, which was consistent with the results of a previous study [30]. Myricetin (0.12%) decreased leptin compared with that in the HFHS group without significantly influencing adiponectin levels (Fig. 1). Leptin, a hormone produced by adipocytes, reduces food intake and body weight [31]. In an obese condition, leptin signaling is attenuated leading to leptin resistance and hyperleptinemia [32]. Leptin resistance in the brain results in excess triglyceride accumulation in adipose tissue, muscle, liver, and the pancreas, leading to insulin resistance [33]. Myricetin could improve HFHS diet-induced hyperleptinemia by attenuating obesity; thus, contributing to improving insulin sensitivity and hyperglycemia in these animals.
Myricetin (0.12%) effectively suppressed the HFHS diet-induced elevation in serum TNF-α and IL-6, suggesting an alleviation of obesity-induced low-grade inflammation (Fig. 2). Myricetin at this dose tended to reduce MCP-1 levels in mice fed the HFHS diet, although the difference was not significant. TNF-α and IL-6 modulate insulin signaling, leading to impaired insulin action [10,34]. MCP-1 plays an important role in macrophage infiltration into adipose tissue, which then induces inflammation and insulin resistance [16]. Thus, the reduction of TNF-α and IL-6 levels by myricetin could have contributed to improving insulin sensitivity in mice fed the HFHS diet. In addition, myricetin induces insulin action on insulin receptor substrate-1 (IRS-1)-associated phosphatidylinositol 3-kinase (PI 3-kinase) and translocation of glucose transporter subtype 4 (GLUT4) in high fructose-fed rats [22]. Elevated TNF-α and IL-6 levels are associated with reduced production and availability of endothelial nitric oxide synthase resulting in endothelial dysfunction [35]. Since obesity is an independent risk factor for CVD, reduction in these proinflammatory cytokines by supplementation of myricetin could contribute to decreased risk for CVD. Further study of the effect of myricetin on expression of proinflammatory cytokines and proteins involved in the insulin signaling pathway could be necessary to further understand the mechanisms underlying the improvement in insulin resistance by myricetin in these animals.
In conclusion, myricetin may have a protective effect against diet-induced of obesity and insulin resistance in mice fed HFHS diet, and that alleviation of insulin resistance could partly occur by improving obesity and reducing serum proinflammatory cytokine levels.
 XML Download