

 PDF
PDF ePub
ePub Citation
 Print
Print


Introduction
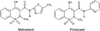
The enolic acid derivative meloxicam (MEL) [4-hydroxy-2-methyl-N-(5-methyl-2-thiazolyl)-2H-1,2-benzothiazine-3-carboxamide-1,1-dioxide] is a nonsteroidal anti-inflammatory drug (NSAID) with potent anti-inflammatory, analgesic, and antipyretic properties [7]. MEL and a chemically similar drug, piroxicam (PIR), both belong to the oxicam group of NSAIDs (Fig. 1) [29]. The primary action of MEL is the inhibition prostaglandin synthesis via preferential inhibition of cyclooxygenase (COX)-2 activity compared to COX-1 activity, resulting in potentially fewer side effects than non-selective COX inhibitors [27]. MEL is frequently prescribed for the treatment of rheumatoid and osteoarthritis in humans and can be conveniently administered once daily due to an elimination half-life of approximately 20 h [11]. MEL is also approved for use in dogs, cats, pigs, and cattle to treat inflammation and for the management of postoperative pain [9]. Additionally, MEL has been used to treat 'exotic' animals and wildlife such as koalas [19,26], but due to the lack of pharmacokinetic (PK) information, the dosage regimen (dose rate and dosing frequency) has been extrapolated from those used for dogs or cats [14].
It has been demonstrated that there is a high degree of variability of the pharmacokinetic profile of MEL between different species, particularly with respect to the rate of elimination [3,6,28,31]. For example the mean half-life of MEL in dogs and horses has been reported to be 24 and 8.5 h, respectively [6,31]. There have been no reports on MEL's pharmacokinetic profile in koalas. Serious consequences can arise if an uncharacteristic PK profile of a drug in a particular species is not recognized. For example, enrofloxacin, an antibacterial drug, failed to reach theoretical therapeutic plasma concentrations in koalas when administered at the recommended therapeutic dose rate [12]. This finding is significant because administering antibacterial reagents at suboptimal doses can select for drug-resistant bacteria. On the basis of the findings of the enrofloxacin study in koalas, our research group which focuses on investigating the efficacy of drugs in koalas, initiated a study on the PK of meloxicam in this species.
A variety of analytical methods are available to determine MEL concentrations in pharmaceutical preparations. These include ultraviolet (UV) spectrophotometry [4,10,17], fluorimetry [13], polarography [1], voltammetry [35], colorimetry [39], capillary zone electrophoretic method [24], thin layer chromatography with densitometry [5], and high performance liquid chromatography (HPLC)-UV detection [34]. However, many of these techniques are not suitable for measuring MEL concentrations in biological samples for PK applications due to both poor sensitivity and selectivity. Liquid chromatography-tandem mass spectrometry (LC-MS/MS) [16,37,38] has superior sensitivity for determining MEL concentrations in human biological samples. However, high costs of the instrumentation may be beyond the reach of some laboratories. HPLC with either UV or photodiode array (PDA) detection offers a more economical alternative method for PK studies of MEL concentrations in human plasma and serum [2,25]. This method unfortunately requires large sample volumes (0.5 to 1 mL) that may not be easily collected repeatedly from valuable, rare, or non-domesticated animals such as adult koalas with an average body weight less than 10 kg. Furthermore, all of these methods have been optimized with human plasma samples.
Our initial LC optimization experiments revealed two major challenges: the complexity of the endogenous koala plasma matrix and limited sample volume (unpublished data). Therefore, the aim of the present investigation was to develop an improved sensitive HPLC-PDA method using solid phase extraction (SPE) to determine MEL concentrations in koala plasma for PK studies. In order to demonstrate the feasibility of this technique, MEL was administered intravenously to three koalas and the plasma concentration vs. time (PK) profile was obtained.
Materials and Methods
Chemicals and materials
MEL, PIR as the internal standard (IS), potassium dihydrogen phosphate, and ortho-phosphoric acid (H3PO4) were purchased from Sigma-Aldrich (USA). HPLC-grade methanol and acetonitrile were supplied by SGE Analytical Science (Australia). Purified water was obtained with a Milli-Q water system (EMD Millipore, USA) and Oasis HLB 1-mL (30 mg) extraction cartridges were purchased from Waters (USA).
Chromatographic conditions
The HPLC system consisted of a CBM-20A module (Shimadzu, Japan) equipped with a LC-20AT delivery unit with a DGU-20As degassing solvent delivery unit and SIL-20AC auto injector. Chromatographic separation was initially performed by comparing separation achieved between several columns including an Apollo C18, 5 µm, 250 × 4.6 mm, (Alltech, USA), a Gemini C18, 5 µm, 150 × 2 mm, (Phenomenex, USA) and a Nova-Pak C18, 4-µm, 300 × 3.9 mm (Waters, USA). The final chromatographic separation was performed with a Nova-Pak C18, 4-µm, 300 × 3.9 mm (Waters, USA) attached to a 1-mm Opti-guard C-18 pre column (Optimize Technologies and Alpha Resources, USA). The column temperature was maintained at 30℃ with a CTO-20AC column oven (Shimadzu, Japan). The isocratic mobile phase was composed of a 50 mM potassium phosphate buffer (pH 2.15) and different concentrations of acetonitrile (35, 40, 45, and 50%) in the mobile phase were also used to optimize peak resolution and retention times of both IS and MEL. The mobile phase was delivered at a flow rate of 0.8 mL/min. The eluent was monitored at 355 nm with an SPD-M20A diode array detector (Shimadzu, Japan) and a Shimadzu class VP data system (ver. 7.4; Shimadzu, Japan) was used for chromatographic control, data collection, and data processing. The total run time for each sample was 15 min.
Preparation of standards and quality control (QC) samples
A primary stock standard solution of MEL (0.1 mg/mL) was prepared in 50% methanol and further diluted with 50% methanol to obtain a series of working standard solutions of 50, 100, 200, 500, 1,000, 2,000, and 5,000 ng/mL. A stock solution of PIR (0.1 mg/mL) was also prepared in 50% methanol and diluted to 500 ng/mL in 50% methanol as the working solution. Stock solutions were stored at -20℃ and working standard solutions used to generate the calibration curve were freshly prepared from stock solutions for each analysis. Blank koala plasma (i.e., drug free plasma) from different animals was pooled, stored at -20℃, and used for preparing the calibration standards and QC samples. Three different concentrations of QC samples (10, 200, and 1,000 ng/mL) for method validation were prepared by spiking the blank pooled koala plasma with the appropriate amount of working standard MEL solutions and stored at -20℃.
Calibration and sample preparation
Plasma calibration standards (ranging from 10 to 1,000 ng/mL) were freshly prepared by spiking 250 µL of blank pooled plasma pre-thawed at room temperature with 50 µL of the MEL working standard solutions. For preparation of the unknown samples, heparinized whole koala blood (approximately 1~1.5 mL) was centrifuged at 1,400 × g for 10 min. Details of unknown samples are explained in PK application section. The plasma was carefully removed and stored at -20℃.
SPE
Plasma samples (250 µL) were diluted with 750 µL of water and then spiked with 50 µL of the working IS solution at a final plasma concentration of 100 ng/mL. The SPE cartridges were connected to a Vac Elut vacuum manifold (Supelco, USA) and conditioned with 1 mL of methanol followed by 1 mL of water. The samples were allowed to run through sorbents at a flow rate of less than 1 mL/min. The cartridges were then rinsed with 1 mL of 5% methanol and dried under vacuum for 2 to 3 min. Analytes were eluted with 1.5 mL of methanol. The eluent was then dried under vacuum in a Speed Vac concentrator (Thermo Scientific, USA) at 40℃ for 2 h and the dried residue was reconstituted in 100 µL of mobile phase. The reconstituted sample was vortexed (15 sec), sonicated [Transsonic 570/H (35 kHz); ELMA, Germany] for 5 min, and then centrifuged at 14,000 × g for 10 min to remove any particulates. For evaluating efficiency of extraction, plasma samples were also diluted in 2% of phosphoric acid and run through the SPE. After the centrifugation, 10 µL of supernatant was injected into the HPLC system.
Method validation
Selectivity of the assay was measured by analyzing blank koala plasma (n = 10) to evaluate interference of endogenous matrix of plasma around the retention times of both MEL and the IS. The MEL plasma peak was identified based on retention time and UV spectra of the reference standard. MEL concentrations in plasma samples were quantified according to the plasma calibration curves for which seven MEL concentrations (10, 20, 40, 100, 200, 400, and 1,000 ng/mL) were used to establish the non-weighted least square linear regression of the curve (y = ax + b). This was done by plotting the concentrations of MEL (x) vs. the peak area ratios (y) of MEL to IS where a and b represented the slope and y-intercept of the curve, respectively. Based on International Conference on Harmonisation of Technical Requirements for Registration of Pharmaceuticals for Human Use (ICH) guidelines [15], the lowest limit of quantification (LLOQ) was determined based on calibration curves using the formula LLOQ = 10 × σ/S in which σ is the standard deviation (SD) of the y-intercepts for the regression lines and S is the mean slope of the calibration curves. An acceptance criterion for LLOQ was defined as precision less than 15% (coefficient of variation; CV) and accuracy within ± 20% of the nominal concentration with repeated analyses.
Intra- and inter-day precision was analyzed with triplicate QC samples (10, 200, and 1,000 ng/mL) within 1 day or on 5 consecutive days, respectively. Relative difference of the estimated concentrations was expressed as a percentage of the CV [(SD/mean value) × 100]. Intra- and inter-day accuracy expressed as bias [(estimated value - nominal value)/nominal value × 100] was determined by calculating the percentage difference between the estimated value and nominal value of MEL. Absolute recovery of MEL was measured by comparing the peak area of plasma samples (n = 5) pre-spiked with 10, 200, and 1,000 ng/mL MEL with corresponding concentrations of MEL in the mobile phase. Stability of MEL, including three freeze/thaw cycles (over a 5-day period) and long term stability (up to 3 months), was assayed with samples pre-spiked with two concentrations of MEL (10 and 1,000 ng/mL) and stored at -20℃. Each assay was conducted in triplicate and the data were analyzed with an ANOVA and unpaired Student's t-tests using Graph Pad Prism for Windows (ver. 5.01; Graph Pad Software, USA). P-values < 0.05 were considered statistically significant.
PK application
The PK study was approved by The University of Sydney Animal Ethics Committee (Australia). Metacam (Boehringer Ingelheim, Germany), a veterinary drug grade of MEL, was injected intravenously via the cephalic vein at the dose of 0.4 mg/kg into three healthy female koalas 1.5 to 2 years old as determined by tooth wear [36] and weighing 3.4 to 3.7 kg [at Australia Zoo Wildlife Hospital (Australia)]. Approximately 1 to 1.5 mL of blood was collected from a catheterized cephalic vein into heparinized tubes (Greiner Bio-One, Australia) at 0, 2, 5, 15, and 30 min and 1, 1.5, 2, 3, 4, 6, and 8 h after intravenous injection of MEL. The collected blood samples were prepared as described above and injected into the HPLC. PK parameters of MEL were measured using commercial PK software (PK solutions 2.0; Summit Research Services, USA). The following PK parameters were calculated: area under the plasma concentration vs. time curves [AUC0-t and AUC0-∞, where time (t) = last quantifiable time point] using a linear trapezoidal rule, terminal half life (t1/2), volume of distribution (Vdarea), and clearance (CLarea). The formulae used were: t1/2 = 0.693/(kel) where kel is the elimination rate constant, CLarea = dose/AUC0-∞, and Vdarea = dose/AUC0-∞*(kel).
Results
Chromatographic separation
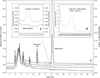
Based on the UV spectra, the optimal wavelength was set at 355 nm for quantitative analysis of MEL. The retention times of MEL and IS were approximately 8.03 and 5.56 min, respectively. Both the MEL and IS peaks were well resolved and no endogenous interference was observed. Typical chromatograms of the extracted double-blank plasma (i.e., without IS), extracted plasma samples pre-spiked with MEL (10, 200 and 1,000 ng/mL), and IS (100 ng/mL) are shown in Fig. 2. Since the column and composition of the mobile phase are the two major factors that influence chromatographic separation and sensitivity, several different columns were used for chromatographic resolution of the analytes. The Waters Nova-Pak C18 4-µm column (300 × 3.9 mm; Waters) was found to provide the best sensitivity and peak resolution. Acetonitrile was selected as the organic modifier of the mobile phase as this reagent produces the least base-line noise compared to methanol. Optimal separation was achieved with 45% acetonitrile in 50 mM potassium phosphate buffer at pH 2.15. All peaks were well resolved in less than 10 min with minimal interference from the plasma endomatrix.
Validation of HPLC
Linearity, sensitivity, precision, accuracy, and stability
The mean regression calibration curves (n = 5) were expressed as y = 13.9562 (± 0.2863, SD) x + 0.0003 (± 0.0162, SD) with the correlation coefficient value (r2) for each curve greater than 0.9998. Based on the SD of the y-intercepts and slope of the curves, the LLOQ of MEL was estimated to be 10 ng/mL. Subsequently, repeated analysis (n = 5) with this LLOQ (10 ng/mL) revealed a signal-to-noise ratio greater than 10 : 1 with a level of accuracy within 20% and a CV less than 15%. Therefore, 10 ng/mL of MEL in a 250-µL sample volume was identified as the lowest quantifiable concentration of the calibration curve for our study conditions. This was equivalent to an on-column amount of 250 pg.
Precision and accuracy for the QC samples (10, 200, and 1,000 ng/mL) are summarized in Table 1. Intra- and inter-day precision expressed as CVs ranged from 1.60 to 9.37% and 0.43 to 8.16%, respectively. Intra- and inter-day accuracy expressed as a percentage of the bias ranged from 0.42 to 4% and 0.19 to 5.60%, respectively. These values satisfied the ICH guidelines [15] regarding assay reliability. Assessment of the long-term MEL stability in koala plasma demonstrated that QC plasma samples (10 and 1,000 ng/mL) containing MEL were stable for up to 3 months when stored at -20℃. No significant changes of MEL concentration in the QC samples (p-values ≤ 0.36 and ≤ 0.23 for 10 and 1,000 ng/mL respectively, n = 3 for each concentration) were observed after three freeze/thaw cycles over a 5-day period.
Recovery and SPE
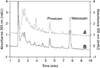
Chromatograms of plasma samples with different SPE procedures are illustrated in Fig. 3. The absolute recovery rates of MEL from the 10, 200, and 1,000 ng/mL QC samples (n = 5) were 89.50 ± 6.79 (SD), 93 ± 1.75, and 90.50% ± 1.44, respectively. The absolute recovery rate of the IS was 96% (n = 15).
PK assessment
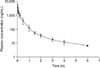
The HPLC-PDA method was used for a preliminary PK study in koala plasma (n = 3) after a single intravenous injection of 0.4 mg/kg MEL. The average plasma concentration (expressed on a semi-logarithmic scale) vs. time curve is illustrated in Fig. 4. The calculated PK parameters were as follows: AUC0-∞ = 0.924 ± 0.378 (SD) mg*h/L, Vdarea = 2.942 ± 0.683 L, t1/2 = 1.218 ± 0.262 h, and CLarea = 1.793 ± 0.860 L/h.
Discussion
HPLC-UV methods are widely used for quantitatively analyzing MEL in human plasma. Velpandian et al. [33] described a rapid HPLC-UV method to determine MEL concentrations in human plasma. Although that assay is straight-forward and rapid, it does not provide adequate sensitivity (LLOQ 100 ng/mL) for analyzing MEL in koala plasma. Other reports have utilized sensitive HPLC-UV and HPLC-PDA methods that are able to measure human plasma/serum MEL concentrations as low as 10 ng/mL [2,25]; however, these methods required 0.5 mL to 1 mL plasma sample volumes. Obtaining multiple samples of this magnitude over an 8-h period is not feasible for koalas given that their average body weight is less than 10 kg. The method described in the present study was optimized not only to provide adequate sensitivity but to also required less than half of the plasma volume needed for previously reported methods.
Removal of the interfering endogenous matrix in plasma samples is a critical step for HPLC analysis especially when the sample volume is limited. Conventional liquid-liquid extraction (LLE) [2,16] or protein precipitation techniques [8,37,38] have been used to prepare samples for MEL analysis in biological fluids. LLE techniques are labor-intensive, time-consuming, require large amounts of toxic organic solvent(s), and often result in poor drug recovery from the sample fluid [20]. Although protein precipitation techniques are simple, the extraction is non-selective with low recovery rates. Alternatively, SPE methods solve many of these problems and achieve superior drug recovery relative to LLE and protein precipitation techniques [21]. MEL was initially reported to possess only one pKa (4.08) corresponding to ionization of an enolic (OH) moiety of the molecule [32]. However, it was subsequently demonstrated that MEL exhibits a second pKa (1.08) corresponding to the protonation of a thiazole ring nitrogen [22]. Consequently, MEL exists as ionic species (anion, cation, or zwitterionic) over a broad pH range. Likewise, SPE of MEL from the plasma matrix using conventional non-polar (C18) sorbents will be inadequate. Thus, Oasis HLB was employed in the present study to provide a wide spectrum of retention capacities for both polar and non-polar species with high pH stability.
Our average absolute recovery rate of the QC samples (10, 200, and 1,000 ng/mL) was 91% ± 1.80 (SD). This was superior to both LLE (77.2 to 86.7%) [2] and protein precipitation techniques (>85%) [8]. Our results are comparable to ones from the study by Ouarezki et al. [25] for which SPE (Oasis HLB, 60-mg cartridges) was used to extract MEL from acidified human serum followed by HPLC-PDA analysis, resulting in an average absolute recovery of 95.33% ± 2.14 (SD) from 25, 500, and 1,000 ng/mL. Interestingly, in our study acidification of koala plasma prior to SPE consistently interfered with MEL and IS elution (no attempts were made to study the interfering components). Therefore, plasma acidification was not performed during the clean-up process, resulting in improved selectivity and greater peak resolution reliability.
In addition, our MEL plasma protein binding assay (data not shown) using blank koala plasma confirmed that the optimized SPE conditions were suitable for measuring total drug (free and bound) concentrations in the sample. Moreover, three unknown peaks, presumably MEL metabolites, with retention times of 3.82, 4.72, and 5.89 min were observed. The areas of these peaks were dependent on the peak area of MEL; this was found for the PK study samples. The maximum wavelengths (λ) obtained from the UV spectrum of these unknown peaks were approximately at 350 ± 20 nm, indicating that possible metabolites formed from the parent drug during the kinetic phase [23]. However, further structural evaluation of these unknown compounds (with NMR LC-MS or LC-MS/MS) is required to confirm the presence of metabolites. The endogenous matrix in koala plasma was found to be complex and caused greater interference when analyzing MEL. This compositional difference may be due to the koala's unique physiology given that these animals represent one of a few selective folivore marsupials that rely on certain species of eucalyptus leaf as their sole dietary source [30].
The terminal t1/2 rate of MEL in koalas (1.218 h ± 0.262) is approximately 20-fold faster when compared to that of dogs (terminal t1/2 of approximately 24 h) [6], which demonstrated the koala's unique drug metabolization capacity. At the dose rate of MEL administered in this study, the current method was able to quantify plasma MEL concentrations in koalas up to almost 6 h after drug administration. This corresponded to approximately five half-lives. Therefore, our method is applicable for PK studies of MEL in koalas. Additionally, we have performed a larger study examining the MEL PK dynamics in 15 koalas using this method [18].
The current investigation demonstrated that HPLC conditions may require modification when used to measure drug concentrations in different species. Furthermore, the methods used require adaptation to improve sensitivity when only small sample volumes are available. We have developed a simple, sensitive, and specific HPLC-PDA technique using SPE to measure plasma MEL concentrations. To our knowledge, this is the first validated method for quantifying MEL in koala plasma. The procedure has been successfully applied to a PK study that demonstrated the unique drug metabolism capacity of the koala. This study demonstrates that some analytical methods optimized for humans may require further optimization to improve their sensitivity depending on the volume of sample available and the species.

 XML Download