

 PDF
PDF ePub
ePub Citation
 Print
Print


INTRODUCTION
The term lower urinary tract symptoms (LUTS) encompasses a wide range of symptoms, categorized by the International Continence Society (ICS) as storage, voiding, and post-micturition [1]. Globally, LUTS prevalence rates among adults are typically estimated to be above 50% [23]. In South Korea, reported prevalence rates range between 23% and 83% [45678]. The extent of variability may be attributable to methodological differences between studies, such as how LUTS are defined and the threshold frequency of occurrence for an individual to be considered as having symptoms. Other factors influencing LUTS prevalence include age (prevalence increases with increasing age), comorbidities (e.g., neurological disorders, diabetes, and hypertension), and the method of collecting information from study participants (e.g., in a face-to-face interview, embarrassment may be a barrier to providing details regarding the true nature and impact of symptoms) [4691011].
Fear of urine leakage can have a profound effect on a person's confidence, meaning that LUTS can be distressing and socially isolating. Individuals with LUTS have increased rates of mental health issues such as depression and anxiety, as well as impaired quality of life (QoL) [12131415]. The economic impact of LUTS can be substantial at both a personal and a societal level. Indirect costs arise mainly through impairment of work activities, while direct costs are those associated with diagnosis and treatment, including healthcare professional consultations and treatment with medication or incontinence pads [13]. Patients with LUTS may be unwilling to discuss symptoms with their physician, limiting the extent to which they are treated and increasing the burden of disease [16].
Although studies of LUTS in South Korea have been published, further data to characterize the epidemiology and effects of LUTS would be beneficial to improve understanding and ensure that efforts to improve diagnosis and treatment are correctly targeted. In an international survey, we evaluated the prevalence and impact of LUTS including overactive bladder (OAB) in adults aged ≥40 years in China, Taiwan, and South Korea. Combined results from all three countries have been published previously [1718]. LUTS were found to be present in ~60% of the overall population, and to affect a significantly higher percentage of men (62.8%) than women (59.6%, p=0.004) [17]. The prevalence of LUTS increased with age, ranging from 49.9% among individuals aged 40–44 years to 69.7% in those aged >60 years. Overall, 20.8% of the population had OAB: 19.5% of the men and 22.1% of the women [18]. OAB prevalence was 10.8% in study participants aged 40 to 44 years, compared with 27.9% in the >60 years age group, representing a significant increase with age (p=0.001). The data from South Korea are described here, with the aim of providing greater insight into the prevalence of LUTS specifically in this country.
MATERIALS AND METHODS
This study was conducted between 2 June and 20 July 2015. The methodology and primary data have been published previously [17]. Therefore, there follows only a brief description of the methodology. Adults aged ≥40 years were eligible to participate in the study, provided that they could read the local language and access the internet, using a computer with or without assistance. Exclusion criteria were pregnancy and physician-diagnosed urinary tract infection during the previous month. Individuals were invited to participate in the study by email, with random sampling within consumer survey panels.
Individuals entering the study were asked to complete an internet-based survey. This included questions relating to ICS symptom definitions [1] and the bother associated with each symptom. Prevalence was assessed according to percentage of study participants stating that symptoms were present ‘less than half the time’ or more (i.e., score ≥2 on a Likert scale ranging from 0 [not at all] to 5 [almost always]). The international prostate symptom score (IPSS) [19] and the overactive bladder symptom score (OABSS) [20] were assessed. Further questions enabled the patient perception of bladder condition (PPBC) to be measured, and visits to healthcare professionals were documented.
The primary objective of the study was to determine the prevalence of LUTS using the ICS 2002 symptom definition [1], with nocturia defined as ≥2 episodes per night instead of one episode per night. Secondary objectives included assessment of the symptom-specific bother of LUTS and prevalence of OAB according to OABSS. Initial data analyses were based on descriptive statistics, and post hoc statistical comparisons were based on the chi-square test, Fisher's exact test, or analysis of variance (ANOVA). The p-values below 0.05 were considered to be statistically significant. To account for multiple comparisons, Bonferroni correction was employed. Data were analyzed using R 3.2.1 (R Foundation for Statistical Computing, Vienna, Austria) and Microsoft Excel 2016 (Microsoft Corporation, Redmond, WA, USA).
The study followed the principles of the Declaration of Helsinki, and was performed in compliance with Good Clinical Practice and market research guidelines (ClinicalTrials.gov identifier: NCT02618421). Institutional review board approval was not considered necessary as the study was based on a survey. Prior to participation in the study, all participants provided informed consent.
RESULTS
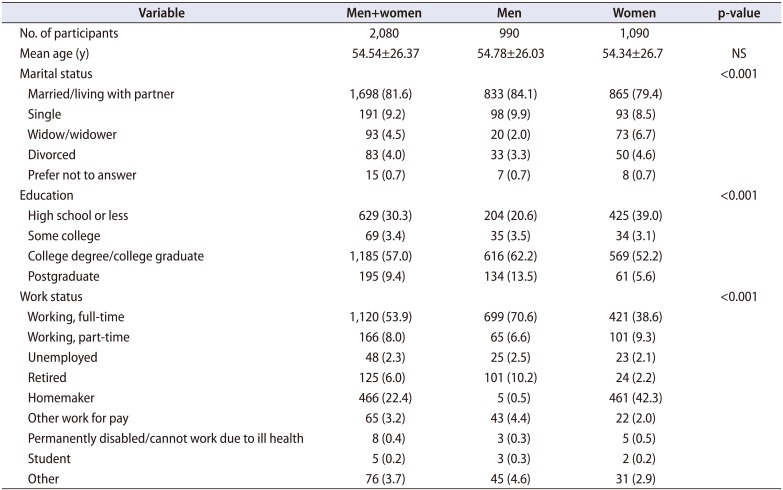
Overall, there were 2,080 participants from South Korea, whose demographic characteristics are shown in Table 1 [17]. 1,090 of the participants (52.4%) were women, while 740 (35.6%) were aged ≥60 years. A total of 509 individuals (24.5%) smoked, with sex-specific smoking rates of 40.1% (men) and 9.4% (women). Most respondents (~90%) answered all of the questions.
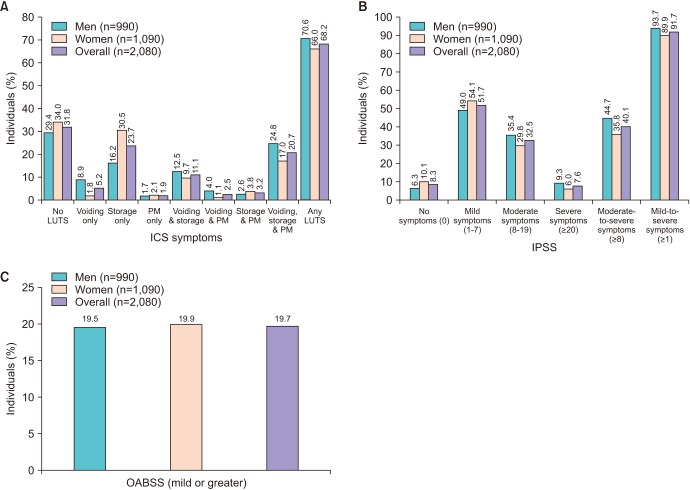
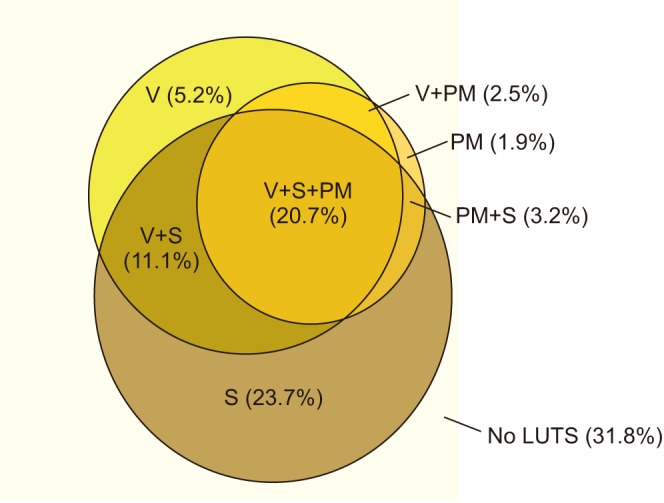
The prevalence of LUTS in South Korea according to ICS criteria was 68.2% (Fig. 1). Percentages of patients with individual ICS symptom groups and combinations thereof are shown in Fig. 1A and 2. The most common ICS symptom group was storage only, representing 35% of the LUTS population. The next most common combinations were all three ICS symptom groups (voiding plus storage plus post-micturition symptoms; 30% of all individuals with LUTS) and voiding plus storage (16%). LUTS were slightly more prevalent among men than women (70.6% vs. 66.0%, p=0.0245) (Fig. 1A). ICS symptom groups showing clear differences between the sexes were storage symptoms only, which were more common in women than men (p<0.001), and all three symptom groups, voiding symptoms only and voiding and post-micturition symptoms, which were more common in men (all p<0.001). Because of these differences, storage symptoms only was the most common group in women but all three symptom groups was most common in men. Relatively small numbers of individuals had voiding symptoms or post-micturition symptoms without other symptom groups.
Overall LUTS prevalence increased with age (p<0.001, Supplementary Table 1A), ranging from 65.3% in participants aged 40–44 years to 72.8% in those aged ≥60 years. Age-related differences were apparent in most ICS symptom groups/combinations (Supplementary Table 1A). LUTS prevalence was not affected by education level or marital status in the overall population. However, there were differences according to work status (p<0.001) (Supplementary Table 1A). In men, LUTS prevalence was significantly affected only by age (p=0.01, Supplementary Table 1B). In women, marital status (p=0.028) as well as age (p=0.01) had significant effects on LUTS prevalence (Supplementary Table 1C).
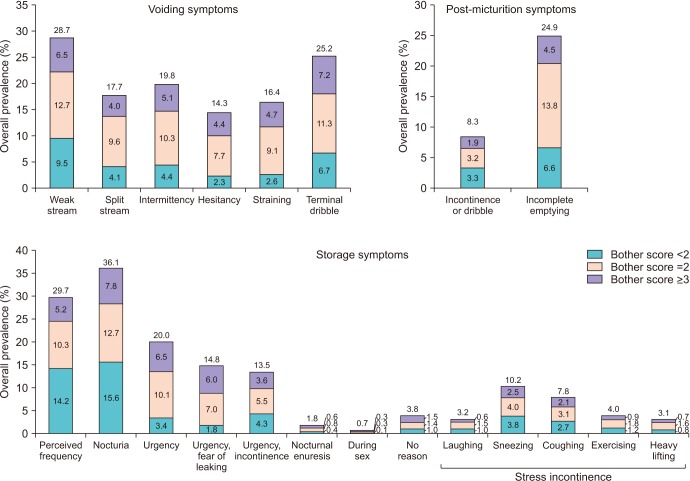
Individual symptoms with the highest overall prevalence in South Korea were nocturia, frequency, and weak stream (36%, 30%, and 29%, respectively) (Fig. 3). The most bothersome symptoms (those with the largest numbers of individuals experiencing ‘quite a bit or greater’ bother) were nocturia, terminal dribble, urgency, and weak stream. Weak stream, split stream, terminal dribble, and post-micturition incontinence or dribble were more frequent in men (38%, 22%, 32%, and 12%) than in women (21%, 14%, 19%, and 5%). Conversely, stress incontinence (laughing, sneezing, coughing, exercising, and lifting heavy objects) was more common in women than men (4%–16% vs. 1%–4%).
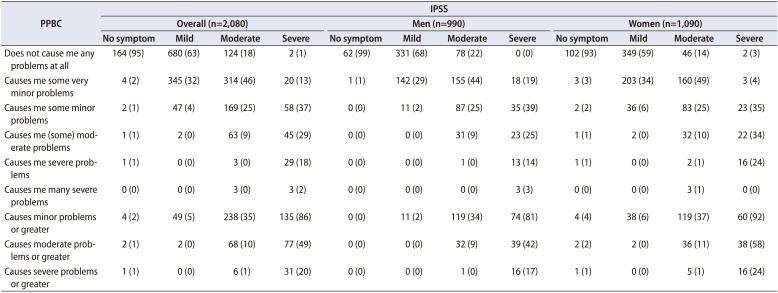
According to IPSS, approximately nine out of every ten participants (91.7%) had at least mild symptoms and four out of ten (40.1%) had at least moderate symptoms (Fig. 1B). The prevalence of moderate or greater symptoms was higher in men than in women (44.7% vs. 35.8%, p<0.001). Increasing IPSS symptom severity was significantly associated with worsening PPBC (correlation coefficient, 0.717; p<0.001) (Table 2). In the overall population, 49% of participants with severe IPSS had moderate or greater problems according to PPBC. The corresponding percentage among participants with no symptoms according to IPSS was 1%. Among respondents with all three ICS symptom groups (voiding, storage, and post-micturition), 27% indicated that their bladder condition causes moderate-to-severe problems. Corresponding percentages for individuals with voiding and post-micturition symptoms, voiding and storage symptoms, and storage and post-micturition symptoms were 10%, 7%, and 4%, respectively. ANOVA showed that there was a statistically significant variation in PPBC scores according to the presence of ICS symptom groups: voiding, storage and post-micturition, voiding and storage, and storage and post-micturition had worse scores than other ICS symptom groups (p<0.001).
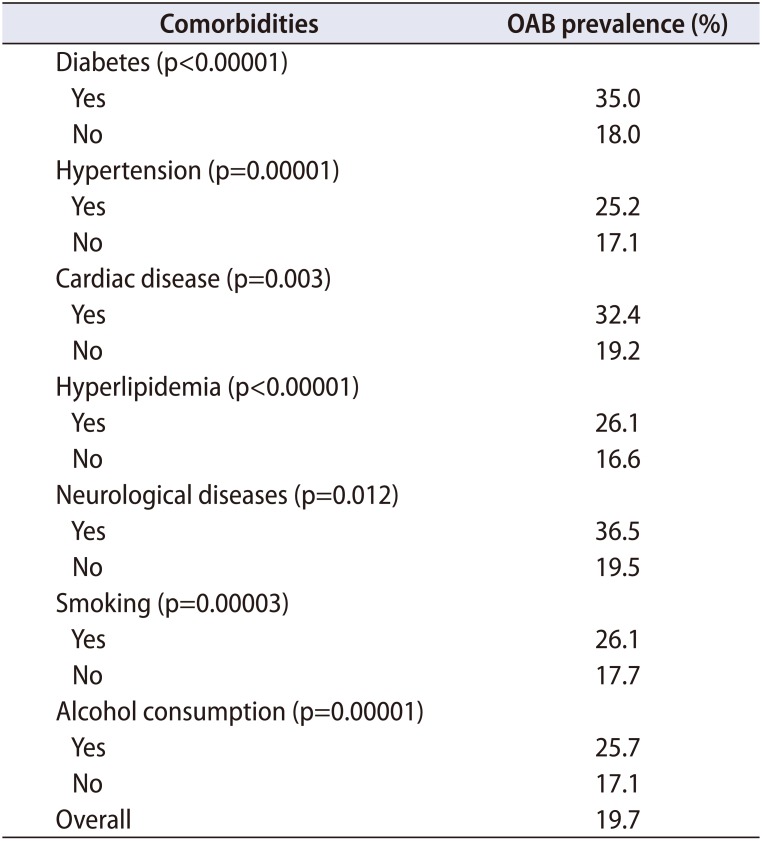
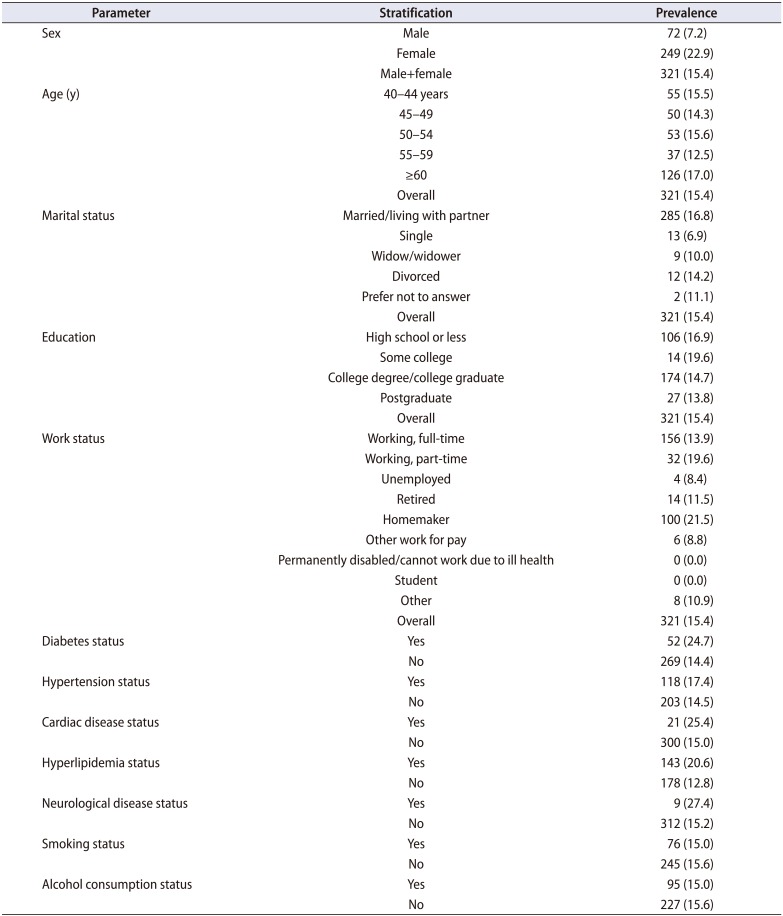
The prevalence of OAB, as determined by the OABSS, was 19.7% (Fig. 1C). The presence of comorbid conditions (e.g., diabetes, hypertension, cardiac disease, or hyperlipidemia) was associated with significantly increased OAB prevalence (Table 3). The prevalence of stress urinary incontinence (SUI) was significantly higher in women than men (22.9% vs. 7.2%, p<0.001) (Table 4). It was also higher among individuals with versus without comorbidities such as diabetes (p<0.001), cardiac disease (p=0.011), hyperlipidemia (p<0.001), and neurological disease (p=0.050). However, age, smoking status, and alcohol consumption were not associated with significant changes in the prevalence of SUI.
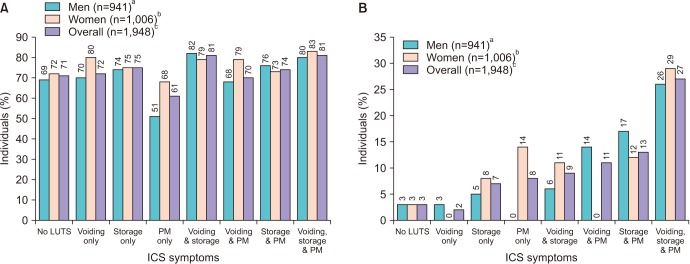
Based on ICS symptoms, 77% of South Korean individuals with any LUTS visit healthcare professionals for any reason. Highest percentages were observed among individuals with all three ICS symptom groups (voiding, storage, and post-micturition) and those with voiding plus storage symptoms, while the lowest percentage (lower than the population without LUTS) was in the population with post-micturition symptoms only (Fig. 4A). Differences across ICS symptom categories were statistically significant in men and women (both p<0.001). Only 14% of individuals with any LUTS visit healthcare professionals regarding urinary symptoms. This percentage was slightly higher in women versus men (14% vs. 13%). Statistically significant differences across ICS symptom groups/combinations in percentages of individuals seeking healthcare for urinary symptoms were observed in men and women (both p<0.001). Individuals with all the three ICS symptom groups (voiding, storage, and post-micturition) were most likely to visit healthcare professionals regarding their urinary symptoms (Fig. 4B). The lowest rate was in participants with voiding symptoms only (2%, lower than the rate for individuals with no LUTS).
DISCUSSION
This is one of the largest and most comprehensive studies of LUTS prevalence to be performed in South Korea. The results indicate that over two-thirds of the South Korean population aged ≥40 years have LUTS according to ICS criteria, and approximately half of individuals have at least moderate symptoms according to IPSS. The prevalence of ICS-defined LUTS was slightly higher in men than women and increased with increasing age. Differences in work status were also associated with variations in ICS-defined LUTS prevalence. Nocturia was the most common and the most bothersome symptom. In this study, unlike the ICS definition, nocturia was defined as ≥2 episodes per night, to avoid the risk of reporting an artificially high rate of LUTS.
There was a trend towards storage symptoms being more common in women than men and, accordingly, SUI was more common in women. Conversely, voiding symptoms were more common in men. These findings were as expected: similar results have been observed in other studies [238]. In the epidemiology of LUTS (EpiLUTS) study, all storage symptoms had higher prevalence in women than men and all voiding symptoms had higher prevalence in men [2]. These findings were true for symptoms occurring at least sometimes or at least often. Storage symptoms, with nocturia defined as ≥2 times per night, were present in 34.2% of women compared with 26.9% of men in the European Prospective Investigation into Cancer and Nutrition (EPIC) study [3]. Voiding symptoms were present in 25.7% of men and 19.5% of women. Corresponding percentages in the Korean EPIC study were 47.4% compared with 26.5% (storage symptoms), and 28.5% vs. 25.9% (voiding symptoms) [8]. In the present study, although storage symptoms alone was the most common ICS symptom group/combination in the overall population, many study participants had multiple symptoms; all three categories was the most common combination in men and the second most common combination overall.
Some previous publications have reported higher values than the present study for LUTS prevalence in South Korea. For example, Choo et al. [5] reported that the prevalence of moderate-to-severe IPSS symptoms was 68% among 224 Korean adults aged ≥45 years, at the end of a 3-year follow-up period (prevalence was 55% at baseline). Secondly, a study in 1,842 Korean men aged ≥40 years reported that LUTS, defined according to ICS criteria, affects 83% of individuals, and that the prevalence increases with age [6]. However, published estimates of LUTS prevalence in South Korea have been variable, and some authors have reported lower values than in the present study. For example, a lower IPSS-defined LUTS prevalence of 23% has been reported in South Korean men aged at least 50 (n=514) [7]. Also, in the Korean EPIC study with a sample size of 2,000, Lee et al. [8] reported ICS-defined LUTS prevalence of 61% (54% in men and 69% in women). This study was performed in a younger population (aged ≥18 years) than the present survey and, unlike our group, Lee et al. [8] used the ICS nocturia definition of ≥1 episode per night. Considering all of the methodology differences, comparison of the published results with our data is difficult.
As expected, the prevalence rates of OAB and SUI in the current study were lower than the prevalence of ICS-defined storage symptoms (OAB and SUI are sub-sets of ICS-defined storage symptoms). OAB commonly co-exists with other LUTS and it has been shown that men with OAB are likely to report more symptoms and higher severity than those with LUTS but no OAB [21]. We observed that the prevalence of OAB was increased among individuals with comorbidities. Previously documented risk factors for OAB include age, neurological disease, obesity, and, possibly, smoking [22]. Diabetes mellitus [23] and alcohol consumption [24] have also been associated with increased OAB prevalence. Neurological disorders and diabetes can affect bladder function. Therefore, the finding in our study that comorbidities were associated with increased OAB presence was as expected.
SUI was more common in women than men, in accordance with a previous Korean telephone survey [8]. Primary risk factors include childbirth, obesity, and smoking [25]. We found a link between diabetes and SUI; this could be related to an association between diabetes and impaired detrusor contractility [26]. Furthermore, the association reported here between neurological disease and SUI is unsurprising, given the possibility of neurogenic SUI related to outlet dysfunction [27]. The lack of a significant association between SUI prevalence and smoking in the present study was unexpected, but it could be due to the relatively small number of study participants who smoked (n=509). South Korea has a lower female smoking rate than most other countries [28].
A previous South Korean study reported the prevalence of OAB as 12% [8]. The difference between this result and the present data may be explained by the inclusion of younger adults in the earlier study (≥18 years). Lower prevalence than in the present study (14%) was also reported by Jo et al. [29] in a community-based survey performed using OABSS in adults aged ≥40 years. OAB was defined the same way as in the present study and the age ranges were the same; therefore, the differences could relate to the fact that Jo et al. [29] conducted their study by face-to-face interview. In addition, the sample size in the Jo et al. [29] study may be considered as being small and, consequently, the accuracy with which their results reflect the overall South Korean population may be questioned.
Only one in seven individuals with LUTS consulted healthcare professionals for urinary symptoms. This low rate contrasts with the fact that over three-quarters of individuals consulted healthcare professionals for other reasons. Other studies have also reported low consultation rates, although the rate increases as symptom bother worsens [30] and in a study of Chinese patients with diabetes and OAB, patients who sought help not only had increased bother but also tended to have poorer QoL [31]. Although the Korean Continence Society has undertaken nationwide educational activities to increase awareness of urinary incontinence and OAB over a period of more than 20 years [32], adult education regarding the potential benefits of seeking treatment should clearly remain a priority; physicians should therefore be encouraged to initiate discussions with their patients regarding urinary symptoms to improve the treatment of LUTS and OAB symptoms, including SUI in South Korea.
The present data showed several differences between South Korea and the overall study results for China, South Korea, and Taiwan [17]. Firstly, the prevalence of LUTS was higher in South Korea than in the overall population. Secondly, lower percentages of individuals in South Korea visited healthcare professionals because of urinary tract symptoms. Thirdly, the pattern of symptoms was different in South Korea, with storage symptoms only as opposed to all three ICS categories being the most common ICS symptom group/combination. These differences could be related to cultural or genetic differences between the populations of the three countries. In addition, there is a possibility that questions might have been interpreted slightly differently in South Korea than in China and Taiwan.
Strengths of our study include the large sample size and the use of well-established and validated assessments translated into the local language. Although an internet-based survey excludes those who do not have internet access, internet coverage in South Korea is high (92% in 2015; data from: http://www.internetworldstats.com/) meaning that this approach did not result in a high likelihood of bias. This methodology is also cost efficient and has the advantage of avoiding the potential for embarrassment that may occur with questions of a sensitive or personal nature in face-to-face interviews. The lack of information to show the extent of coverage across South Korea represents a study limitation.
CONCLUSIONS
In conclusion, this study indicates that LUTS affect the majority of adults aged ≥40 years in South Korea, and that LUTS prevalence increases with increasing age. Only one in seven individuals in South Korea with LUTS consults healthcare professionals regarding urinary symptoms. These data highlight an important need to improve patient awareness of LUTS in South Korea, which should lead to improved rates of diagnosis and treatment.

 XML Download