

 PDF
PDF ePub
ePub Citation
 Print
Print


INTRODUCTION
Despite progress in the management of chronic bacterial prostatitis (CBP), many cases are undertreated and a significant number relapse [1]. The reasons are practically unknown and include host, bacterial, and treatment-related factors. While patients at increased risk for CBP recurrence and local (organ-specific) conditions have been clearly specified, bacterial- and treatment-related factors remain relatively unclarified. Of note, a combination of the above that includes incomplete bacterial eradication associated with treatment duration issues and alteration of drug resistance patterns of responsible bacteria has been proposed to contribute the most to risk of CBP recurrence [2]. Currently, the number of large studies evaluating trends in bacterial resistance of CBP pathogens is limited. Moreover, it is unknown whether bacterial resistance patterns increase after CBP relapse. The aim of our study was to investigate the above. A secondary aim was to determine the resistance patterns of responsible bacteria from patients with CBP in Greece.
Go to : 
MATERIALS AND METHODS
The material for this retrospective study consisted of bacterial isolates from urine and/or prostatic secretions or sperm cultures obtained from individuals with CBP visiting the prostatitis clinic of our department since its establishment (March 2009). Patients underwent the Meares-Stamey test (a few cases underwent the 2-glass test). Those presenting with febrile prostatitis were investigated by collection of a midstream specimen of urine culture (MUC) only. Samples from patients diagnosed with CBP for the first time were compared with samples from patients with a history of CBP and previous antibiotic treatment.
1. Exclusion criteria
Recorded demographic data and the patients' medical histories were collected. Patients with conditions affecting either bacterial virulence or host response (e.g., immunodeficiencies, abnormalities of the urogenital system) or individuals who had received antibiotics or immunosuppressive treatment within 4 weeks of their visit were excluded from the study.
2. Microbiological evaluation
Results of the Meares-Stamey test were considered positive when (1) bacteria grew in the culture of the expressed prostatic secretion (EPS) and VB3/PoPM (postprostate massage) urine sample and not in VB1 and VB2/PrPM (preprostate massage) samples and (2) bacterial colonies in the VB3 sample were higher than in the VB1 and VB2 samples [3]. Given that no standard cutoff for the number of bacteria in either urine or prostate secretion samples exists for the diagnosis of CBP, we defined no lower acceptable level for either one. Urine samples were cultured undiluted in blood on MacConkey agar plates (Kallestad Labs, Austin, TX, USA) and subjected to centrifugation for microscopic examination of the sediment. Culture results were evaluated by 2 specialist microbiologists who were not informed of the patient record. Identification was performed by conventional methods with use of the Vitek-2 Compact system (bioMérieux, Marcy-l'Étoile, France) and susceptibility testing was performed by disc diffusion and/or the Vitek-2 system. Interpretation of susceptibility results was based on Clinical and Laboratory Standards Institute guidelines [4].
3. Statistical analysis
Statistical analysis was performed by using Fisher exact test of significance. The accepted level of significance in this study was 0.05 (p<0.05 is significant).
The locally appointed ethics committee approved the research protocol.
Go to :
RESULTS
A total of 548 bacterial isolates obtained from the eligible patients during 1,324 visits for CBP recorded over a 6-year period (May 2009 to May 2015) were analyzed. In 114 cases, both VB2/PrPM and EPS/PoPM samples were positive and thus the patient's symptoms were determined to be related to conditions other than prostatitis. These cases were excluded from the study. Of the remaining cases, 44 were possibly false-negative results (negative culture despite the presence of bacteria in EPS/PoPM samples), and they also were excluded from the study. A total of 390 bacterial isolates diagnosed as CBP constituted the study material. Of these samples, 249 (41 EPS and 208 PoPM) were from patients diagnosed with CBP for the first time (group A) and 126 (31 MUC, 51 EPS, and 44 PoPM) were from patients with a history of CBP and previous antibiotic treatment (group B).
In group A, 200 cases (80.3%) were found with one type of bacteria from each isolate (monomicrobial), and 49 cases (19.7%) were identified with more than one type of bacteria from each isolate (polymicrobial). The corresponding percentages in group B were 96 (71.4%) and 30 cases (28.6%), respectively (Table 1).
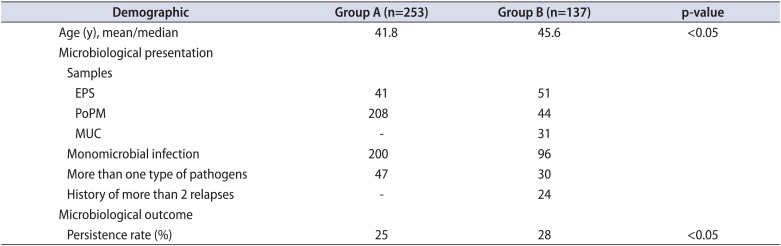
Table 1
Demographics and microbiological status of the 2 groups
![]()
In group A, the most frequent pathogen (in both monomicrobial and polymicrobial growth) was Escherichia coli (90 isolates). Other frequent types were coagulase-negative Staphylococcus species (CoNS) (71 isolates) and Enterococcus species (70 isolates). Streptococcus species (Streptococcus milleri, Streptococcus mitis, Streptococcus agalactiae, and Streptococcus parasanguinis; 21 isolates), Proteus mirabilis (20 isolates), Staphylococcus haemolyticus or Staphylococcus aureus (17 isolates), and Klebsiella species (4 isolates) were less frequent findings. In group B, isolates found were 52 E. coli, 38 CoNS (Staphylococcus hominis and S. haemolyticus), 31 Enterococcus species, 10 Streptococcus species (S. agalactiae and S. mitis oralis), 8 Proteus, 5 Klebsiella, 5 S. aureus, and a single monomicrobial isolate of Haemophilus influenza. Several rare bacteria were found among polymicrobial cultures of both groups (Table 2).
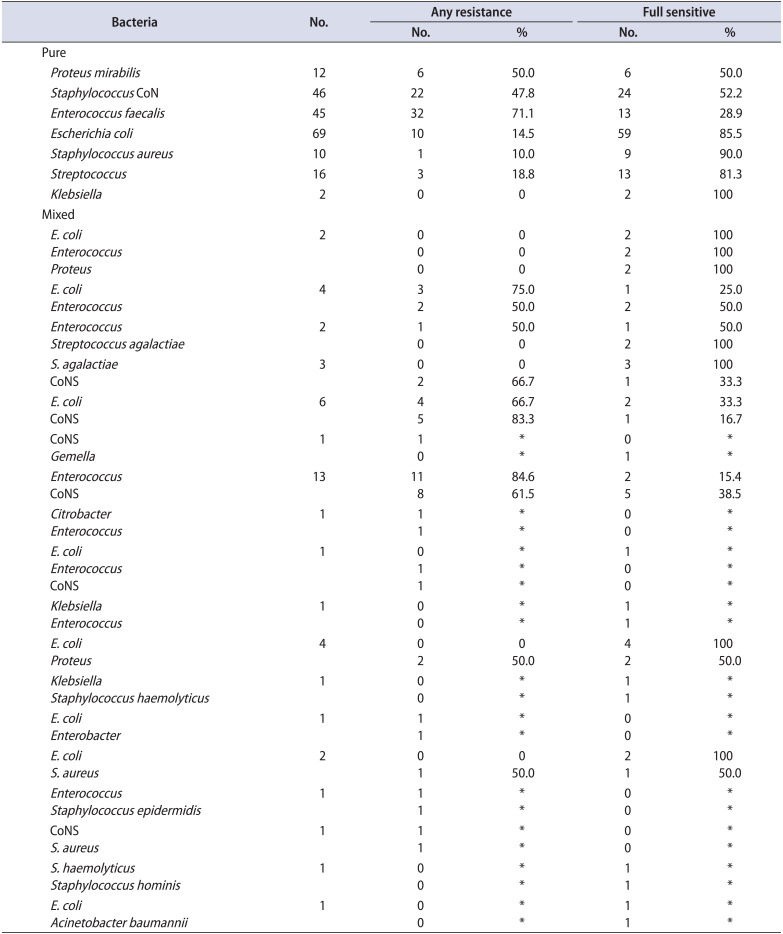
Table 2A
Isolates and resistance patterns of group A
![]()
Clinical relapses were mainly caused by microorganisms other than those causing the initial infection. Pathogens most commonly associated with clinical relapses were Enterococcus faecalis, CoNS, and E. coli. The mean time interval between CBP relapses was 13.9 months (range, 2–56 months).
Regarding Enterococcus strains in group A, these were found in 45 monomicrobial and 25 polymicrobial isolates. Only 13 of the 45 monomicrobial (28.9%) and 8 of the 25 polymicrobial (32%) isolates were fully sensitive (Table 2A). In group B, 21 monomicrobial and 11 polymicrobial isolates were found. Only 8 of the 21 monomicrobial isolates (38%) were fully sensitive. Strains from polymicrobial isolates showed a slightly higher susceptibility, because more than half (6 of 11, or 54.6%), were fully sensitive (Table 2B). However, although susceptibility to most antibiotics increased, an increasing resistance to fluoroquinolones during relapses was also noted (Tables 2A, 2B, 3, 4).
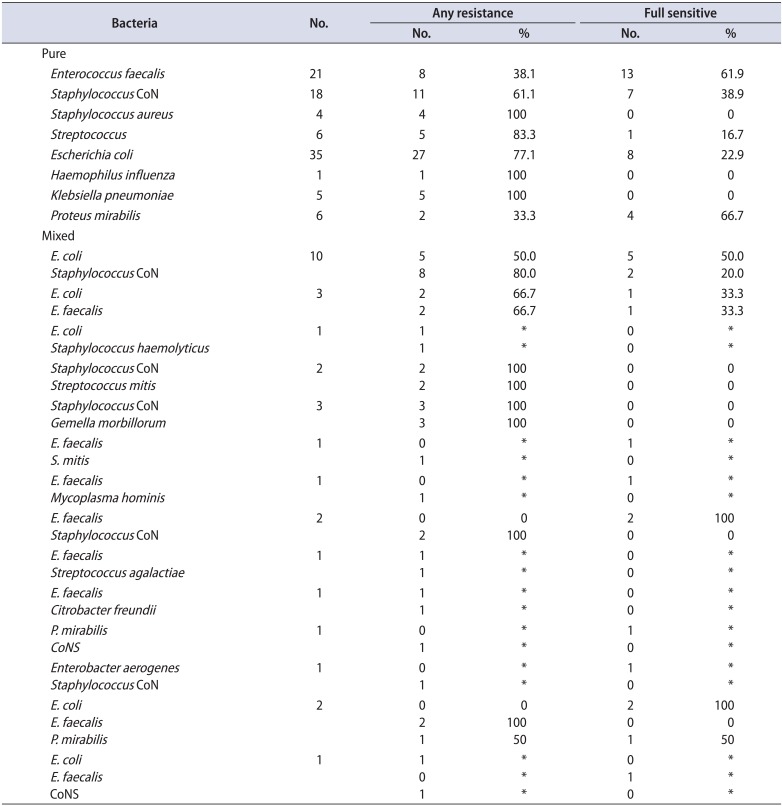
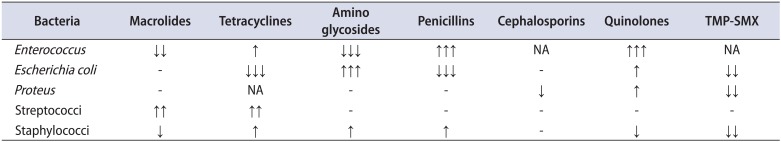
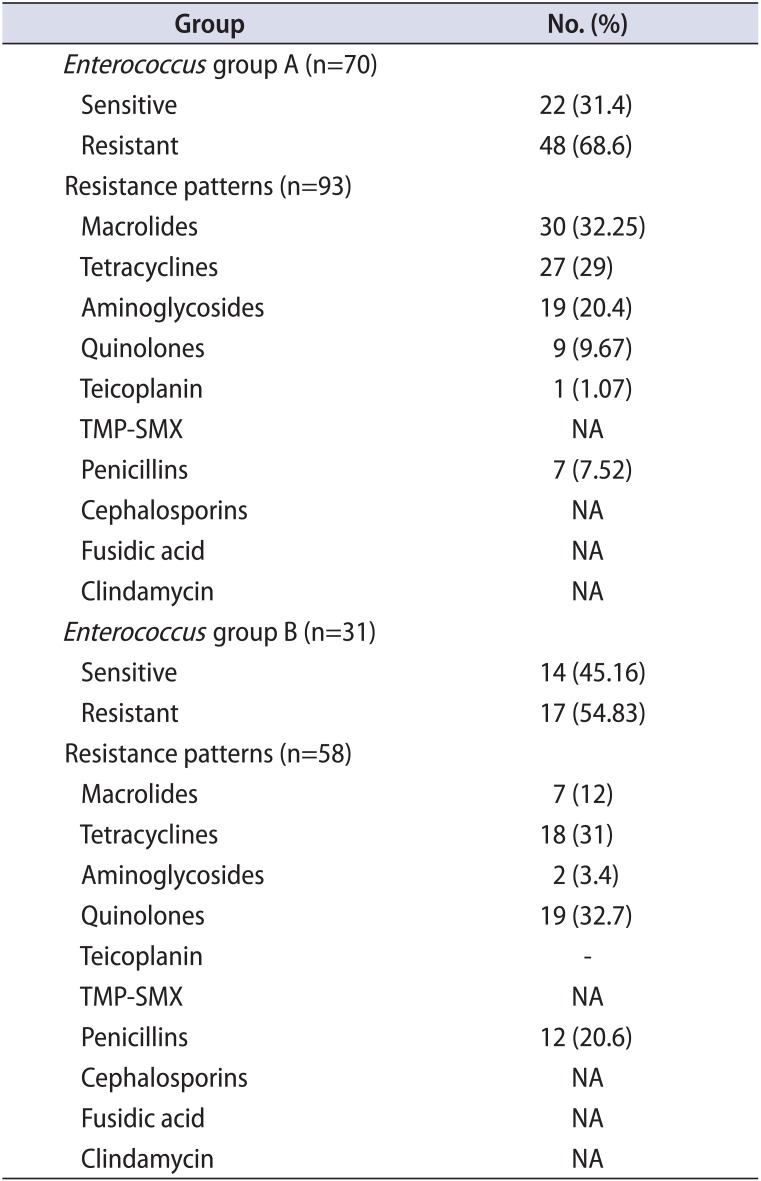
Table 2B
Isolates and resistance patterns of group B
![]()
Table 3
Trends of bacterial susceptibility
![]()
Table 4
Comparison of the Enterococcus faecalis resistance profile between the 2 groups
![]()
Regarding E. coli isolates, in group A, 69 monomicrobial and 21 polymicrobial isolates were found. Fifty-nine of the 69 monomicrobial isolates were fully sensitive (85.5%). Susceptibility results from the polymicrobial isolates were inferior, because 12 of the 21 cases (57.1%) were fully sensitive (Table 2A). In group B, 35 monomicrobial and 17 polymicrobial isolates were found. Twenty-seven of the 35 monomicrobial isolates (77.1%) were fully sensitive. Susceptibility results from the polymicrobial isolates were inferior, because 10 of the 17 cases (58.8%) were fully sensitive (Table 2B). The overall sensitivity to most antibiotics for groups A and B was comparable; however, an increasing resistance to aminoglycosides during relapses was clearly shown (Tables 2A, 2B, 3, 5).
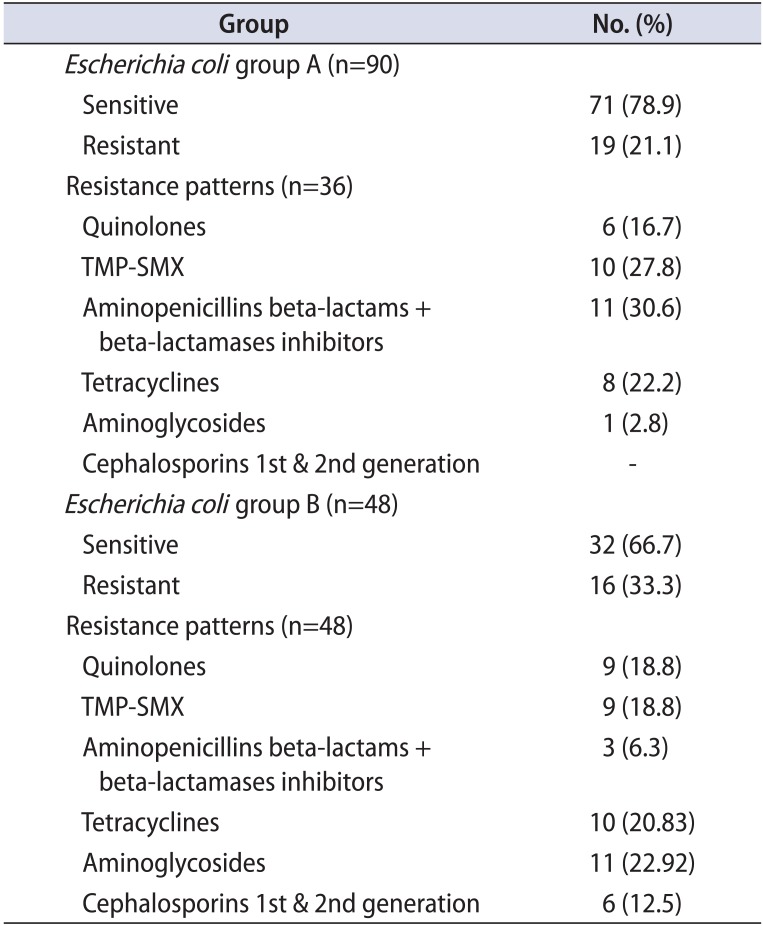
Table 5
Comparison of the Escherichia coli resistance profile between the 2 groups
![]()
CoNS isolates were of the species S. haemolyticus and S. hominis. In group A, 46 monomicrobial and 25 polymicrobial isolates were found. Twenty-four of the 46 monomicrobial isolates (52.2%) were fully sensitive. A slightly increased resistance was noted in the strains from polymicrobial isolates, because only 11 of the 25 (44%) were fully sensitive (Table 2A). In group B, 18 monomicrobial and 19 polymicrobial isolates were found. Eleven of the 18 were fully sensitive (61.1%). Contrary to the above, most CoNS strains from polymicrobial isolates were fully sensitive (14 of 19 or 73.6%; Table 2B). Interestingly, the overall full sensitivity was greater in group B (relapses) than in group A (first-time CBP presenters) (Tables 2A, 2B, 3, 6).
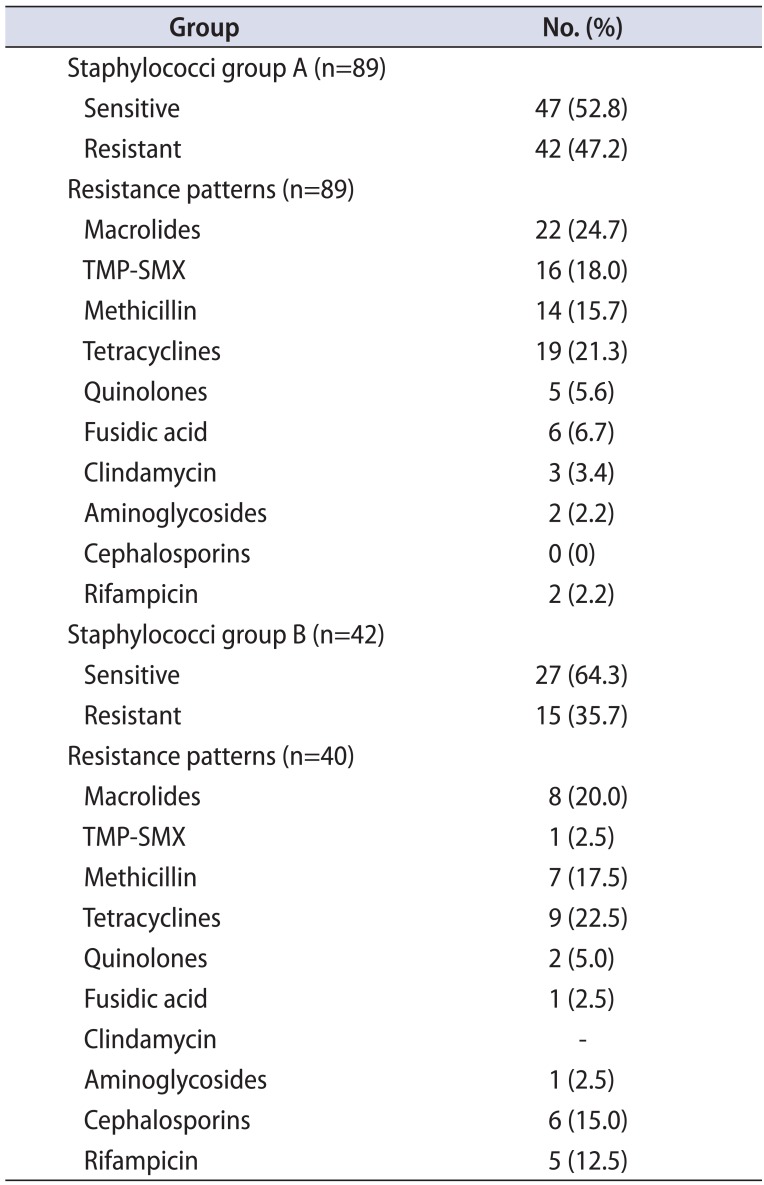
Table 6
Comparison of the staphylococci resistance profile between the 2 groups
![]()
The limited number of Proteus isolates did not allow for valuable comparisons. Group A grew 12 monomicrobial isolates. Four Proteus strains were also found in polymicrobial isolates. Six of the 12 monomicrobial isolates (50%) were fully sensitive. Regarding strains found in polymicrobial isolates, most (3 of 4 or 75%) were fully sensitive. In group B, six monomicrobial isolates and three cases within multiple colony forms were found. Four of the six pure Proteus isolates (66%) were fully sensitive (Tables 2A, 7). Proteus strains found in polymicrobial isolates from prostatic secretion samples were resistant, whereas those cultured from PoPM urine samples (33%) were fully sensitive (Tables 2B, 7).
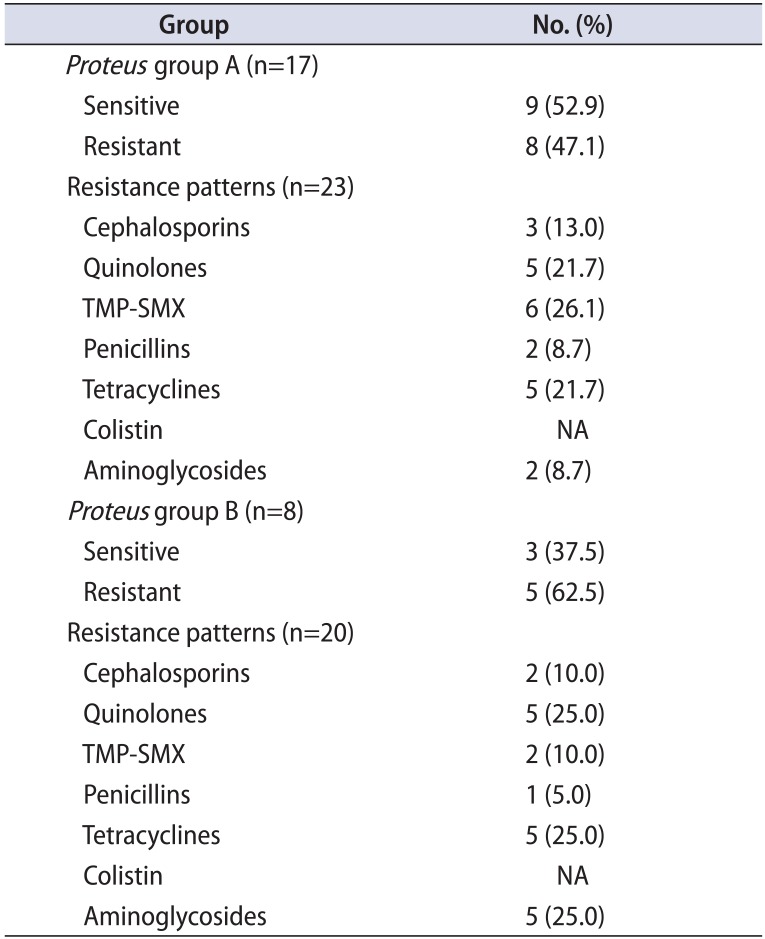
Table 7
Comparison of the Proteus resistance profile between the 2 groups
![]()
Klebsiella isolates were also rare. In group A, three monomicrobial and 2 polymicrobial isolates were found. All five were fully sensitive (Table 2A). In group B, 5 monomicrobial Klebsiella isolates were found which were all fully sensitive (Table 2B). Of note, the overall full sensitivity was greater in monomicrobial cultures of group B (relapses) than in those of group A (first-time CBP presenters) (Table 3).
The Streptococcus isolates were of the species S. agalactiae, S. parasanguinis, S. mitis oralis, and Streptococcus milleri. In group A, 16 pure and 7 mixed cases were found. Thirteen of the 16 pure Streptococcus isolates (81%) were fully sensitive and the remaining 2 were multisensitive. All seven mixed cases (100%) were fully sensitive (Table 2A). In group B, 6 pure and 5 mixed cases were found. Five of the 6 pure Streptococcus isolates (83%) were fully sensitive, while the remaining one was multisensitive. Comparably, all mixed streptococci isolates (100%) were fully sensitive (Table 2B).
In group A, 10 monomicrobial S. aureus isolates were found and 8 strains were found in polymicrobial isolates. Most were fully sensitive (Table 2A). In group B, four monomicrobial and one polymicrobial S. aureus isolates were found. All were fully sensitive (Table 2B). Again, the overall full sensitivity was greater in group B than in group A (100%–100% vs. 90%–62%) (Tables 2A, 2B, 3, 8).
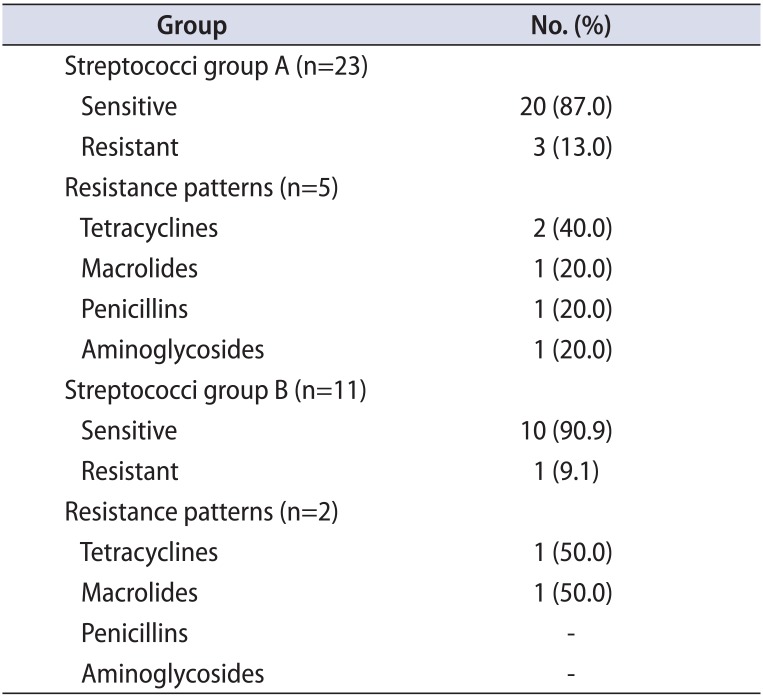
Table 8
Comparison of the streptococci resistance profile between the 2 groups
![]()
Go to :
DISCUSSION
The epidemiological and microbiological characteristics in this study are largely consistent with those of our previous study [5]. However, the proportion of gram-positive isolates in the current study was higher. The reason for this difference is unknown; however, the higher proportion may be associated with a better understanding of the role of gram-positive bacteria in the development of disease and the consequent awareness of clinicians and laboratory assistants. Another interesting finding was the greater number of assessable EPS samples in group B. A probable explanation may be the familiarization of patients in group B with the examination process. An interesting finding of this study was the higher rate of polymicrobial isolates in group B (31% vs. 19% in group A). The interpretation of this finding is twofolds: on the one hand, it is possible that repeated antibiotic treatment reveals participating microbial members of the prostate biofilm, and on the other hand, it may suggest a chronic decline of immune system function [6]. In addition, the wide variation in the number of colonies, the presence of different microorganisms in the same culture, and the presence of CoNS strengthen the newer appreciation of CBP as a biofilm disease [7].
Differences in the frequency of several pathogens between the present study and other studies [8] may represent time trends in prostatic bacterial colonization. In confirmation of the above, gram-positive bacteria are more commonly identified in current studies than in the past [8]. This epidemiological shift to gram-positive selection can be attributed either to the large use of fluoroquinolones not able to eradicate gram-positive infections or to the globally increasing bacterial resistance [9].
Current treatment of CBP demands the prescription of large quantities of antibiotics. For this reason, it has been hypothesized that the antibiotic susceptibilities of the involved urinary pathogens are gradually altered. Normally, this results in an increase in resistance to commonly used antimicrobials [10]. In fact, it has been demonstrated that a patient who has received a recent antibiotic is up to seven times as likely to be colonized with a drug-resistant strain than a patient who has not recently taken an antibiotic [11]. In addition, over the course of the 3 months that are needed for the antibiotic effect to be eliminated, many bacterial mutations promoting antibiotic resistance can be identified [12]. As a response to the large variety of consumption of antimicrobial agents, many bacteria have become resistant to multiple antibiotics, and the resistance spectrum is as extensive as the type of antibiotics used. Resistant bacteria proliferate after other bacteria are killed off by an antibiotic. Moreover, resistance genes can be transferred to other isolates of the same or different bacterial species by mobile genetic elements [13].
Surprisingly, a reduction in resistance may also occur. Although few data exist on this issue, the phenomenon is more likely to be attributed to fitness costs of resistance mutations [14]. Being young and otherwise healthy, most patients in group B had not received any type of antibiotic other than quinolones for a long time. For this reason, a missing fitness burden for this cohort of uropathogens is not to be excluded. Of note, the exact mechanism as well as the frequency of resistance at any given level of antibiotic use and the rate at which that frequency will change with changes in antibiotic use patterns is not known [15]. It seems reasonable that mutations associated with a reduction in resistance may occur, and in fact, mutations to increased antibiotic sensitivity in naturally occurring gonococci have been described in the past [16]. Moreover, a combined effect between phytotherapeutic agents and antibiotics has also been described [17]. In our study, the majority of patients in group B were prescribed phytotherapeutics; however, such an interaction cannot be deduced because a significant reduction in bacterial resistance was mainly observed for antibiotics that were not used in the study (penicillins, macrolides). The notable resistance reduction that was observed for the less used antibiotics (TMP-SMX, tetracyclines, and aminoglycosides) is likely explained by the fact that they are uncommonly prescribed for the treatment of CBP in Greece [18].
On the other hand, the observed increase in resistance to quinolones of almost all the most common bacteria that cause CBP can be attributed to the fact that quinolones have been used so widely and for so long since their introduction into clinical practice. Cai et al. [19] found that both gram-positive and gram-negative organisms show a decreasing susceptibility to ciprofloxacin and a good susceptibility to levofloxacin. The alarming increase in resistance of Enterococcus strains to ciprofloxacin shown in this study was also evident in the above-mentioned study; however, those authors found a good activity profile of levofloxacin [19]. Given that exposure to quinolones has been associated with high rates of acquisition of resistant bacteria, a possible explanation for the above phenomenon is the longer use of ciprofloxacin (when compared with levofloxacin) [20]. Similarly, the slight reduction in resistance to quinolones observed in staphylococcal strains could be due to the limited use of quinolones against staphylococci, which were not considered pathogens until recently [21]. Given that fluoroquinolone-resistant clinical isolates of bacteria have emerged readily worldwide, reduction in resistance is of utmost importance for future CBP treatment demands [22]. Of note, Greece is the highest user of quinolones and has the highest incidence of quinolone-resistant E. coli isolates, which is the most common pathogen [18]. There are no national data on antimicrobial resistance among uropathogens responsible for community-acquired urinary tract infections; however, anecdotal data and clinical studies show a reduced activity of quinolones against enterococci. Among quinolones, levofloxacin and moxifloxacin seem to be effective against other gram-positive uropathogens. Resistance of E. coli to quinolones increases over time.
Actually, the rapid emergence of antibiotic-resistant pathogens constitutes a global public health threat. Currently, the main approach to mitigation of antibiotic resistance is a focus on limiting the use of antibiotics and minimizing the duration of therapy [23]. In light of the evidence emerging from this retrospective study, it seems reasonable that a decrease in quinolone use—especially in the community setting—is needed to achieve a reduction in antibiotic resistance. In a similar case, a nationwide recommendation of the Finnish Study Group for Antimicrobial Resistance to reduce macrolide antibiotic use in response to increasing resistance to erythromycin by group A streptococci achieved a quick reduction in resistance [20]. However, limiting both the long-term prophylactic and therapeutic use of antibiotics may increase the risks of bacterial infections. Missing the opportunity for effective elimination of a small amount of planktonic cells by prompt application of antibiotics may lead to the development and persistence of chronic illness. The latter is mainly valid for infections caused by microbial biofilms, such as CBP, which are naturally resistant to further antibiotic treatment [24]. Since the optimal duration of antibiotic therapy for CBP is well defined, antibiotic selection may be the key point for the achievement of bacterial resistance reduction. Therefore, empiric treatment is not recommended. On the contrary, treatment should be tailored to the antibiotic susceptibility test. The final choice of which antibiotic to use in men with CBP should also be based on other factors, including local patterns of bacterial resistance and pharmacokinetic–pharmacodynamic parameters [25]. Alternative treatment approaches such as antibiotic de-escalation consisting of initial quinolone administration that is stopped and narrowed in spectrum [26], quinolone-based combination therapy [27], or even administration of potentially useful older antibiotics such as minocycline, doxycycline, and josamycin [2829] should be considered. Finally, other agents that achieve high prostatic concentrations, such as erythromycin and probably other macrolides and clindamycin as well [30], could be tested when applicable to provide better eradication rates and make the creation of drug-resistant strains less likely.
The major strength of this study was the large cohort and the good documentation. On the other hand, the limitations of retrospective analysis must be considered because they can impact or influence the interpretation of the findings of such research. Three possible weaknesses were detected: a potential disproportion between the 2 groups, an inconsistency regarding the tests that were conducted for each patient, and the difficulty in quantifying the exact number of relapses. Although no selection of controls occurred, no statistically significant differences between the demographic and clinical characteristics of the 2 groups were found. As mentioned in the Methods, most patients were not able to provide an EPS sample, and thus the diagnosis was based upon VB3/PoPM sample cultures. As a consequence, no absolute standard that allows easier comparisons was established. On the other hand, both PoPM and the EPS/VB3 combination were demonstrated as being equally diagnostic and therefore comparisons between them are acceptable [3].
Go to :
CONCLUSIONS
Comparison of the resistance profile of responsible bacteria between first-time-diagnosed CBP patients and patients with a history of CBP revealed notable differences that could be attributed to previous antibiotic treatment. Given the regional variation in the distribution of uropathogens and their susceptibility pattern to antibiotics, knowledge of the susceptibility of causative microorganisms to various antibiotics is necessary to select the optimal treatment, which will lead to better eradication rates and make the creation of drug-resistant strains less likely.
Go to :
 XML Download