Journal List > Diabetes Metab J > v.41(2) > 1084941

Min, Ku, Lee, Kim, Ahn, Lee, Kokubo, Yoshida, Cho, and Cha: Addition of Ipragliflozin to Metformin Treatment in Korean Patients with Type 2 Diabetes Mellitus: Subgroup Analysis of a Phase 3 Trial

Abstract

Background

This is a subgroup analysis of Korean patients from a phase 3 clinical trial investigating the efficacy and safety of ipragliflozin in patients with type 2 diabetes mellitus inadequately controlled with metformin.

Methods

This multicenter, placebo-controlled, double-blind, parallel-group study was carried out between November 2011 and January 2013. Patients entered a 2-week placebo pretreatment period, followed by a 24-week treatment period with either ipragliflozin (50 mg/day) or placebo, while continuing metformin. Efficacy outcomes (glycosylated hemoglobin [HbA1c], fasting plasma glucose [FPG], and body weight) and safety outcomes (treatment-emergent adverse events [TEAEs]) were measured and compared between the two treatment groups for patients enrolled in all 18 study sites in Korea.

Results

Eighty-two Korean patients received ipragliflozin (n=43) or placebo (n=39) during the study period. Mean changes in HbA1c levels from baseline to the end of treatment were –0.97% in the ipragliflozin group and –0.31% in the placebo group, with an adjusted between-group difference of –0.60% (P<0.001). Compared to placebo, FPG and body weight also decreased significantly (both P<0.001) from baseline after treatment in the ipragliflozin group, with between-group differences of –21.4 mg/dL and –1.53 kg, respectively. Decreased weight was the most common TEAE in the ipragliflozin group (7.0%); there were no reports of genital and urinary tract infection.

Conclusion

Ipragliflozin treatment in addition to metformin led to significant improvement in glycemic outcomes and reduction in body weight in Korean patients with type 2 diabetes mellitus, compared with metformin treatment alone; the safety profile was comparable in both groups.

INTRODUCTION

The incidence of diabetes has increased by more than 6-fold over the past 40 years in Korea [1]. Recent estimates by the Korean Diabetes Association indicate that type 2 diabetes mellitus affects approximately 2.7 million adults (aged 30 years or older), placing the current prevalence of type 2 diabetes mellitus at 8.0% [2]. With rising body mass index (BMI) and increasing incidence of metabolic syndrome in Korea [23], the prevalence of diabetes and its associated morbidity and mortality is expected to continue on an upward trend.
The Korean treatment guideline for diabetes recommends lifestyle modifications (diet and exercise) and an oral hypoglycemic agent (typically metformin) as the first-line therapy for the management of hyperglycemia in type 2 diabetes mellitus [4]. If optimal glycemic control cannot be attained with first-line therapy, other classes of glucose-lowering agents that tar-get insulin secretion such as sulfonylureas and dipeptidyl peptidase-4 inhibitors are commonly added to improve glycemic control [4]. However, the efficacy of these agents may eventually diminish as β-cell function deteriorates and insulin secretory capacity reduces with disease progression [5]. Because impaired insulin secretion and increased insulin resistance are the main pathological features of type 2 diabetes mellitus [5], and Asian patients have the propensity to develop diabetes with greater insulin resistance and reduced insulin secretion compared with white patients [67], combination therapy with other classes of agents that lower blood glucose in an insulin-independent manner will eventually be necessary to maintain glycemic control, especially in Asian patients with diabetes.
Sodium-glucose cotransporter 2 (SGLT2) inhibitors are a new class of oral hypoglycemic agents that lower blood glucose levels via mechanisms independent of insulin. As SGLT2 is the main glucose transporter that facilitates renal glucose reabsorption [8], SGLT2 inhibitors block the reabsorption of glucose in the kidney and increase urinary glucose excretion; thereby, lowering blood glucose levels. The mechanism of SGLT2 inhibitors in lowering blood glucose is insulin-independent, and therefore patients with type 2 diabetes mellitus are likely to benefit from SGLT2 inhibitor therapy regardless of the level of pancreatic β-cell function or the degree of insulin resistance.
The 2015 update to the position statement of the American Diabetes Association [9] and the 2015 Korean treatment guidelines for diabetes [4] now include SGLT2 inhibitors as a possible option for dual therapy with metformin if target glycosylated hemoglobin (HbA1c) levels are not reached within 3 months. Metformin and SGLT2 inhibitor dual therapy may also be initiated from the start if a patient has a HbA1c level greater than 7.5% at diagnosis [4].
Although the efficacy and safety of ipragliflozin (a SGLT2 inhibitor) in combination with metformin have been demonstrated in previous trials conducted in Asian patients with type 2 diabetes mellitus [1011], the effects in Korean patients, specifically, remains to be
evaluated. This article presents a subgroup analysis of a phase 3, multicenter, placebo-controlled, double blind, parallel-group study [11], with the objective of examining the efficacy and safety of ipragliflozin in combination with metformin in Korean patients with type 2 diabetes mellitus.

METHODS

This was a phase 3, multicenter, placebo-controlled, double-blind, parallel-group comparative study. The Institutional Review Board at each study site reviewed and approved the study protocol, case report forms, and documents used for informed consent. The study was conducted in accordance with Good Clinical Practice, the International Conference on Harmonization Technical Requirements for Registration of Pharmaceuticals for Human Use, as well as applicable local laws and regulations. All patients provided written informed consent before study enrollment. The study design was described in a previous report [11]. This subgroup analysis only included the Korean patients, which comprised patients recruited from all 18 sites in Korea between November 2011 and January 2013.

Study population

Inclusion criteria were as follows: aged ≥20 years; diagnosed with type 2 diabetes mellitus ≥12 weeks before enrollment; underwent a stable diet and exercise regimen for ≥8 weeks; treated with metformin at a stable dose of ≥1,500 mg/day (or ≥1,000 mg/day if higher doses were not administered due to safety concerns); recorded as having baseline HbA1c between 7% to 10% and BMI between 20.0 and 45.0 kg/m2. Briefly, exclusion criteria included patients with type 1 diabetes mellitus, patients who received insulin within 12 weeks of enrollment, patients with proliferative diabetic retinopathy and renal disease, patients who were pregnant or lactating, and patients who were women of childbearing potential and not willing to use appropriate contraception during the study. A full list of exclusion criteria was previously reported [11]. This study was registered at ClinicalTrials.gov (identifier NCT01505426).

Study design and treatments

The total duration of the study was 30 weeks and included a single-blind 2-week placebo pretreatment period (visit 1), followed by a 24-week double-blind treatment period (visits 2 to 9), and a 4-week follow-up period (visit 10). Patients who were receiving hypoglycemic agents other than metformin entered a washout period of at least 8 weeks prior to visit 1. Inclusion and exclusion criteria were assessed for each patient at visit 1, and eligible patients entered a 2-week placebo pretreatment period. At visit 2 (week 0), all eligible patients were randomly assigned to receive either ipragliflozin (50 mg/day) or a placebo as an additional treatment to metformin. Randomization was conducted in a 1:1 ratio by patient stratification for study site and HbA1c level at visit 1 (<8.0% or ≥8.0%) using a computer-generated randomization schedule. After the randomization procedure, the patients returned during the 24-week treatment period for visit 3 (week 2), visit 4 (week 4), and visits 5 to 9 scheduled every 4 weeks until the end of treatment (visit 9, week 24). The follow-up visit (visit 10) was scheduled 4 weeks after the end of treatment. The study drugs used were indistinguishable in terms of packaging and appearance. Assignment of study drug was masked to all patients, investigators, and study sponsor. Treatment codes were only released after the study database was locked.
With the exception of the prescribed study drug and metformin, use of any drugs that affect plasma glucose levels was prohibited during the study period. Continuous systemic administration of corticosteroids, immunosuppressants, or loop diuretics for chronic diseases were also prohibited, although topical or temporary use was permitted. Changes to diet and exercise therapy were also prohibited until the end of study period.

Study assessments

All clinical laboratory assessments were carried out at a central laboratory (Mitsubishi Chemical Medience Corporation, Tokyo, Japan) using routine methods. The primary efficacy outcome, HbA1c, was measured every 4 weeks during the treatment period. Secondary efficacy parameters included fasting plasma glucose (FPG; measured at each visit), body weight (measured at each visit), waist circumference (measured at visits 2 and 9), and fasting serum insulin (FSI; measured at visits 2, 6, and 9). Values measured at visit 2 (week 0 of treatment period) were used as the baseline for all efficacy variables.
Safety assessments included adverse events, vital signs, and laboratory tests (hematology, serum chemistry, and urinalysis; visits 2 to 10). Adverse events that were observed after the first administration of the study drug were defined as treatment-emergent adverse events (TEAEs). Serious TEAEs were any TEAEs for which the patient outcome was one of the following: death, threat to life, persistent or significant disability or incapacity, congenital anomaly or birth defect, required inpatient hospitalization or prolonged hospitalization and other medically important interventions to prevent permanent impairment or damage. A 3-grade scale was used to assess the severity of TEAEs: mild-resulted in no disruption of normal daily activities; moderate-affected normal daily activities; and severe-resulted in an inability to perform daily activities. To maintain blinding, measurements of urinary glucose were not permitted throughout the entire study period, unless deemed necessary due to safety concerns.

Statistical analyses

The sample sizes for each region where the study was conducted (Korea and Taiwan) were estimated based on the results of a dose finding study conducted in Japan [12]. It was estimated that at least 34 evaluable patients per treatment group would be required to detect differences in the change from baseline in HbA1c levels between the treatment groups with 90% power at the 5% significance level in each country.
The full analysis set (FAS) consisted of all patients who received at least 1 dose of the study drug, and in whom at least 1 efficacy variable was measured after administration of the study drug during the treatment period. The per protocol set (PPS) was a subset of the FAS and further satisfied the following criteria: fulfilled eligibility criteria, received the study drug and metformin for at least 56 days during the treatment period, achieved ≥80% compliance with the study drug and metformin during the treatment period, did not use prohibited concomitant medication, and did not have any clinically significant protocol deviations. The safety analysis set (SAF) consisted of all patients who received at least one dose of the study drug during the treatment period.
Primary and secondary efficacy outcomes were assessed in the FAS and PPS (sensitivity analyses), while safety outcomes were assessed in the SAF. For calculation of changes from baseline to the end of treatment, missing values at the end of treatment were derived using the last observation carried forward method. The changes in primary and secondary outcomes from baseline to the end of treatment were compared between the treatment groups using analysis of covariance with the respective baseline value as a covariate and treatment group as a fixed effect. Demographics, baseline characteristics, and safety outcomes were summarized by treatment group. Continuous variables were reported as mean±standard deviation, while categorical data were expressed as number (%) in each treatment group. Differences between the two treatment groups were analyzed using two-sample t-test for continuous variables or Fisher exact test for categorical variables. Homeostatic model assessment of insulin resistance (HOMA-IR) and homeostatic model assessment of β-cell function (HOMA-β) were calculated using the following formulas: HOMA-IR=[FSI (µU/mL)×FPG (mg/dL)]/405; HOMA-β=[360×FSI (µU/mL)]/[FPG (mg/dL)–63]. The software SAS version 9.1.3 (SAS Institute Inc., Cary, NC, USA) was used for all statistical analyses and a P value less than 0.05 was considered to be statistically significant.

RESULTS

Patient disposition and baseline characteristics

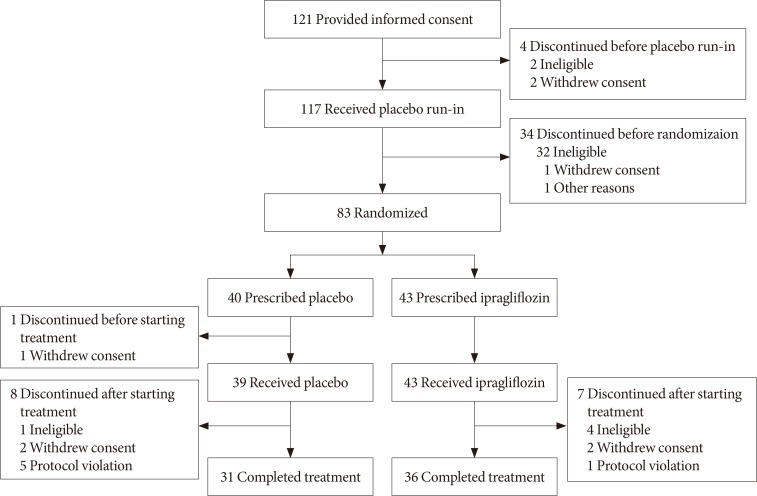
A total of 238 patients entered the study from 30 sites in Korea and Taiwan [11]. Of these, 121 (50.8%) were enrolled from Korea. Fig. 1 shows patient disposition during the study period. A total of 38 patients discontinued the study before randomization, and 83 patients were randomized at visit 2 (43 to ipragliflozin and 40 to placebo). One patient discontinued before starting treatment, leaving 43 who received ipragliflozin and 39 who received placebo during the treatment period. These patients constituted the FAS and SAF. Among them, 67 patients (ipragliflozin 36, placebo 31) completed treatment, of whom 35 and 31 from the ipragliflozin and placebo groups, respectively, were included in the PPS.
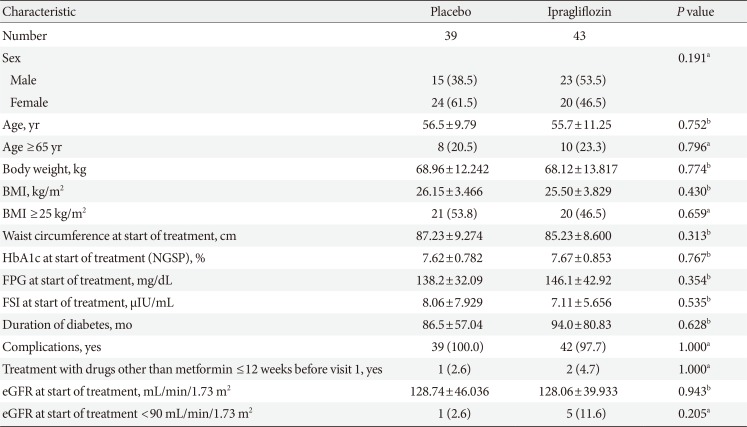
Patient demographics and baseline characteristics for the FAS are presented in Table 1. Age, BMI, and waist circumference of both groups were comparable at baseline. There were some slight imbalances between the two groups in terms of gender distribution and proportion of patients with an estimated glomerular filtration rate of <90 mL/min/1.73 m2, although these differences did not reach statistical significance. Glycemic variables such as HbA1c, FPG, and FSI were similar at baseline, and there were no significant differences between the two groups in duration of diabetes and the proportion of patients with complications. The mean±standard deviation duration of exposure to study drug was 148.0±49.49 and 147.3±47.81 days in the ipragliflozin and placebo groups, respectively. Mean compliance rates were above 95% in both groups.

Efficacy

Primary efficacy outcome

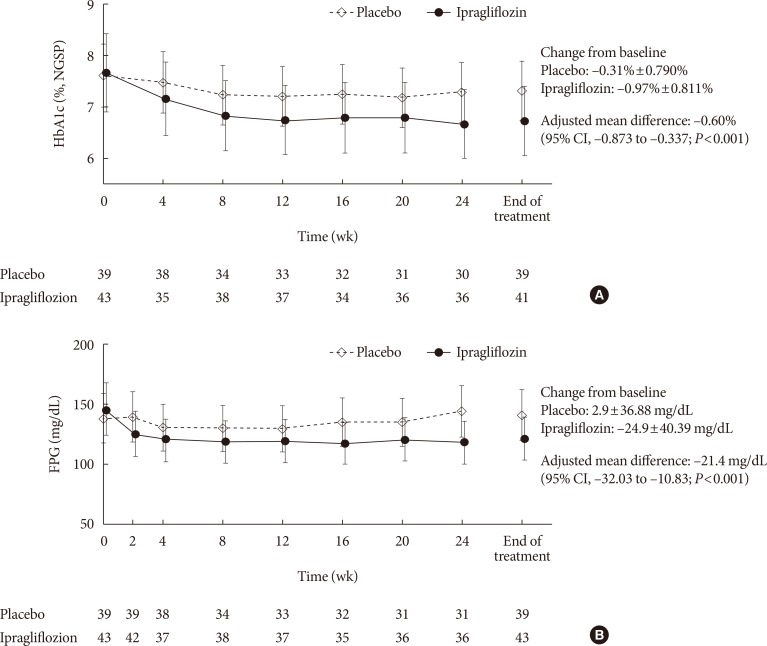
Fig. 2A shows the change in mean HbA1c levels from baseline to the end of treatment period in both groups. Mean HbA1c decreased over time to a greater extent in the ipragliflozin group than in the placebo group. Mean±standard deviation change of HbA1c from baseline to the end of treatment was –0.97%±0.811% and –0.31%±0.790% in the ipragliflozin and placebo groups, respectively, with a between-group adjusted mean difference of –0.60% (95% confidence interval [CI], –0.873% to –0.337%; P<0.001). The difference between the ipragliflozin and placebo groups was maintained in subgroup analyses, after stratifying patients by gender and baseline HbA1c (data not shown). The proportion of patients who achieved the target HbA1c level of <7.0% increased from 16.3% (7/43) at baseline to 75.6% (31/41) at the end of treatment in the ipragliflozin group, and from 7.7% (3/39) to 41.0% (16/39) in the placebo group. The proportion of patients who achieved the target HbA1c level of <6.5% increased from 0.0% (0/43) at baseline to 29.3% (12/41) at the end of treatment in the ipragliflozin group, and from 0.0% (0/39) to 7.7% (3/39) in the placebo group. HbA1c results with the PPS population were consistent with the FAS (data not shown).

Secondary efficacy outcomes

The time-courses of the changes in mean FPG in both treatment groups are shown in Fig. 2B. Mean FPG decreased over time in the ipragliflozin group but increased slightly in the placebo group. The mean±standard deviation changes in FPG from baseline to the end of treatment were –24.9±40.39 mg/dL in the ipragliflozin group and 2.9±36.88 mg/dL in the placebo group, with a between-group adjusted mean difference of –21.4 mg/dL (95% CI, –32.03 to –10.83 mg/dL; P<0.001).
Body weight decreased from baseline to the end of treatment in both groups (Table 2). The mean±standard deviation changes in body weight were –2.66±2.20 kg in the ipragliflozin group and –1.13±1.90 kg in the placebo group. The between-group adjusted mean difference in the changes in body weight from baseline to the end of treatment was –1.53 kg (95% CI, –2.44 to –0.61 kg; P=0.001). By the end of treatment, 32.6% (14/43) and 12.8% (5/39) of patients in the ipragliflozin and placebo groups, respectively, had a weight reduction of ≥5%.
HOMA-IR decreased in the ipragliflozin group (change, –0.34±1.79) and increased in the placebo group (change, 0.41±1.78) from baseline to the end of treatment. However, the between-group adjusted mean difference of –0.75 (95% CI, –1.59 to 0.09; P=0.079) was not significant (Table 2). Similarly, HOMA-β increased in the ipragliflozin group (change, 6.24±36.68) and decreased in the placebo group (change, –1.37±77.07), but the between-group adjusted mean difference of 2.88 (95% CI, –20.58 to 26.34; P=0.807) was not significant (Table 2). The changes in waist circumference and FSI from baseline to the end of treatment were comparable between both treatment groups (Table 2). Results of the secondary outcomes with the PPS population were consistent with the FAS (data not shown).

Safety

Clinical and laboratory parameters

The changes in clinical and laboratory parameters from baseline to the end of treatment in the SAF population are presented in Table 3. At the end of the treatment period, systolic and diastolic blood pressures decreased in the ipragliflozin group (change in systolic/diastolic blood pressure: –9.6±14.72/–5.9±10.23 mm Hg) but not in the placebo group (change, 2.5±12.98/0.5±8.33 mm Hg; systolic blood pressure, P<0.001; diastolic blood pressure, P=0.003). Plasma triglyceride levels decreased significantly in the ipragliflozin group but increased in the placebo group (change, –29.2±77.49 mg/dL vs. 11.3±98.60 mg/dL; P=0.041). High density lipoprotein cholesterol (HDL-C) levels improved significantly with ipragliflozin treatment compared to placebo group (change, 3.9±6.62 mg/dL vs. 0.4±6.02 mg/dL; P=0.014). Although mean low density lipoprotein cholesterol (LDL-C) levels decreased with ipragliflozin treatment (change, –2.4±29.67 mg/dL) and increased with placebo (change, 7.2±23.89 mg/dL) from baseline to the end of treatment, the difference did not reach statistical significance (P=0.114).

Treatment-emergent adverse events

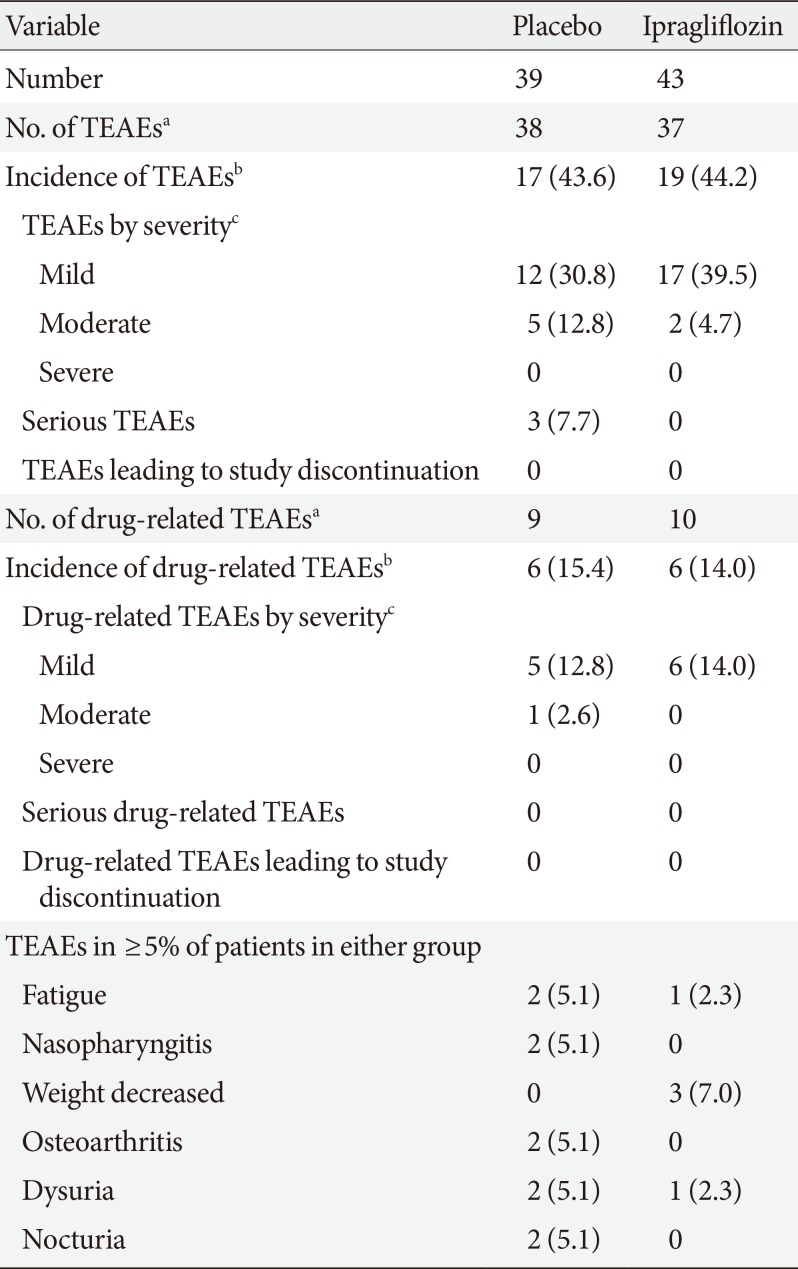
The incidence of TEAEs in the SAF population are summarized in Table 4. TEAEs were experienced by 44.2% of patients in the ipragliflozin group and 43.6% in the placebo group. All TEAEs were either mild or moderate in severity. The incidences of serious TEAEs were 0.0% in the ipragliflozin group and 7.7% in the placebo group. Drug-related TEAEs occurred in 14.0% and 15.4% of patients in the ipragliflozin and placebo group, respectively. The most common TEAE in the ipragliflozin group was decreased weight; however, fatigue, nasopharyngitis, osteoarthritis, dysuria, and nocturia were more commonly reported in the placebo group. There were no reports of TEAEs related to hypoglycemia, urinary tract infection, genital infection, or pollakiuria in the ipragliflozin group. Polyuria occurred during the treatment period in only one patient (2.3%), who was in the ipragliflozin group.

Renal function, hematology, electrolytes, and liver function

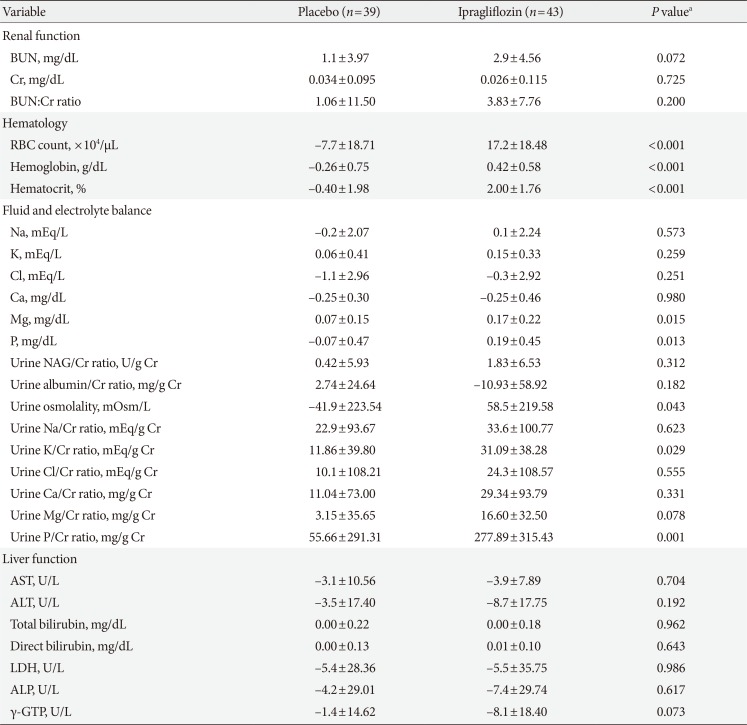
Table 5 summarizes the changes in variables related to renal function, hematology, fluid and electrolyte balance, and liver function from baseline to the end of treatment in the SAF population. The changes in laboratory variables were mostly comparable between-groups, with the exception of slightly greater increases in hematology parameters (red blood cell count, hemoglobin, and hematocrit), and some fluid and electrolyte balance variables (magnesium, phosphorus, urine osmolality, urine potassium: creatinine ratio, and urine phosphorus: creatinine ratio) in the ipragliflozin group than in the placebo group. These changes in hematology and electrolyte parameters were not clinically significant and/or were within the normal range. Changes in variables related to renal function and liver function were not significantly different between the two treatment groups.

DISCUSSION

In the present subgroup analysis of Korean patients with type 2 diabetes mellitus inadequately controlled with metformin, addition of ipragliflozin to metformin therapy led to significant improvements in glycemic control (HbA1c and FPG) and reductions in body weight compared to placebo. Improvements in clinical and laboratory parameters were also observed in the ipragliflozin group, with significantly lower blood pressure, decreased plasma triglycerides, increased HDL-C levels, and a tendency towards improved HOMA-IR after 24 weeks of treatment compared to the placebo group. The safety profile of ipragliflozin in terms of TEAEs and drug-related TEAEs was comparable to placebo, with only decreased weight being more common in patients given ipragliflozin compared to those given placebo.
The findings in this subgroup analysis are largely consistent with the main study comprising both Korean and Taiwanese patients with type 2 diabetes mellitus [11]. These findings are also consistent with the results from recent clinical trials of ipragliflozin conducted in Western and Asian patients, where favorable changes in HbA1c, FPG, body weight, blood pressure, and triglyceride levels were reported regardless of ethnic group [1012131415]. Both weight loss and reduction in blood pressure appear to represent a class effect of SGLT2 inhibitors [1617]. The observed improvements in lipid profile and tendency towards improvement in HOMA-IR may be a secondary effect of weight loss and reduced blood glucose. However, although many studies with SGLT2 inhibitors reported an increase in LDL-C levels [18192021], it is encouraging to note a slight decrease in mean LDL-C levels in Korean patients given ipragliflozin in the present study.
At the same BMI, Koreans tend to be more insulin resistant compared to whites [22]. In the present study, we observed slight improvements in insulin sensitivity (measured by HOMA-IR) and β-cell function (measured by HOMA-β) with ipragliflozin treatment compared to placebo. However, these changes in HOMA-IR and HOMA-β did not reach statistical significance, this was probably due to the small sample size of the Korean subgroup. In the ILLUMINATE (ipragliflozin in combination with metformin for the treatment of Japanese patients with type 2 diabetes) study where Japanese patients were treated with ipragliflozin and metformin in a similar manner to the current study, significant improvements in insulin sensitivity were reported [10]. The mean changes in HOMA-IR in the ipragliflozin and placebo groups in the ILLUMINATE study were –1.04 and –0.08 respectively, corresponding to an adjusted between-group difference of –0.81 (95% CI, –1.156 to –0.460; P<0.001) [10]. In the present study, the adjusted between-group difference for HOMA-IR (–0.75; 95% CI, –1.59 to 0.09; P=0.079) was almost comparable to that of the ILLUMINATE study. Other studies of SGLT2 inhibitors in Asian patients also reported that treatment for 24 weeks resulted in significant improvements in insulin sensitivity and β-cell function [2023]. Considering that insulin resistance is strongly associated with diabetes in Koreans, and that increasing HOMA-IR had a larger negative impact on FPG in Koreans compared to other non-Asian populations [22], the beneficial effects of ipragliflozin on insulin sensitivity may be clinically important in the pathogenesis of type 2 diabetes mellitus in Korean patients.
Similar to the overall study population and the ILLUMINATE study [1011], we observed a slight increase in red blood cell count and hematocrit in Korean patients given ipragliflozin treatment. These findings were expected due to the mechanism of ipragliflozin which results in an increase in urine output or water loss. On follow-up visits, these hematological variables returned to normal. In light of these data, it is important to advise patients to be adequately hydrated when on ipragliflozin treatment. Although we also found significant increases in urinary magnesium and phosphorous in the ipragliflozin group, the clinical relevance of these changes remains to be determined. Glucosuria associated with SGLT2 inhibitors typically increases the risk of urinary tract and genital infections [24]. However, it is noteworthy that there were no reports of urinary tract infections and genital infections in patients given ipragliflozin in the present study. The absence of such side effects may potentially enhance treatment satisfaction and compliance with ipragliflozin.
Limitations of the study include the short duration of treatment and relatively low mean HbA1c levels at baseline [11]. By nature of the subgroup analysis design, data interpretation may be limited by the small sample size. Nevertheless, the focus on Korean patients is a key strength of the analysis as this is the first report demonstrating the efficacy and safety of ipragliflozin in combination with metformin in Korean patients with type 2 diabetes mellitus.
In conclusion, ipragliflozin added to metformin treatment led to significant improvements in glycemic outcomes and several clinical parameters including body weight, lipid profile, and blood pressure in Korean patients with type 2 diabetes mellitus. There were no unexpected adverse events, and the safety profile of ipragliflozin was not markedly different from that of the placebo. Our data demonstrate the efficacy and safety of ipragliflozin in Korean patients with type 2 diabetes mellitus inadequately controlled with metformin alone.

Notes

CONFLICTS OF INTEREST: K.W.M., B.J.K., J.H.L., M.S.K., K.J.A., M.K.L., and B.S.C. have received research funding from Astellas Pharma Inc. S.K. and S.Y. are employees of Astellas Pharma Inc., Tokyo, Japan. H.J.C. is an employee of Astellas Korea Inc., Seoul, Korea. This study was sponsored by Astellas Pharma Inc., Japan. Medical writing and editorial support was funded by Astellas and provided by Hui Hwa Choo, Bao Hui Lee, and Naina Sharma from Research2Trials Clinical Solutions Pte. Ltd.

References

1. Kim DJ. The epidemiology of diabetes in Korea. Diabetes Metab J. 2011; 35:303–308. PMID: 21977448.
crossref
2. Korean Diabetes Association. Korean diabetes fact sheet 2015. Seoul: Korean Diabetes Association;2015.
3. Kim DJ, Song KE, Park JW, Cho HK, Lee KW, Huh KB. Clinical characteristics of Korean type 2 diabetic patients in 2005. Diabetes Res Clin Pract. 2007; 77(Suppl 1):S252–S257. PMID: 17459510.
crossref
4. Korean Diabetes Association. Treatment guideline for diabetes. 5th ed. Seoul: Korean Diabetes Association;2015.
5. Halban PA, Polonsky KS, Bowden DW, Hawkins MA, Ling C, Mather KJ, Powers AC, Rhodes CJ, Sussel L, Weir GC. β-Cell failure in type 2 diabetes: postulated mechanisms and prospects for prevention and treatment. Diabetes Care. 2014; 37:1751–1758. PMID: 24812433.
crossref
6. Chan JC, Malik V, Jia W, Kadowaki T, Yajnik CS, Yoon KH, Hu FB. Diabetes in Asia: epidemiology, risk factors, and pathophysiology. JAMA. 2009; 301:2129–2140. PMID: 19470990.
7. Abdullah N, Attia J, Oldmeadow C, Scott RJ, Holliday EG. The architecture of risk for type 2 diabetes: understanding Asia in the context of global findings. Int J Endocrinol. 2014; 2014:593982. PMID: 24744783.
crossref
8. Wright EM. Renal Na(+)-glucose cotransporters. Am J Physiol Renal Physiol. 2001; 280:F10–F18. PMID: 11133510.
crossref
9. Inzucchi SE, Bergenstal RM, Buse JB, Diamant M, Ferrannini E, Nauck M, Peters AL, Tsapas A, Wender R, Matthews DR. Management of hyperglycemia in type 2 diabetes, 2015: a patient-centered approach: update to a position statement of the American Diabetes Association and the European Association for the Study of Diabetes. Diabetes Care. 2015; 38:140–149. PMID: 25538310.
crossref
10. Kashiwagi A, Kazuta K, Goto K, Yoshida S, Ueyama E, Utsuno A. Ipragliflozin in combination with metformin for the treatment of Japanese patients with type 2 diabetes: ILLUMINATE, a randomized, double-blind, placebo-controlled study. Diabetes Obes Metab. 2015; 17:304–308. PMID: 24919820.
11. Lu CH, Min KW, Chuang LM, Kokubo S, Yoshida S, Cha BS. Efficacy, safety, and tolerability of ipragliflozin in Asian patients with type 2 diabetes mellitus and inadequate glycemic control with metformin: results of a phase 3 randomized, placebo-controlled, double-blind, multicenter trial. J Diabetes Investig. 2016; 7:366–373.
crossref
12. Kashiwagi A, Kazuta K, Takinami Y, Yoshida S, Utsuno A, Nagase I. Ipragliflozin improves glycemic control in Japanese patients with type 2 diabetes mellitus: the BRIGHTEN study. Diabetol Int. 2015; 6:8–18.
crossref
13. Fonseca VA, Ferrannini E, Wilding JP, Wilpshaar W, Dhanjal P, Ball G, Klasen S. Active- and placebo-controlled dose-finding study to assess the efficacy, safety, and tolerability of multiple doses of ipragliflozin in patients with type 2 diabetes mellitus. J Diabetes Complications. 2013; 27:268–273. PMID: 23276620.
crossref
14. Kashiwagi A, Kazuta K, Yoshida S, Nagase I. Randomized, placebo-controlled, double-blind glycemic control trial of novel sodium-dependent glucose cotransporter 2 inhibitor ipragliflozin in Japanese patients with type 2 diabetes mellitus. J Diabetes Investig. 2014; 5:382–391.
crossref
15. Wilding JP, Ferrannini E, Fonseca VA, Wilpshaar W, Dhanjal P, Houzer A. Efficacy and safety of ipragliflozin in patients with type 2 diabetes inadequately controlled on metformin: a dose-finding study. Diabetes Obes Metab. 2013; 15:403–409. PMID: 23163880.
crossref
16. Kurosaki E, Ogasawara H. Ipragliflozin and other sodium-glucose cotransporter-2 (SGLT2) inhibitors in the treatment of type 2 diabetes: preclinical and clinical data. Pharmacol Ther. 2013; 139:51–59. PMID: 23563279.
crossref
17. Baker WL, Smyth LR, Riche DM, Bourret EM, Chamberlin KW, White WB. Effects of sodium-glucose co-transporter 2 inhibitors on blood pressure: a systematic review and meta-analysis. J Am Soc Hypertens. 2014; 8:262–275. PMID: 24602971.
crossref
18. Ridderstrale M, Andersen KR, Zeller C, Kim G, Woerle HJ, Broedl UC. EMPA-REG H2H-SU trial investigators. Comparison of empagliflozin and glimepiride as add-on to metformin in patients with type 2 diabetes: a 104-week randomised, active-controlled, double-blind, phase 3 trial. Lancet Diabetes Endocrinol. 2014; 2:691–700. PMID: 24948511.
19. Cefalu WT, Leiter LA, Yoon KH, Arias P, Niskanen L, Xie J, Balis DA, Canovatchel W, Meininger G. Efficacy and safety of canagliflozin versus glimepiride in patients with type 2 diabetes inadequately controlled with metformin (CANTATA-SU): 52 week results from a randomised, double-blind, phase 3 non-inferiority trial. Lancet. 2013; 382:941–950. PMID: 23850055.
crossref
20. Ji L, Ma J, Li H, Mansfield TA, T'Joen C L, Iqbal N, Ptaszynska A, List JF. Dapagliflozin as monotherapy in drug-naive Asian patients with type 2 diabetes mellitus: a randomized, blinded, prospective phase III study. Clin Ther. 2014; 36:84–100.e9. PMID: 24378206.
crossref
21. Kaku K, Maegawa H, Tanizawa Y, Kiyosue A, Ide Y, Tokudome T, Hoshino Y, Yang J, Langkilde AM. Dapagliflozin as monotherapy or combination therapy in Japanese patients with type 2 diabetes: an open-label study. Diabetes Ther. 2014; 5:415–433. PMID: 25341477.
crossref
22. Yoon YS, Choi HS, Kim JK, Kim YI, Oh SW. Differences in the associations of anthropometric measures with insulin resistance and type 2 diabetes mellitus between Korean and US populations: comparisons of representative nationwide sample data. Obes Res Clin Pract. 2016; 10:642–651. PMID: 26750428.
crossref
23. Yang W, Han P, Min KW, Wang B, Mansfield T, T'Joen C, Iqbal N, Johnsson E, Ptaszynska A. Efficacy and safety of dapagliflozin in Asian patients with type 2 diabetes after metformin failure: a randomized controlled trial. J Diabetes. 2016; 8:796–808. PMID: 26589253.
crossref
24. Hedrington MS, Davis SN. Ipragliflozin, a sodium-glucose cotransporter 2 inhibitor, in the treatment of type 2 diabetes. Expert Opin Drug Metab Toxicol. 2015; 11:613–623. PMID: 25643044.
crossref
Fig. 1

Patient disposition.

dmj-41-135-g001
Fig. 2

Time-courses of (A) glycosylated hemoglobin (HbA1c) and (B) fasting plasma glucose (FPG) measurements. Values are mean±standard deviation. CI, confidence interval; NGSP, National Glycohemoglobin Standardization Program.

dmj-41-135-g002
Table 1

The patients' demographics and baseline characteristics (full analysis set)

dmj-41-135-i001
Characteristic Placebo Ipragliflozin P value
Number 39 43
Sex 0.191a
 Male 15 (38.5) 23 (53.5)
 Female 24 (61.5) 20 (46.5)
Age, yr 56.5±9.79 55.7±11.25 0.752b
Age ≥65 yr 8 (20.5) 10 (23.3) 0.796a
Body weight, kg 68.96±12.242 68.12±13.817 0.774b
BMI, kg/m2 26.15±3.466 25.50±3.829 0.430b
BMI ≥25 kg/m2 21 (53.8) 20 (46.5) 0.659a
Waist circumference at start of treatment, cm 87.23±9.274 85.23±8.600 0.313b
HbA1c at start of treatment (NGSP), % 7.62±0.782 7.67±0.853 0.767b
FPG at start of treatment, mg/dL 138.2±32.09 146.1±42.92 0.354b
FSI at start of treatment, µIU/mL 8.06±7.929 7.11±5.656 0.535b
Duration of diabetes, mo 86.5±57.04 94.0±80.83 0.628b
Complications, yes 39 (100.0) 42 (97.7) 1.000a
Treatment with drugs other than metformin ≤12 weeks before visit 1, yes 1 (2.6) 2 (4.7) 1.000a
eGFR at start of treatment, mL/min/1.73 m2 128.74±46.036 128.06±39.933 0.943b
eGFR at start of treatment <90 mL/min/1.73 m2 1 (2.6) 5 (11.6) 0.205a

Values are presented as number (%) or mean±standard deviation. Data shown are for Visit 1 unless otherwise specified.

BMI, body mass index; HbA1c, glycated hemoglobin; NGSP, National Glycohemoglobin Standardization Program; FPG, fasting plasma glucose; FSI, fasting serum insulin; eGFR, estimated glomerular filtration rate.

aFisher exact test, bTwo-sample t-test.

Table 2

Changes in secondary efficacy variables from baseline to end of treatment (full analysis set)

dmj-41-135-i002
Variable Placebo Ipragliflozin Adjusted mean difference (95% CI) P valuea
Mean±SD Number Mean±SD Number
HOMA-IR 0.41±1.78 35 –0.34±1.79 38 –0.75 (–1.59 to 0.09) 0.079
HOMA-β –1.37±77.07 35 6.24±36.68 38 2.88 (–20.58 to 26.34) 0.807
Body weight, kg –1.13±1.90 39 –2.66±2.20 43 –1.53 (–2.44 to –0.61) 0.001
Waist circumference, cm –0.90±2.68 36 –1.23±2.43 39 –0.26 (–1.45 to 0.92) 0.661
FSI, µIU/mL 1.14±4.41 37 0.07±4.63 39 –0.90 (–2.93 to 1.12) 0.376

SD, standard deviation; CI, confidence interval; HOMA-IR, homeostatic model assessment of insulin resistance; HOMA-β, homeostatic model assessment of β-cell function; FSI, fasting serum insulin.

aAnalysis of covariance model including baseline value as a covariate.

Table 3

Changes in clinical and laboratory parameters from baseline to end of treatment (safety analysis set)

dmj-41-135-i003
Variable Placebo (n=39) Ipragliflozin (n=43) P valuea
SBP, mm Hg 2.5±12.98 −9.6±14.72 <0.001
DBP, mm Hg 0.5±8.33 −5.9±10.23 0.003
Pulse rate, /min −0.6±9.24 −2.1±8.16 0.429
eGFR, mL/min/1.73 m2 −7.62±32.34 −3.39±30.62 0.545
Total cholesterol, mg/dL 10.5±24.88 0.2±25.99 0.072
HDL-C, mg/dL 0.4±6.02 3.9±6.62 0.014
LDL-C, mg/dL 7.2±23.89 −2.4±29.67 0.114
Triglycerides, mg/dL 11.3±98.60 −29.2±77.49 0.041
Free fatty acids, mEq/L −0.036±0.205 −0.020±0.212 0.723

Values are presented as mean±standard deviation.

SBP, systolic blood pressure; DBP, diastolic blood pressure; eGFR, estimated glomerular filtration rate; HDL-C, high density lipoprotein cholesterol; LDL-C, low density lipoprotein cholesterol.

aTwo-sample t-test.

Table 4

Change in hematology and other laboratory variables from baseline to end of treatment (safety analysis set)

dmj-41-135-i004
Variable Placebo Ipragliflozin
Number 39 43
No. of TEAEsa 38 37
Incidence of TEAEsb 17 (43.6) 19 (44.2)
 TEAEs by severityc
  Mild 12 (30.8) 17 (39.5)
  Moderate 5 (12.8) 2 (4.7)
  Severe 0 0
 Serious TEAEs 3 (7.7) 0
 TEAEs leading to study discontinuation 0 0
No. of drug-related TEAEsa 9 10
Incidence of drug-related TEAEsb 6 (15.4) 6 (14.0)
 Drug-related TEAEs by severityc
  Mild 5 (12.8) 6 (14.0)
  Moderate 1 (2.6) 0
  Severe 0 0
 Serious drug-related TEAEs 0 0
 Drug-related TEAEs leading to study discontinuation 0 0
TEAEs in ≥5% of patients in either group
 Fatigue 2 (5.1) 1 (2.3)
 Nasopharyngitis 2 (5.1) 0
 Weight decreased 0 3 (7.0)
 Osteoarthritis 2 (5.1) 0
 Dysuria 2 (5.1) 1 (2.3)
 Nocturia 2 (5.1) 0

Values are presented as number (%).

TEAE, treatment-emergent adverse event.

aTotal number of events, where patients may have experienced two or more events, bPatients presenting with two or more TEAEs were counted only once, cThe most severe TEAE was counted if the patient presented with two or more TEAEs with varying severity.

Table 5

Change in hematology and other laboratory variables from baseline to end of treatment (safety analysis set)

dmj-41-135-i005
Variable Placebo (n=39) Ipragliflozin (n=43) P valuea
Renal function
 BUN, mg/dL 1.1±3.97 2.9±4.56 0.072
 Cr, mg/dL 0.034±0.095 0.026±0.115 0.725
 BUN:Cr ratio 1.06±11.50 3.83±7.76 0.200
Hematology
 RBC count, ×104/µL –7.7±18.71 17.2±18.48 <0.001
 Hemoglobin, g/dL –0.26±0.75 0.42±0.58 <0.001
 Hematocrit, % –0.40±1.98 2.00±1.76 <0.001
Fluid and electrolyte balance
 Na, mEq/L –0.2±2.07 0.1±2.24 0.573
 K, mEq/L 0.06±0.41 0.15±0.33 0.259
 Cl, mEq/L –1.1±2.96 –0.3±2.92 0.251
 Ca, mg/dL –0.25±0.30 –0.25±0.46 0.980
 Mg, mg/dL 0.07±0.15 0.17±0.22 0.015
 P, mg/dL –0.07±0.47 0.19±0.45 0.013
 Urine NAG/Cr ratio, U/g Cr 0.42±5.93 1.83±6.53 0.312
 Urine albumin/Cr ratio, mg/g Cr 2.74±24.64 –10.93±58.92 0.182
 Urine osmolality, mOsm/L –41.9±223.54 58.5±219.58 0.043
 Urine Na/Cr ratio, mEq/g Cr 22.9±93.67 33.6±100.77 0.623
 Urine K/Cr ratio, mEq/g Cr 11.86±39.80 31.09±38.28 0.029
 Urine Cl/Cr ratio, mEq/g Cr 10.1±108.21 24.3±108.57 0.555
 Urine Ca/Cr ratio, mg/g Cr 11.04±73.00 29.34±93.79 0.331
 Urine Mg/Cr ratio, mg/g Cr 3.15±35.65 16.60±32.50 0.078
 Urine P/Cr ratio, mg/g Cr 55.66±291.31 277.89±315.43 0.001
Liver function
 AST, U/L –3.1±10.56 –3.9±7.89 0.704
 ALT, U/L –3.5±17.40 –8.7±17.75 0.192
 Total bilirubin, mg/dL 0.00±0.22 0.00±0.18 0.962
 Direct bilirubin, mg/dL 0.00±0.13 0.01±0.10 0.643
 LDH, U/L –5.4±28.36 –5.5±35.75 0.986
 ALP, U/L –4.2±29.01 –7.4±29.74 0.617
 γ-GTP, U/L –1.4±14.62 –8.1±18.40 0.073

Values are presented as mean±standard deviation.

BUN, blood urea nitrogen; Cr, creatinine; RBC, red blood cell; NAG, β-N-acetyl-D-glucosaminidase; AST, aspartate transaminase; ALT, alanine transaminase; LDH, lactate dehydrogenase; ALP, alkaline phosphatase; γ-GTP, γ-glutamyl transpeptidase.

aTwo-sample t-test.

TOOLS
Similar articles