

 PDF
PDF ePub
ePub Citation
 Print
Print


Introduction
Acute pulmonary embolism (PE) is a serious disease with a wide range of possible in-hospital outcomes, so early risk stratification is essential for appropriate management.1) PE is diagnosed by several imaging tools, including pulmonary perfusion-ventilation scan, chest computed tomography (CT), and pulmonary angiography, which have the drawbacks of being time-consuming and requiring specialized facilities. Although the role of electrocardiography (ECG) in the diagnosis of acute PE has been rendered less important by the widespread use of new diagnostic modalities, particularly 2-dimensional (2-D) echocardiography and chest CT, ECG is considered as a simple and economical tool for suspecting acute PE due to its association with various ECG abnormalities. Elevation of pulmonary artery pressure caused by occlusion of the pulmonary artery with embolism increases right ventricle (RV) wall stress, leading to RV dilation and dysfunction. In turn, the dilated RV compresses the interventricular septum or the right coronary artery, causing RV ischemia. Distinctive ECG patterns including sinus tachycardia, atrial fibrillation (AF) or flutter of new onset, the presence of a S wave in lead I and of a Q wave in lead III in association with negative T waves in lead III, rightward deviation of the QRS axis, and inverted precordial T waves are caused by functional or structural RV changes attributable to pressure overload.2) Although data on each ECG abnormality affecting risk stratification of acute PE are available, data on the usefulness of a combination of different ECG abnormalities, as captured by the ECG score, in risk stratification of patients with acute PE are limited. The present study therefore was intended to investigate 12-lead ECG patterns in patients with acute PE and to evaluate the role of the ECG score in PE-associated risk stratification.
Subjects and Methods
Patients
One hundred twenty-five consecutive patients with acute PE who were admitted to Kyungpook National University Hospital between November 2001 and January 2008 were included in the present study. Data including initial vital signs were retrospectively collected. Acute PE was confirmed by chest or deep vein thrombosis (DVT) CT scan or pulmonary perfusion-ventilation scan. Patients with undetermined onset of PE or without available interpretable ECGs were excluded from the present study. This study was approved by the local Institutional Review Board, and informed consent was waived.
Electrocardiographic analysis
Twelve-lead ECGs were recorded on admission at a paper speed of 25 mm/second and amplification of 10 mm/mV. All ECGs were examined by at least two cardiologists who were blinded to all other clinical findings. We measured and detected heart rate (HR), electrical axis, the presence of AF and right bundle branch block (RBBB), and voltages of P, QRS, and T waves in standard 12-lead ECGs. Inverted T waves were considered present if the depth was >0.5 mm in any lead except lead aVR or lead aVL. Sinus tachycardia was defined as HR >100 beats/minute, and right-axis deviation was defined as QRS electrical axis >90°. RBBB was defined as QRS duration ≥120 msec with typical RBBB morphologies, including a terminal R wave in lead V1 and slurred S waves in leads I and V6, and incomplete RBBB was defined as 100 msec < QRS duration <120 msec with typical RBBB morphologies. SIQIIITIII was defined as the presence of S wave in lead I and Q wave in lead III, each having amplitudes of ≥1.5 mm, in association with negative T wave in lead III. Low voltage was defined as the greatest overall deflection of the QRS complex ≤5 mm in all limb leads.
Echocardiographic analysis
Two-D echocardiography was performed in available patients (n=80) who had access to a commercially available machine on the day of admission or during the early days of hospitalization. Echocardiographic findings were read by two cardiologists blinded to the clinical information of patients studied. Echocardiographic parameters, including degree of tricuspid regurgitation (TR), RV systolic pressure (RVSP), RV dimension, the presence of RV hypokinesia, the presence of D-like shape of left ventricle (LV), LV ejection fraction (LVEF), transmitral early-to-late diastolic velocity ratio (E/A), and transmitral-to-tissue Doppler imaging (TDI) early diastolic velocity ratio (E/Ea), were all assessed using 2-D echocardiography. RVSP was calculated with the following formula: "RVSP (mmHg)=4×TR flow velocity (m/second)2+10 (mmHg)," using the TR flow velocity measured by Doppler echocardiography.4) RVSP and the presence of RV hypokinesia were used to evaluate PE-associated risk stratification in available patients (n=75, n=80, respectively).
Hematological analysis
Hematological parameters, including white blood cell count, hemoglobin level, hematocrit, platelet count, blood urea nitrogen, creatinine, sodium, potassium, N-terminal pro-brain natriuretic peptide (NT-proBNP), cardiac troponin I (cTnI), D-dimer concentration, PaCO2, and prothrombin time, were measured on the day of admission in available patients.
Statistical analysis
We analyzed data using the Statistical Package for the Social Sciences (SPSS) software (version 15.0; SPSS, Inc., Chicago, IL, USA). Data are expressed as mean±standard deviation for continuous variables and number (percentage) for categorical variables. Student's t-test and Chi-square analyses were used for comparisons of either continuous variables or categorical variables, respectively, while simple Pearson's correlation was used to examine the relationship between two parameters. A cut-off value of the ECG score was set on the basis of receiver operating characteristics (ROC) curve analysis to predict a high RVSP. Univariate predictors of high RVSP and RV hypokinesia were included in the multivariate logistic regression analyses. Kaplan-Meier survival curves were used to analyze follow-up clinical outcomes. A p less than 0.05 was considered statistically significant.
Results
Demographic and clinical characteristics
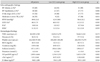
Demographic and clinical characteristics of the patients with acute PE are listed in Table 2. The mean age of the study population was 62.7±13.6 years. The number of male and female patients was 56 and 69, respectively. Dyspnea was the most common symptom/sign and hypertension was the most common comorbid disease. A current or former smoking history was the most common predisposing factor for acute PE. DVT was found in 62 patients (50%) with acute PE. The mean systolic and diastolic initial BP were 127 and 76 mmHg.
Electrocardiography characteristics
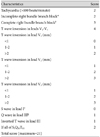
The mean QRS axis was 43±56°, and 17 patients (14%) had a QRS axis >90°. Mean HR was 96±20/minute, and 49 patients (39%) had sinus tachycardia. Incomplete RBBB was observed in 12 patients (10%), AF in 5 patients (4%), and low voltage in limb leads in 7 patients (6%). Complete RBBB was detected in no case. Among several ECG findings, sinus tachycardia (39%) and inverted T waves in V1-4 (39%) were the most frequently observed findings, followed by SIQIIITIII (27%) (Table 3). The mean ECG score was 7.36±6.32.
Echocardiographic and hematological findings
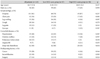
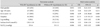
Echocardiographic and hematological findings in available patients with acute PE are listed in Table 4. RV dilation, RV hypokinesia, and D-like shape of the LV were observed in 55 (69%), 48 (60%) patients, and 45 (56%) patients, respectively. Twenty-six (35%) patients had moderate or severe TR. Mean RVSP was 49.0±21.0 mmHg. Patients with RVSP >50 mmHg were defined as having a high RVSP. Mean LVEF was 60.5±7.9%, mean E/A was 0.8±0.4, and mean E/Ea was 11.5±3.5. Mean NT-proBNP and cTnI concentrations were 2,893±4,664 pg/mL and 0.31±0.66 ng/mL, respectively.
Relationship between electrocardiography findings and right ventricular systolic pressure
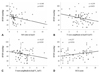
There were inverse correlations between RVSP and the R/S ratio in lead I (r=-0.308, p=0.019), T wave amplitude in lead II (r=-0.259, p=0.025), and T wave amplitude in lead V4 (r=-0.227, p=0.050) (Fig. 1A, B and C). There was a positive correlation, however, between RVSP and the ECG score (r=0.277, p= 0.016) (Fig. 1D).
Receiver operating characteristics curve predicting right ventricular systolic pressure
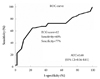
Fig. 2 shows the ROC curve predicting RVSP. The area under the curve was 0.68 {95% confidence interval (CI) 0.56-0.81} at the point corresponding to an ECG score of 12, where sensitivity was 60% and specificity was 77%. Hence, study patients were divided into two groups on the basis of ECG score {high ECG-score group (n=87): ECG score >12; and low ECG-score group (n=38): ECG score ≤12}.
Demographic and clinical characteristics according to electrocardiography score
Table 2 displays comparisons of demographic characteristics between the high and low ECG-score groups. There was no significant difference between the groups in terms of age and gender. With the exception of decreased frequency of leg pain in the high ECG-score group, there was no significant difference in occurrence of symptoms/signs between the groups. No difference in the prevalence of comorbid diseases was observed between the two groups with the exception of a decreased frequency of inactive pulmonary tuberculosis in the high ECG-score group. Among all predisposing factors, cancer was observed less frequently in the high ECG-score group. There was no difference between the groups in terms of the presence of DVT. Mean systolic and diastolic initial BP were 128 and 76 mmHg in the high ECG score group and 123 and 76 mmHg in the low ECG score group, and there was no difference between the groups in terms of initial blood pressure.
Echocardiographic and hematological findings according to electrocardiography score
Comparisons of echocardiographic and hematological findings between the high and low ECG-score groups are shown in Table 4. RV dilation, RV hypokinesia, D-like shape of the LV, and moderate or severe TR were observed more frequently in the high ECG-score group. Mean RVSP was also higher in the high ECG-score group.
However, no significant difference was observed between the two groups in other echocardiographic parameters, including LVEF, E/A, and E/Ea. Among hematological parameters, mean hematocrit and NT-proBNP concentration were significantly higher in the high ECG-score group. There were no significant differences in other hematological parameters between the groups.
Univariate and multivariate analysis of predictors associated with higher right ventricular systolic pressure and right ventricular hypokinesia
An univariate analysis of predictors associated with high RVSP in study patients showed that high ECG score, respiratory rate, creatinine level, PaCO2, and prothrombin time were significantly associated with high RVSP (Table 5). In addition, a high ECG score {odds ratio (OR) 8.26, 95% CI 2.05-33.33, p=0.003} and creatinine level (OR 10.60, 95% CI 1.06-105.54, p=0.044) were independent markers predicting high RVSP after adjustment by multivariate analysis for potential confounders that included gender, age, respiratory rate, PaCO2, and prothrombin time (Table 5). Moreover, a high ECG score, presence of dyspnea, absence of leg swelling, and sodium and PaCO2 concentrations were significantly associated with RV hypokinesia in univariate analysis (Table 5). Multivariate analysis of predictors associated with RV hypokinesia revealed that a high ECG score (OR 8.39, 95% CI 1.92-36.60, p=0.005) and the presence of dyspnea (OR 22.73, 95% CI 1.45-333.33, p=0.026) were independent predictors of RV hypokinesia after adjustment for potential confounders that included gender, age, absence of leg swelling, and sodium and PaCO2 concentrations (Table 6).
Clinical outcomes
Fifteen patients died during admission. Among them, 12 patients died of PE, and the remaining three patients died of brain hemorrhage, pneumonia, and sepsis, respectively. During a mean follow-up period of 14±15 months, six more patients died. Among them, four patients died of PE, and the remaining two patients died of lung cancer and sepsis, respectively. There was no significant difference between patients with a high ECG score and those with a low ECG score in terms of the in-hospital mortality rate (14% vs. 8%, p=0.550).
Discussion
The results of the present study underscore frequently observed ECG findings in acute PE and the effectiveness of the ECG score in risk stratification of acute PE patients.
An acute PE is commonly suspected when dyspnea or chest pain of unknown cause occur in patients with risk factors that include obesity, a history of smoking or use of oral contraceptives, pregnancy, recent surgery, or cancer, among others. The role of the ECG as a diagnostic tool when suspecting acute PE has been undermined by widespread use of new diagnostic methods, including 2-D echocardiography, pulmonary perfusion-ventilation scan, pulmonary angiography, and chest CT. Although ECG is considered a convenient bedside examination for diagnosing PE irrespective of a patient's hemodynamic status, its low positive predictive value and sensitivity limit its diagnostic usefulness for acute PE.5)
Among the findings derived from the 12-lead ECG in the present study, sinus tachycardia and inverted T waves in V1-4 were the most frequently observed patterns; they were followed in frequency by the SIQIIITIII pattern. Although these results appear similar to those of several previous studies, the frequencies of these ECG findings actually differed among the studies. The differences in the frequency of findings may have been caused by disparities in ECG-performance time, study subjects or definition of ECG findings.2)6-9) The ECG changes in acute PE described in the present study are probably induced by rapid RV pressure overload; however, it is possible that ischemia of the myocardium, ischemia of the conduction system, hypoxemia, and various chemical mediators such as catecholamine and histamine are also related to these ECG changes.10) One study used single-photon emission computed tomography (SPECT) to demonstrate that ECG changes did not correlate with myocardial perfusion defects, and coronary artery flow was well preserved in patients with PE.6) We could not ascertain the accuracy of correlation between myocardial perfusion defects and ECG changes, because we did not perform SPECT analysis. However, the fact that ECG changes did not correlate with myocardial ischemia could be explained by the lack of a relationship between the cTnI level and ECG score in the present study.
Although it has been determined that the SIQIIITIII pattern, RBBB, and sinus tachycardia are related to PE-associated risk stratification, their sensitivity and positive predictive value were low.5) The ECG score was therefore introduced, because it was impossible to assess PE-associated risk stratification with only single ECG changes. A recent study indicated that, with the cardiac compensation mechanism, the ECG score would be low if the thrombus occluding the pulmonary artery was small and that, without the cardiac compensation mechanism, the ECG score would be high if the thrombus was large.11) Our study showed a mean ECG score that was higher than the result of the latter study; this suggests that the thrombus occluding the pulmonary artery may have been large in our study.11)
To the best of our knowledge, the present study is the first to evaluate the relationship between the ECG score and 2-D echocardiography findings in risk stratification of patients with acute PE in Korea. First, there was positive correlation between the ECG score and RVSP. Among numerous ECG patterns, the R/S ratio in lead I and the T wave amplitude in leads II and V4 were the most important elements in the relationship between the ECG score and RVSP. A recent study reported a correlation between T wave amplitude in lead II and RVSP, while another revealed that the number of leads with inverted T waves might be an useful and simple marker for increased risk for early complications in patients with acute PE.1)2) Moreover, T wave inversions in leads V1 to V3 had the greatest sensitivity and diagnostic accuracy for early detection of RV dysfunction, and normalization of the T wave inversions was associated with recovery of RV dysfunction in acute PE.12) Yoshinaga et al.7) suggested that the total number of ECG abnormalities in patients with acute massive PE could be used to evaluate the severity of an acute PE as well as the pulmonary artery pressure level. The present study revealed that a high ECG score was an useful marker in predicting high RVSP in multivariate as well as univariate analysis. Furthermore, in the present study, the ECG score was significantly associated with RV hypokinesia, and a high ECG score was also an useful predictor of RV hypokinesia. Among patients with acute PE, high RVSP has been considered to be an important factor in predicting a poor prognosis.7) Moreover, hypokinesia and dilatation of the RV have been associated with more extensive pulmonary artery occlusion and have had better predictive values in patients with PE in the short term or acute phase of PE.13)14) Therefore, the ECG score can be used as an useful tool in risk stratification of patients with acute PE.
Although NT-proBNP is reportedly worse than ECG findings such as T wave inversions in leads V1 to V3 for the early detection of RV dysfunction,12) NT-proBNP is well known as a prognostic biomarker of outcomes in several cardiovascular diseases, and a recent study demonstrated that an elevated NT-proBNP concentration could help identify patients with acute PE at high risk for death and other adverse outcomes, including mortality from a cardiovascular incident, hospitalization for heart failure, and myocardial infarction or stroke.15-18) In the present study, the NT-proBNP concentration was significantly higher in the high ECG-score group, although the NT-proBNP level was already high in the overall patient population studied. Interestingly, however, there was no significant difference between the groups in terms of systolic and diastolic function, including LVEF, E/A, and E/Ea. Therefore, the higher NT-proBNP concentration seen in the high ECG-score group was probably not induced by systolic or diastolic dysfunction of the LV. Instead, it was likely induced by RV dysfunction caused by acute PE.
Study limitations
The present study has some limitations that should be considered. First, this study was retrospectively performed at a single center and included a small number of patients with acute PE. Therefore, further prospective studies in larger numbers of patients are required to confirm the predictive usefulness of the ECG score for risk stratification in patients with acute PE. Second, the concentrations of cTnI and NT-proBNP, which were considered as useful predictors of outcomes in patients with acute PE, could not be measured in all subjects. Third, we could not identify whether the severity of acute PE was affected by treatment, because we did not analyze ECGs recorded after treatment. Finally, it is suggested that patients with poor general condition and supposed poor prognosis were omitted because we could not perform 2-D echocardiography in all study patients.


 XML Download