

 PDF
PDF ePub
ePub Citation
 Print
Print


Introduction
Coronary angiography or coronary intervention produce a lower incidence of complications, but may cause such fatal complications as ventricular tachycardia. These complications have been reported to bear a close relationship with the chemical and physical properties of contrast media.1-3) To expel the blood from a catheter or to administer drugs during coronary angiography or a coronary procedure, saline is generally used, which causes a transient change in coronary blood flow. Besides, the electrolytes in saline, such as sodium or chloride, saline may affect the electrical properties of myocardium. 4-6)
In general, variant angina has a good prognosis. In 5% to 15% of all patients, however, fatal ventricular arrhythmias may occur.7-9) The factors which increase the occurrence of ventricular arrhythmias in patients with variant angina are currently unknown. According to some studies, however, the QT-interval and the QT-dispersion are increased in patients with variant angina.10)11) In addition to variant angina, the increased QT-interval and QT-dispersion could be identified in cigarette smokers,12) and medical conditions, such as long QT syndrome,13) hypertrophic cardiomyopathy,14) chronic renal failure,15) restenosis of coronary arteries,16) and myocardial infarction.17) It is well-known that an increased QT-interval and QT-dispersion are closely related to ventricular arrhythmias and sudden cardiac death.18)19)
In this study, we examined the effect of saline, which is used for coronary angiography on ventricular repolarization of the myocardium in patients with variant angina.
Subjects and Methods
Study patients
The current study was conducted in 51 patients (mean age: 58±10 years, 21 males) who submitted a written informed consent and were diagnosed with variant angina based on the presence of coronary artery spasm on coronary angiography and clinical symptoms at the Wonkwang University Hospital. Patients with atrial fibrillation, myocardial infarction, or hypertrophic cardiomyopathy, and those who had a significant stenosis of >70% on coronary angiography were excluded from the current analysis.
Study methods
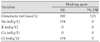
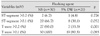
Following coronary angiography, a catheter was placed in the ostium of the left coronary artery in patients who were eligible for the current study. These patients were assigned to the normal saline group (NS, n=30, 56±10 years, 14 males) and the 5% dextrose water group (DW, n=21, 59±10 years, 7 males) for further comparison (Table 1). Five millimeters of each of the two solutions were infused into the left main coronary artery in random order. Each injection was performed manually over a period of 2 seconds.
All the subject patients had 12-lead electrocardiogram (ECG) and blood pressure monitoring throughout the procedure; the recording was done continuously until the ECG findings were normalized and kept in an electronic file.
Electrocardiogram analysis
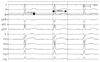
All ECG and hemodynamic changes were recorded using a Prucka CardioLab 7000 (GE, WI, USA). ECG analysis was performed on a high-resolution computer monitor with the use of Mac-Lab 5.2 software (GE) installed in a computer. At a speed of 50-100 mm/sec, the RR interval, QT interval, heart rate-adjusted QT-interval (Bazett's formula: QTc=QT/RR1/2),20) and T-wave voltage were directly measured using a 12-lead ECG and then analyzed. This ECG measurement and analysis were performed by a single expert who was blinded to the current study (Fig. 1). QT-dispersion was defined as the difference between the maximum QT-interval and the minimum QT-interval. The T-wave amplitude was measured from the TP isoelectric line to the peak (or nadir) of the T-wave. For QT measurement, the end of the T-wave was taken as the point at which the T-wave met the TP isoelectric line. In cases in which the point at which the end of the T-wave met the isoelectric was unclear, the point at which the major descending line of the T-wave met the isoelectric line was used. In cases in which the U-wave overlapped onto the T-wave, the crossing point between the two waves was selected.
Statistical analysis
All the measurements were expressed as the mean±standard deviation. Statistical analysis was performed using SPSS-PC 11.0 (Statistical Package for the Social Sciences; SPSS, Inc., Chicago, IL, USA) for MS Windows. The clinical and ECG parameters between the two groups were compared using a t-test and chi-square test, and some parameters before and after the infusion of solutions were compared using a paired t-test. In the current study, a value of p<0.05 was considered statistically significant.
Results
Clinical characteristics of the patients
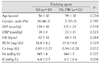
Between the NS (n=30) and 5% DW groups (n=21), there were no significant differences in age, gender, heart rate, systolic pressure, diastolic pressure, blood urea nitrogen (BUN), Na+, and K+. Creatinine was significantly higher in the 5% DW group, which was within the normal range (Table 2).
Hemodynamic changes
The systolic and diastolic blood pressures exhibited no significant changes during the infusion of NS or 5% DW. The heart rate showed an increasing tendency, but there was no significant change between the two groups.
Effects on QTc interval and QTc dispersion
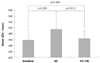
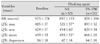
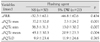
In the NS group, as compared to the baseline, the maximum QTc interval (521±57 vs. 485±37 ms, p<0.01) and the mean QTc interval (495±52 vs. 459±35 ms, p<0.01) were significantly increased. In the 5% DW group, as compared to the baseline, there was no significant change (Fig. 2). There was no significant difference in the QTc dispersion between the two groups (Table 3). The degree of changes before and after the administration of solutions in the coronary artery were as follows: maximum QTc interval, 48.2±39.3 vs. 25.0±28.5 ms, p=0.028; minimum QTc interval, 38.3±31.3 vs. 13.0±30.7 ms, p=0.007; and mean QTc interval, 45.1±30.3 vs. 20.9±23.3 ms, p=0.004. All these parameters were significantly higher in the NS group than the 5% DW group. The degree of change in QTc dispersion was higher in the 5% DW group, but there was no statistical significance (Table 4).
Effects on ST-segment and T-wave
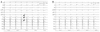
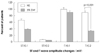
Following the administration of NS and 5% DW, the proportion of cases in which the ST-segment was changed by >0.1 mV at more than one lead was 66.7% and 38.1%, respectively (p=0.052). The proportion of cases in which the T-wave amplitude was changed by >0.2 mV was 90.0% and 33.3% in the corresponding order (p=0.001) (Figs. 3 and 4, Table 5).
Discussion
In the current study, following the administration of NS in the coronary artery in patients with variant angina, prolonged repolarization of the ventricle and a change in the amplitude of the T-wave were observed. Romanelli et al.21) reported that the QT-interval was increased following the administration of 10 mL of NS in the left coronary artery of healthy people who had no significant stenoses on coronary angiography. The current study was conducted in patients with variant angina, and it showed similar results following the administration of 5 mL of saline in the left coronary artery.
In 0.7% of patients in whom coronary angiography is performed, fatal ventricular arrythmias develop with no relationship to the underlying presence of coronary diseases.22) To date, however, the exact mechanisms underlying this phenomenon have not been determined. In general, following the administration of drugs, including contrast media in the coronary artery, the QT-interval is increased. Presumably, this might originate from the high osmolarity, the relatively lower temperature, and the effects of electrolytes.4)23) Indeed, this change in ventricular repolarization might have a close relationship with ventricular arrhythmias. In the current study, an increased QT-interval and a change in the amplitude of the T-wave were observed in the NS group compared to the 5% DW group. Although unclear, the possible mechanisms might be based on the difference between the osmolarity and types of electrolytes between the two fluids. The temperature of fluids and the hemodynamic changes due to drug administration were identical between the two groups. This is therefore inadequate for explaining the reasons for a higher degree of changes of ECG findings observed in the NS group. In the current study, the fluid was infused into the left coronary artery. The changes in the ECG were mainly localized to the anterior chest leads. This explains the reasons for the change in repolarization in the areas in which coronary arteries are distributed. NS contains electrolytes, such as sodium and chloride, and has a lower osmolarity. In general, the effects on ventricular repolarization in association with contrast media are closely related to hyperosmolarity. In the current study, however, the change in repolarization was more severe with NS (lower osmolarity) compared to 5% DW (higher osmolarity). These findings indicate that the electrolytes, rather than the osmolarity, were a more influential factor. Synder et al.4) reported that sodium contained in the contrast media was closely associated with the occurrence of ventricular arrhythmias during coronary angiography. Depolarization of the myocardium was initiated by the influx of sodium into the myocardium. Subsequently, the secondary slower influx of Ca leads to progression of this phenomenon.24) The administration of NS containing sodium in the coronary artery induces an ionic concentration gradient in the myocardium around the coronary artery. This affects the depolarization of the myocardium and then induces an increased QT-interval, which remains unclear.
It is known that an increased QT-interval and QT-dispersion raise the risk of developing malignant ventricular arrhythmias and cardiac sudden death.18)19) Arrowood et al.25) reported that the QT-interval was increased prior to coronary angiography in patients who developed ventricular fibrillation during the procedure. In patients with variant angina, the QT-interval and QT-dispersion are increased.10-12) It is assumed that the transient increase in the QT-interval will further increase the sensitivity to ventricular arrhythmias. According to what is known, however, coronary angiography and the direct drug loading test in the coronary artery are stable procedures in patients with variant angina.9) In fact, coronary angiography and intervention are increased annually in a geometric progression fashion. The incidence of arrhythmias associated with coronary angiography is still lower. Presumably, this might be because the QT-interval is transiently increased in association with the procedure. Also, in the current study, in cases in which NS was infused into the coronary artery, the mean QTc interval increased to 495±52 ms. In most cases, however, there was a short change within 1 minute. It therefore remains unclear whether this change is of clinical significance.
The limitations of the current study include the following: 1) The study was small-scale; 2) The comparison was made between NS and 5% DW only; if the current study had compared a 5% dextrose saline solution and lactated Ringer's solution, both of which contain electrolytes, better outcomes would have been generated; and 3) In our series, the direct causes affecting the increased QT-interval which developed following the administration of NS in the coronary artery were not identified.
Despite these limitations, the current study showed that NS, which we commonly use for coronary angiography, could cause a transient increase in ventricular arrhythmias as compared with 5% DW when administered in the coronary artery of patients with variant angina. Great care must be taken in cases in which solutions, such as NS, are used for coronary angiography or intervention and cause a transient increase in the QT-interval in patients who have clear evidence of abnormal ventricular repolarization.
 XML Download