

 PDF
PDF ePub
ePub Citation
 Print
Print


Foot pressure measurement has been gaining in popularity since it was introduced to clinical and research use. Many conditions are associated with abnormal regional foot pressure and its distribution, including metatarsalgia, corn and callosity, heel pain, various foot deformities, and diabetic foot ulcer.1234567) Furthermore, some recent studies have investigated the relationship between plantar pressure and other musculoskeletal conditions, such as patellofemoral pain syndrome and leg length discrepancy.89)
Abnormally increased plantar pressure is considered to contribute to mechanical pain, and abnormal plantar pressure distribution can reflect biomechanical imbalance. 710) These relationships are the basis for the clinical use of pedobarography. Pressure is defined as force per unit area applied in a direction perpendicular to the surface of an object.11) Therefore, plantar pressure can be affected by many factors, such as subject's weight, contact surface, and acceleration at the time of ground contact, which could be modulated by mechanical properties of plantar soft tissue.1213)
Peak pressure and pressure-time integral have been the most commonly used indices for the consideration of plantar pressure in clinical conditions. Peak plantar pressure was shown to associate with diabetic neuropathy and diabetic foot ulcer as well as foot discomfort in normal subjects.1415) Pressure-time integral is also known to correlate with foot pain in patients with pes cavus.16)
However, foot pressure characteristics are not sufficiently well understood in normal subjects. Furthermore, few studies have assessed foot pressure features along with radiographic findings. The establishment of normative data would help to clearly define pathologic conditions as well as to set appropriate treatment goals. The authors hypothesized that male and female subjects would have different pedobarographic characteristics. So, the aim of this study was to examine the pedobarographic characteristics of young healthy adults with no foot problems with regard to sex-related differences and correlations among measurement indices.
METHODS
This prospective study was approved by the Institutional Review Board of Chung-Ang University (IRB No. 1041078-201411-HR-169-01), and informed consent was obtained from all participants.
Participants
Young adult volunteers were recruited and asked if they had any medical or surgical conditions. Of the subjects without any medical or surgical issues, those with the following conditions were further excluded: (1) previous foot or ankle trauma, (2) infection, (3) tumor, (4) congenital anomaly, (5) neuromuscular disease, (6) foot and ankle pain or discomfort, and (7) any other condition that could limit the subjects' activity. Ten male and 10 female young adults were ultimately included. Demographic data were collected and recorded, including age, sex, height, and weight. Anteroposterior (AP) and lateral foot radiographs were taken with a UT 2000 X-ray machine (Philips Research, Eindhoven, The Netherlands) set to 50 kVp and 5 mAs at a source-to-image distance of approximately 100 cm, with the participants in a standing position.
Radiographic Measurement
Radiographic indices were measured to evaluate the foot shape. AP talo-first metatarsal angle was measured on the AP weight bearing foot radiograph, and naviculocuboid overlap and lateral talo-first metatarsal angle were measured on the lateral weight bearing foot radiograph. The selection of radiographic indices was based on a previous study that investigated the reliability and validity of foot radiographic measurements.17) Plantar soft tissue thickness was measured under the first metatarsal head and calcaneal tuberosity (Fig. 1). Radiographic measurements were performed by an orthopedic surgeon (BCC) with 8 years of experience.
Measurement of Dynamic Foot Pressure and Maximum Ankle Dorsiflexion During Gait
Dynamic foot pressure measurements and kinematic data were collected simultaneously. For the acquisition of ankle kinematic data, markers were placed on all participants by a single skillful operator (YJK). Four reflective skin markers according to Plug in Gait marker set were placed on the heel, dorsum of the second metatarsal head, lateral malleolus, and anterior shank. The movement of each marker was captured by six motion capture cameras at a sampling rate of 100 Hz, retrieved, and analyzed digitally using a Vicon MX T-10 system (Vicon Motion Systems, Oxford, UK). As kinematic data, maximum ankle dorsiflexion was collected and recorded. Three gait trials were conducted and averaged to a single data set.
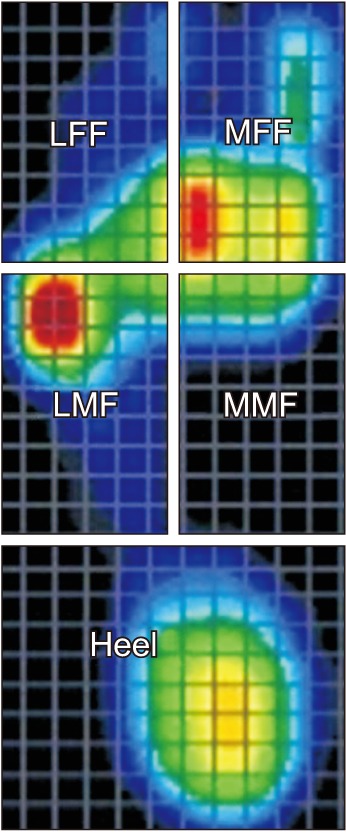
Dynamic foot pressure was measured using a treadmill pedobarograph system, FDM-TDSL (Zebris Medical, Isny Im Allgäu, Germany). The system has a belt consisting of a 150 × 50 cm2 running surface and 94.8 × 40.6 cm2 sensor surface containing 5,376 pressure-sensing cell/cm2. The sensors were connected to a computer to show the distribution of pressure at a sampling rate of 100 Hz as the subjects walked barefoot on the treadmill. The walking speed was set to be 3.2 km/hr, and all participants were asked to practice exercise walking at the predetermined speed for 5 minutes before testing. After the foot pressure data were obtained, the information was collected and processed with use of software specifically designed for the treadmill foot pressure measurement system. The area of measurement was divided equally into anterior, middle, and posterior thirds, and the anterior and middle thirds were further equally divided into medial and lateral halves.1718) Therefore, five segments were defined: medial forefoot (MFF), lateral forefoot (LFF), medial midfoot (MMF), lateral midfoot (LMF), and heel (Fig. 2). The peak pressure and pressure-time integral were retrieved for the five segments of the foot. The distribution of pressuretime integral was calculated as a percentage reflecting the proportion of each segment of the sum of the five segments. The peak pressure varus/valgus index was defined as [(MFF + MMF) − (LFF + LMF)] / (MFF + MMF + LFF + LMF).1718) The peak pressure forefoot/heel index was defined as (MFF − heel) / (MFF + heel). The pressure-time integral varus/valgus index was calculated using the same method as peak pressure, and the pressure-time integral forefoot/heel index was defined as (MFF + LFF − heel) / (MFF + LFF + heel).
Statistical Analysis
A priori sample size calculation was performed according to a previous study19) at the setting of an alpha error of 0.05 and a power of 0.8. Descriptive statistics including mean and standard deviation (SD) were used to summarize the patients' demographic data, radiographic measurements, kinematic data, and pedobarographic data. The normality of data distribution was determined using the Kolmogorov-Smirnov test. The variables were compared between male and female subjects using Student t-test. The correlations among variables were analyzed using Pearson correlation coefficients. Statistical analysis was performed using SPSS ver. 20.0 (IBM Corp., Armonk, NY, USA), and significance was set at p < 0.05.
RESULTS
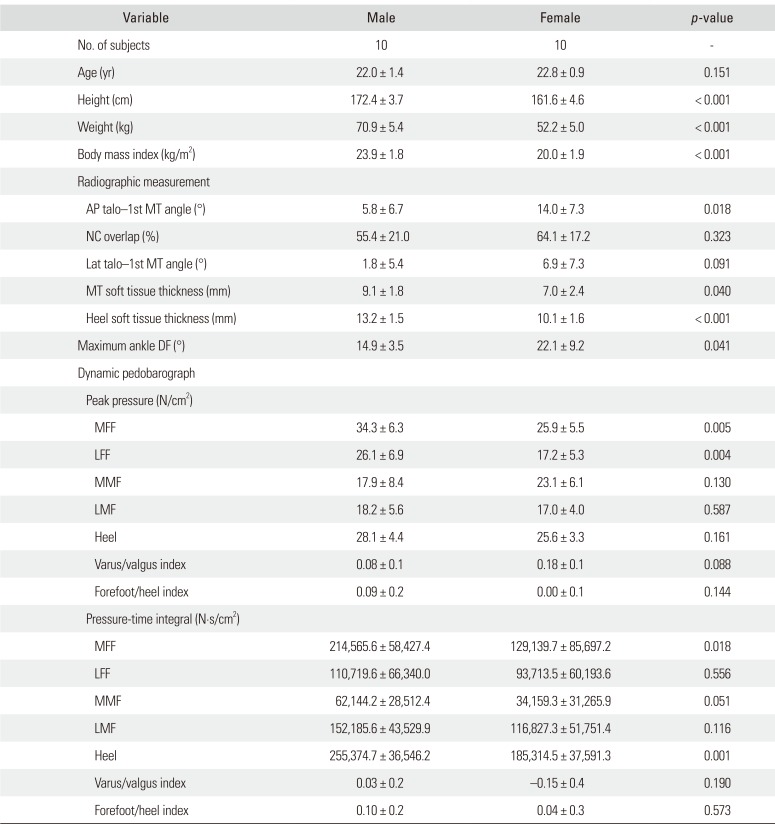
Data from the 20 right feet of the 20 subjects were selected and analyzed. The mean age of the subjects was 22.4 years (SD, 1.2 years). There were 10 male subjects (mean age, 22.0 years; SD, 1.4 years) and 10 female subjects (mean age, 22.8 years; SD, 0.9 years). The male subjects had a mean height of 172.4 cm (SD, 3.7 cm), mean weight of 70.9 kg (SD, 5.4 kg), and mean body mass index (BMI) of 23.9 kg/cm2 (SD, 1.8 kg/cm2). The female subjects had a mean height of 161.6 cm (SD, 4.6 cm), mean weight of 52.2 kg (SD, 5.0 kg), and mean BMI of 20.0 kg/cm2 (SD, 1.9 kg/cm2).
On radiographic measurements, the mean AP talo-first metatarsal angle was 9.9° (SD, 8.0°), the mean naviculocuboid overlap was 0.6 (SD, 0.2), and the mean lateral talo-first metatarsal angle was 4.4° (SD, 6.7°). The mean plantar soft tissue thickness was 8.0 mm (SD, 2.3 mm) under the first metatarsal head and 11.7 mm (SD, 2.2 mm) under the calcaneal tuberosity.
Maximum ankle dorsiflexion during stance phase was 18.7° (SD, 7.2°) on average. The mean peak pressure on the MFF, LFF, MMF, LMF, and heel was 30.3 N/cm2 (SD, 8.0 N/cm2), 22.0 N/cm2 (SD, 8.0 N/cm2), 19.9 N/cm2 (SD, 6.3 N/cm2), 19.5 N/cm2 (SD, 7.1 N/cm2), and 26.9 N/cm2 (SD, 4.3 N/ cm2), respectively. The mean pressure-time integral on the MFF, LFF, MMF, LMF, and heel was 13.2 N·s/ cm2 (SD, 6.0 N·s/cm2), 7.6 N·s/cm2 (SD, 4.9 N·s/cm2), 3.3 N·s/cm2 (SD, 2.0 N·s/cm2), 8.5 N·s/cm2 (SD, 3.1 N·s/cm2), and 15.5 N·s/cm2 (SD, 3.3 N·s/cm2), respectively, which corresponded to 26.7% (SD, 9.9%), 15.5% (SD, 8.1%), 7.0% (SD, 3.8%), 18.0% (SD, 6.6%), and 32.7% (SD, 6.2%), respectively.
Male and female subjects showed significantly different BMI (p < 0.001), AP talo-first metatarsal angle (p = 0.018), soft tissue thickness under the metatarsal head (p = 0.040) and the calcaneal tuberosity (p < 0.001), maximum dorsiflexion during stance phase (p = 0.041), peak pressure on the MFF (p = 0.005) and LFF (p = 0.004), and pressuretime integral on the MFF (p = 0.018) and heel (p = 0.001). No sex-related differences were observed in peak pressure varus/valgus index, peak pressure forefoot/heel index, pressure-time integral varus/valgus index, or pressuretime integral forefoot/heel index (Table 1).
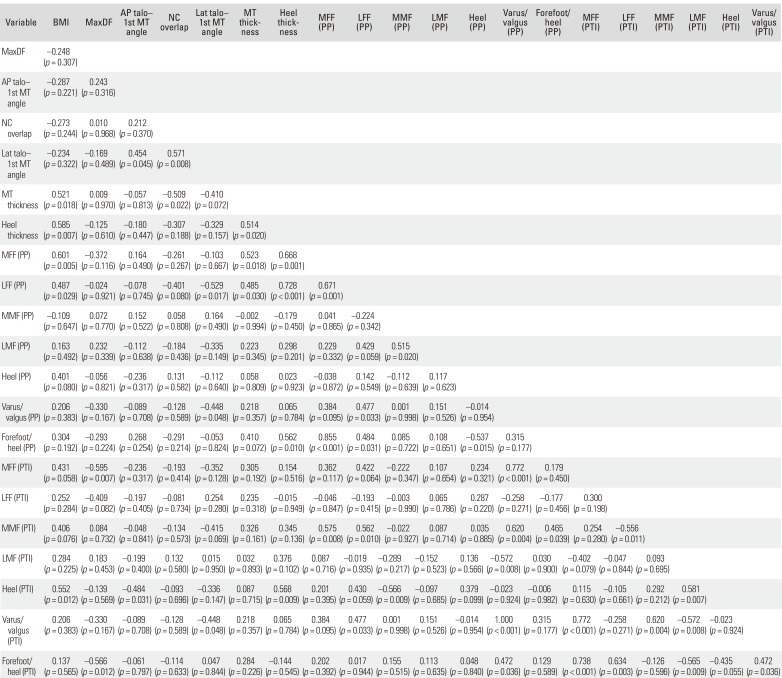
BMI was significantly correlated with soft tissue thickness under the metatarsal head (r = 0.521, p = 0.018) and calcaneal tuberosity (r = 0.585, p = 0.007), peak pressure on the MFF (r = 0.601, p = 0.005) and LFF (r = 0.487, p = 0.029), pressure-time integral on the heel (r = 0.552, p = 0.012), and total pressure-time integral (r = 0.755, p < 0.001). Maximum dorsiflexion demonstrated a significant negative correlation with pressure-time integral on the MFF (r = −0.595, p = 0.007) and total pressure-time integral (r = −0.492, p = 0.032). Pressure-time integral varus/ valgus index was significantly correlated with pressuretime integral forefoot/heel index (r = 0.472, p = 0.036), pressure-time integral on the MFF (r = 0.772, p < 0.001), MMF (r = 0.620, p = 0.004), and peak pressure varus/valgus index (r = 1.000, p < 0.001) (Table 2).
DISCUSSION
This study investigated dynamic plantar pressure during walking in young healthy adults, focusing on normal values and the distribution of peak pressure and pressure-time integral, sex-related differences, and correlations among the variables. Male subjects demonstrated higher peak pressure on the MFF and LFF and pressure-time integral on the MFF and heel than female subjects. Female subjects demonstrated thinner plantar soft tissue and greater dorsiflexion during gait than male subjects.
Men and women are anatomically different,20) and their anthropometric and biomechanical properties are also considered to differ. However, there have been few studies investigating sex-related differences in foot pressure. A previous study reported a different angle of center of pressure progression during normal gait between the two sexes.2) Another study reported no significant sex-related differences in normalized midfoot contact area or plantar pressure values between males and females.21) Yet, another study found no significant sex differences in peak pressure, contact time, pressure-time integral, or instant of peak pressure, although male subjects had a larger contact area, pressure-time integral, and maximum force in some specific areas.22) These inconsistent results might be attributable to experimental conditions (barefoot vs. in-shoe), measurement area of the foot, and measurement parameters. Our study demonstrated significant sex-related differences in plantar soft tissue thickness, maximum dorsiflexion during stance phase, peak pressure on the MFF and LFF, and pressure-time integral on the MFF and heel. However, we could not further evaluate whether these differences were caused by sex-specific characteristics or by the effect of body size and ankle kinematics due to the small sample size. Multiple regression analysis with a larger number of subjects would help to clarify this issue.
Along with sex-related difference in plantar pressure, a previous study suggested that different ethnic groups might have different foot pressure characteristics.23) Foot pressure measurement is increasingly used for clinical and research purposes in diabetic foot ulcer, footwear or orthosis, foot deformities, and sports activities.13414161824252627) It is necessary to establish normal data according to sex and ethnic groups in order to help clinicians and researchers set appropriate treatment goals and obtain appropriate control data.
Male subjects demonstrated greater peak pressure on the MFF and LFF as well as greater pressure-time integral on the MFF and heel than female subjects. Male subjects also had greater plantar soft tissue thickness on metatarsal heads and heel. Considering that no participants had any pain or discomfort, the question arises as to the result whether greater soft tissue thickness can bear and adapt to the greater peak pressure or pressure-time integral. Another hypothetical explanation is that male and female subjects have different pressure thresholds for pain and discomfort, but this possibility requires further study. A previous study reported that the location of the sole, the area of the pressure exerted, and the velocity of the pressure could affect pain and discomfort in the human foot,28) which suggests the possibility that males and females might have different pressure thresholds.
Higher BMI was found to correlate with increased peak pressure on the MFF and LFF, pressure-time integral on the heel, and total pressure-time integral as well as greater plantar soft tissue thickness. Currently, it remains unknown whether the thicker plantar soft tissue could capacitate the increased peak plantar pressure and pressure-time integral, or whether the increased loading to the plantar surface would cause discomfort and pain as a pathogenetic condition in obese subjects. A more comprehensive study including both normal controls and patients with pressure-related disease could elucidate this issue.
Maximum dorsiflexion was negatively correlated with pressure-time integral on the MFF and total pressuretime integral. This result supports the clinical consensus that patients with limited dorsiflexion due to tight Achilles tendon tend to have foot discomfort or pain caused by plantar pressure, which is also evidenced by a previous study reporting the effect of calf-stretching exercises.29) The correlation between medial-lateral balance (varus/ valgus index) and anterior-posterior balance (forefoot/ heel index) of the pressure-time integral is considered to be a function of the subtalar joint. Subtalar joint motion is a complex combination of three-dimensional movement, comprising plantar flexion, adduction, and inversion in one direction and dorsiflexion, abduction, and eversion in the opposite direction. We believe that this complex motion modulates the balance between medial-lateral and anterior-posterior direction. However, to the best of our knowledge, no study to date has investigated plantar pressure measurement with a multi-segment foot kinematic model. The multi-segment foot model must be integrated to clarify this correlation between medial-lateral and anterior-posterior balance and the role of the subtalar joint.
Before discussing the study results in detail, some limitations need to be addressed. First, the subject number was somewhat small, and the study results should be generalized with caution. Second, the pedobarographic measurement was conducted during treadmill walking. Some researchers have criticized treadmill walking as potentially different from ground walking, which could cause bias in evaluating kinematic and kinetic data during gait.30) Third, combined ankle and subtalar motion was evaluated as an ankle kinematics in this study. Separate evaluation of subtalar joint motion might have been more effective in investigating medial-lateral balance and adaptation, which could possibly have an effect on the varus/valgus index of foot pressure.
In conclusion, male and female young healthy adults showed different pedobarographic findings in this study. This result could provide useful information in setting appropriate treatment goals and obtaining appropriate control data.

 XML Download