

 ePub
ePub Citation
 Print
Print


INTRODUCTION
Orthodontic synthetic elastomeric chains comprise polyurethane-based amorphous polymers and exhibit time-dependent viscoelastic behavior. Therefore, in these materials, the change of viscoelastic properties with time and environment1 does not allow stress to be modeled by general strain or strain rate functions and depends on deformation history. In addition, physicochemical changes caused by alterations of internal molecular structure at the time of elongation result in permanent deformation when stress is removed.2
The force decay of orthodontic synthetic elastomeric chains has been extensively investigated. Brantley et al.3 suggested the application of as much as four times the desired constant load at insertion, which, however, may result in excessive patient discomfort.4 Moreover, some studies have recommended prestretching orthodontic synthetic elastomeric chains before use; however, research in this direction is still scarce. Chang5 suggested 100% prestretching in clinical applications to reduce the initial force. von Fraunhofer et al.6 observed that 10-second prestretching to 100% of the original length had little effect on load relaxation; however, no other prestretch conditions were described in the above work. Prestretching conditions described by Stevenson and Kusy7, Brantley et al.,3 and Kim et al.8 are difficult to apply in clinical trials, since the corresponding maximum prestretching periods equal 100 days, 3 weeks, and 4 weeks, respectively.
Thus, there is a need to develop a prestretch method enabling the clinical applications of orthodontic synthetic elastomeric chains. Herein, in order for the developed method to be applicable on the chair side, we decided to utilize a short-time length extension. Moreover, we tried to predict the change in stress due to the clinical movement of teeth.
In view of the above, this study aimed to determine an appropriate degree of prestretch for orthodontic synthetic elastomeric chains, focusing on their time-dependent viscoelastic properties. Specifically, our objectives were to determine the relationship of the degree of prestretch to stress relaxtion, and to permanent deformation, and to evaluate the estimated stress resulting from tooth movement.
MATERIALS AND METHODS
A closed-type clear Generation II Power Chain (product A; Ormco Corporation, Orange, CA, USA) and an S space (3.0 mm) medium-force Pro-chain (product B; Dentsply Sirona K.K., Tokyo, Japan) were used as orthodontic synthetic elastomeric chains (Figure 1A). The above materials were chosen in view of the fact that product A has been extensively characterized, in contrast to product B. The glass transition temperatures (Tg) of products A and B were determined (DSC 200; Netzsch GmbH & Co., Selb, Germany) as −33.2℃ and −31.4℃, respectively. Each specimen comprised nine units. After prestretch, in consideration of terminal effects, which is the effect that the monomer units near the ends of the polymer chain are different from those in the chain, the inner circular rims of seven units were measured excluding the outer unit (Figure 1B). To maintain constant strain during the experimental period, 7 × 12 cm acrylic plates were fabricated (Figure 1C).
Prestretch was performed to achieve length increases of 0 (control), 50%, 100%, 150%, and 200% of the original value for one and three repeated cycles using a universal testing machine (UTM; 5942; Instron, Norwood, MA, USA) and Bluehill 2 software (Instron). The rate of load, end rate of unload, and holding duration were set to 1,800 mm/min, 1,700 mm/min, and 5 seconds (0.0833 minute), respectively. The adopted sample classification scheme is shown in Figure 1D. A total of 180 samples were divided into 9 groups according to brand (A1–A9 and B1–B9).
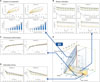
Stress-strain curves were obtained for each group by operating the UTM according to the value set by the Bluehill 2 program. A1 and B1 samples were not subjected to any prestretch and were used as controls. The hysteresis area (N mm/mm3) enclosed by loading and unloading curves was integrated and listed in order of magnitude. Figure 2A shows the total area sum over each product's stress-strain curve, referring to the energy lost upon prestretching.
The length at 1.96 N (200 gram-force [gf], 1 gf = 0.0098 N) was measured for each group and applied to a pre-fabricated acrylic plate, as shown in Figure 1E. The above value was chosen in view of the fact that a force of 200 gf was applied to teeth using a force gauge after prestretch in a previous clinical trial. During the experiment, specimens were preserved in a sealed container filled with artificial saliva (composition previously reported by Leung and Darvell9) (Figure 1F) and stored in an incubator at 37℃ (Lab Companion SI-600R Benchtop Shaker; GMI Inc., Ramsey, MN, USA) (Figure 1G). For 8 weeks, a constant strain was maintained by the acrylic plate, and stress and permanent deformation were recorded at the time points of 1 hour, 24 hours, and 1, 2, 3, 4, 5, 6, 7, and 8 weeks. Ten of each group were measured by connecting the jig to the UTM (Figure 1H), and average values excluding the maximum and minimum were obtained. To reduce the error of permanent deformation measurement, the elastomeric chains were covered with a transparent acrylic plate when a digital Vernier caliper (CD-15APX; Mitutoyo, Kawasaki, Japan) was used, as shown in Figure 1I. During the experiment, specimens were observed using the Micro Hi Scope system (KH-1000; Hirox, Tokyo, Japan) at the same point every week (Figure 1J).
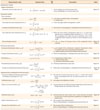
To determine the relationship of the degree of prestretch to stress relaxation, and to permanent deformation, and to evaluate the estimated stress resulting from tooth movement, representative values were calculated as shown in Table 1.
All statistical analyses were performed using SPSS version 20.0 software (IBM Corporation, Armonk, NY, USA), and the relationship of the degree of prestretch to stress relaxation, and to permanent deformation were determined using Pearson correlation analysis.
RESULTS
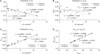
Figure 3 shows correlations between different parameters, and Table 2 summarizes the results of Pearson correlation analysis. The degree of prestretch was strongly correlated with the stress relaxation ratio (RX) for both products (product A: correlation coefficient = −0.906, R2 = 0.821, p < 0.001; product B: correlation coefficient = −0.929, R2 = 0.864, p < 0.001), whereas no significant correlations were observed with the average normalized permanent strain (gX(c)), (product A: correlation coefficient = −0.255, R2 = 0.065, p = 0.508; product B: correlation coefficient = −0.718, R2 = 0.516, p = 0.029). A strong correlation with permanent deformation strain (εper) measured immediately after prestretch was observed for both products (product A: correlation coefficient = 0.974, R2 = 0.948, p < 0.001; product B: correlation coefficient = 0.949, R2 = 0.901, p < 0.001). Moreover, the average permanent strain (εperx(c), equation [Eq.] 8) demonstrated a strong positive correlation with the sustained total strain (εtotalx) (product A: R2 = 0.988; product B: R2 = 0.993), as confirmed by the shape of the plot of normalized permanent strain (gX(t)) superimposed in approximately the same form (Figure 2C).
Figure 2D shows the estimated stress (δX(t), Eq. 15) resulting from tooth movement (1 mm/4 weeks). For product A, the highest values at weeks 4 and 8 were both observed in group A9, equaling 1.19 N/mm2 (114.23 gf) and 0.58 N/mm2 (55.88 gf), respectively. For product B, the highest values at weeks 4 and 8 were both observed for group B9, equaling 1.27 N/mm2 (117.93 gf) and 0.64 N/mm2 (59.78 gf), respectively.
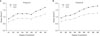
To examine the trends of elastic restoring stress and recorded stress, the average stress for the 8-week period was obtained using Eqs. 16 and 17, respectively, with the results shown in Figure 4.
Figure 2E presents a representative three-dimensional graph for B9, enabling the comparison of recorded stress maintained under constant strain, with the estimated stress resulting from tooth movement.
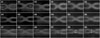
Photographs captured using the Micro Hi Scope system (original magnification, × 50) immediately after prestretch (Figure 5) show that in contrast to product A, product B exhibited visible whitening in the thinnest chain joints in groups B7, B8, and B9.
DISCUSSION
As shown in Figure 3A and Table 2, the degree of prestretch was negatively correlated with the stress relaxation ratio, i.e., the stress maintained under constant strain increased with increasing extent of prestretch. As shown in Figure 3C, the permanent deformation immediately after prestretch was positively correlated with the degree of prestretch, whereas no such correlation was observed when time condition was included (Figure 3B). Permanent deformation was positively correlated only with the constant strain set at the beginning of the experiment (Figure 3D), in agreement with the results of Yagura et al.,10 who found that permanent deformation was proportional to the stretching extent. Therefore, orthodontic synthetic elastomeric chains with properties altered by prestretch did not increase permanent deformation at weeks 4 and 8 during proper orthodontic treatment. In other words, prestretch immediately before use can be used to provide the desired stress for orthodontic treatment. In addition, as shown in Figure 2D, the estimated stress resulting from tooth movement increased with increasing degree of prestretch. Although the difference between prestretch groups and non-prestretch (control) groups decreased with time, higher values were observed for the former in the last week of the experiment. Therefore, even if the amount of retained strain decreased upon tooth movement, prestretch-induced stress gain could still be achieved.
Orthodontic synthetic elastomeric chains are polyurethane-based polymers with time-dependent viscoelasticity and other environment-dependent properties. Based on the results of previous studies on the property changes of elastomers upon exposure to moisture and heat,71112 the specimens investigated herein were stored in artificial saliva (in an incubator at 37℃) of a suitable composition.9
The present study was conducted by measuring the strain corresponding to 200 gf after prestretch to understand the behavior of the elastic restoring stress after a certain period of time (assuming that a force gauge was applied to teeth). Based on the retraction force (100–250 g) of teeth proposed by Storey and Smith13 and Reitan,14 the initial force of all specimens was adjusted to 200 gf (1.96 N), which was also within this range. Notably, the current opinion on initial stress and stress relaxation is controversial. Thus, De Genova et al.11 reported that a high initial force resulted in a smaller force relaxation than a weak initial force, whereas the reverse was claimed by Lu et al.15 Herein, the prescribed initial stress was applied equally to all specimens to eliminate initial stress parameters and maintain experiment accuracy.
The experimental time frame was chosen assuming a four-week visit period for general orthodontic treatment. Since some patients cannot attend these appointments, the experimental period for stress relaxation evaluation was set to eight weeks.
Stress relaxation, a characteristic of viscoelastic behavior, is observed with progressing time upon the application of a certain amount of strain. Although stress relaxation investigations have so far provided broadly variable results,161718 this variability is thought to reflect the corresponding variance of experimental environments. However, in all of the above studies, the stress rapidly decreased at an early stage.
When subjected to a load, elastomers deform and cannot completely return to their initial length even if the load is removed, with the difference between the initial and final dimensions known as permanent deformation. Herein, we measured length changes every week, revealing that the degree of permanent deformation was less than that observed by Song and Kim,17 which was thought to reflect the differences in the utilized materials. The curved form of the graph reflecting the temporal evolution of normalized permanent strain (gX (t)) was consistent with the results obtained by Yagura et al.10 Herein, permanent deformation was found to be proportional to the stretching extent (Figure 3D). In addition, the highest percentage of permanent deformation was observed during the first week, which agreed with the decrease of the large early-stage permanent deformation with time. In contrast, immediately after prestretch, permanent deformation was correlated with the degree of prestretch. Thus, prestretch behavior affected elastomeric properties such as stress but did not affect the life expectancy for proper orthodontic treatment. In other words, the act of pulling the orthodontic synthetic elastomeric chain just before use can be employed to apply the desired stress for orthodontic treatment.
According to a review by Baty et al.,19 the residual stress of prestretch increased by only 5% in three weeks, suggesting that clinical benefit was suspected. Other studies reported that prestretch of orthodontic synthetic elastomeric chains before use reduced stress relaxation by 7% to 25% compared to the control group after 24 hours.16 Moreover, some investigations reported the absence of clinically significant differences after three weeks when prestretch was performed.4 Higher residual stresses were observed herein, e.g., for groups A9 and B9, prestretch reduced the recorded stress relaxation values by 42.98% and 44.27% at week 4, respectively, with the corresponding decreases of estimated values resulting from tooth movement (1 mm/4 weeks) equaling 31.09% and 31.92%, respectively. Figure 4 shows the average of recorded stress and the estimated stress (recorded as elastic restoring stress) for a time period of 8 weeks, revealing that the gap between the two graphs increased with increasing degree of prestretch. In other words, when the amount of strain decreased because of tooth movement, the prestretch-induced stress gain also decreased but remained higher than that in the control group. In determining the appropriate amount of prestretch, Wong4 emphasized that elastomeric materials need to be prestretched by one-third of their length to increase strength. Bishara and Andreasen20 suggested that the prestretch distance should not exceed the subsequently used in-mouth stretch distance, since an increase of permanent deformation is observed otherwise. Based on the obtained results, we recommend stretching to 200% of the original length for three cycles (product A) and stretching to 150% of the original length for three cycles (product B) just before use to apply an appropriate stress for tooth movement until next visit while avoiding excessive initial stress. Herein, the maximum degree of prestretch demonstrated the highest stress value (Figure 2B and 2D); however, in product B, as shown in Figure 5, visible whitening appeared from B7 to B9, and the elastic restoring stress (δX(c), Eq. 16; Figure 4B) tended to plateau from B7. Therefore, we recommend prestretching to B7 (i.e., performed in 3 cycles with 150% of original length) in the case of product B.
Physical and chemical changes of synthetic elastomeric chains are caused by alterations of their internal molecular structure. Specifically, differences in physical properties can be estimated by comparing the punched size and thickness of each product. Herein, the thicknesses of products A and B were both equal to 0.5 mm, and their length ratios were experimentally adjusted to be the same. However, because the thickness in the neck of the thinnest part of the product B chain was thinner than that of product A, we inferred that aging preferentially appeared in product B, even though it was pulled at the same length ratio. However, this difference was not clinically significant.
Most of the studies have been applied prestretch for a long-term to change the material properties, making it impossible to apply in clinical practice.378 Herein, we compared the effects of short-term stretching length and number of cycles on the behavior of synthetic elastomeric chains in various clinical applications on the chair side.
A number of attempts have been made to reflect physiological tooth movement in experimental designs of stress relaxation of orthodontic synthetic elastomeric chains. De Genova et al.11 and Boester and Johnston21 measured a length reduction of 0.5 mm per week, and Lim and Lim22 observed 1- and 2-mm unloading points after four weeks. In the present study, stress was measured after keeping the strain constant during the experiment. Since permanent deformation strain was recorded, the estimated stress (δX(t), Eq. 15) resulting from orthodontic tooth movement (1 mm/4 weeks23) was calculated by excluding the ratio of calibrated tooth movement (Eq. 12). Eq. 11 reflects the calibrated tooth movement (mm), assuming a tooth movement of 1 mm per 4 weeks. Eq. 14, showing that the reduction in elastic recovery strain is dependent on the extent of orthodontic tooth movement, was obtained by making several assumptions. First, it was assumed that the rate of tooth movement equaled 1 mm/4 weeks.23 Second, the recorded permanent deformation strain was assumed to not change despite the movement of the tooth. Third, the stress-strain curve was assumed to be linear in any given small section. For product A, the highest estimated stress values at weeks 4 and 8 were both observed for group A9 and equaled 1.19 N/mm2 (114.23 gf) and 0.58 N/mm2 (55.88 gf), respectively, whereas the corresponding maxima observed for product B (group B9) equaled 1.27 N/mm2 (117.93 gf) and 0.64 N/mm2 (59.78 gf), respectively. These values were slightly smaller than those obtained by De Genova et al.11 in view of the use of a thermal cycled environment in the latter case. Similarly, the above authors11 used the same reasoning to explain why their experimental value exceeded that obtained by Hershey and Reynolds.24 Specifically, Hershey and Reynolds24 reported that 50% of force was lost during the first day, and only 10% of the initial force was lost during the following 4 weeks. However, when simulating tooth movements of 0.25 and 0.5 mm per week, initial force losses of 67% and 75% were obtained, respectively, which were close to the estimated values determined herein. In the 1- and 2-mm unloading experiments performed by Lim and Lim,22 force decreased by ~10% when 1-mm unloading was performed, which was similar to the difference between the recorded and estimated values in the present study.
The values of estimated stress resulting from tooth movement at week 4 were within the range of the tooth retraction force (100–250 g) proposed by Storey and Smith13 and Reitan.14 Nevertheless, values outside of this range were obtained at week 8, significantly exceeding values obtained for the control group. The difference between prestretch and control groups decreased with time, i.e., although the effect of prestretch decreased with time, adequate stress was applied to the tooth by the orthodontic synthetic elastomer chain by week 4 after the general dental orthodontic visit.
CONCLUSION
• Although prestretch affected the change of elastomer properties and benefited residual stress, it was not accompanied by disadvantages such as permanent deformation, which would result in a loss of elastic recovery ability.
• Despite the decrease of strain upon tooth movement, prestretch benefitted residual stress.
• In general, higher residual stresses were observed for product B than for product A, but this difference was not clinically significant.
• Prestretch of orthodontic synthetic elastomeric chains was concluded to be a necessary pre-requisite for maintaining the stress of physiological tooth movement.


 XML Download