

 PDF
PDF ePub
ePub Citation
 Print
Print


INTRODUCTION
One of the most important factors for reliable cephalometric analysis is the easy identification of cephalometric reference points. For more than half a century, menton (Me) and pogonion (Pog) have been used as reference points for the vertical and sagittal evaluation of the mandible in traditional cephalometric analysis.12 Me has also been widely used as a midpoint of the mandible to evaluate the transverse midline deviation of the mandible and/or the mandibular incisors on posteroanterior (PA) cephalograms.345
Cone-beam computed tomography (CBCT) has recently been introduced to the field of orthodontics, and it has been widely used for orthodontic diagnosis and treatment planning.67 Compared to conventional cephalography, CBCT allows three-dimensional (3D) craniofacial analysis with higher accuracy and less distortion.89 However, whether CBCT is more reliable than conventional cephalography is open to discussion,101112 because most landmarks developed for conventional lateral cephalography are still used for CBCT with only minor modifications.
Many CBCT studies on craniofacial asymmetry have used Me as the landmark for the most inferior midpoint of the mandible.131415 In their CBCT study, Sievers et al.14 specifically defined Me as the lower border of the mid-mandibular suture. A previous archaeologic study showed that the mandibular symphysis closes at 7–8 months of age.16 From this point, the identification of the mid-mandibular suture, i.e., the mandibular symphysis, is considered difficult. Other authors1317 have defined Me as the most inferior midpoint of the chin on the outline of the mandibular symphysis. In other words, Me is not a biological structure existing anatomically on the midline of the mandible, but rather an artificial landmark that is defined geometrically. Therefore, in principle, Me is only valid if the most inferior point of the chin is identical to the midpoint of the chin on the symphyseal outline. However, it is questionable whether Me is a valid landmark even in patients with mandibular asymmetry, in whom the most inferior point may not be identical to the midline. Considering this discrepancy, it is worth studying alternative anatomical structures around the symphyseal area that can be used as landmarks for the midpoint of the mandible.
The genial tubercle (GT), also known as the mental spine, is a slight projection found on the lingual side of the mandibular symphysis. The GT may have four tubercles (the superior, inferior, right, and left tubercles), and it provides attachment for the genioglossus and geniohyoid muscles. The GT has only been described in a few orthodontic literatures,1819 and it has been used as the mandibular reference midpoint to evaluate the midline deviation of the mandibular incisors on occlusal or periapical radiographs. To date, however, few studies have used the GT as a landmark to evaluate mandibular asymmetry, because its identification on conventional PA cephalograms is made difficult by image distortion and the superimposition of adjacent structures. Recently, the GT was used as the midpoint of the mandible in a few CBCT studies on mandibular asymmetry.2021
Easy identification is an essential criterion for a reliable landmark. However, there is no consensus on and evidence of GT being a reliable landmark on 3D CBCT images, especially in patients with mandibular asymmetry. The aim of this study was to evaluate the reliability of the identification of the GT on CBCT images and to compare it with that of the traditional landmark, the Me.
MATERIALS AND METHODS
Samples
This study was reviewed and approved by the ethics committee of Gangneung-Wonju National University Dental Hospital (IRB 2013-10). Twenty CBCT images (9 female and 11 male patients; aged [mean±standard deviation, SD], 23.9 ± 6.9 years) were arbitrarily collected from the patient archive of the Department of Orthodontics, Gangneung-Wonju National University Dental Hospital. The inclusion criteria were as follows: (1) age more than 17 years, (2) mandibular asymmetry confirmed using frontal facial photographs, and (3) dental midline deviation greater than 2 mm in the dental cast.
3D measurement of Me and GT on CBCT images
The CBCT images were acquired using Alphard 3030 (Asahi Roentgen Ind. Co., Kyoto, Japan) with the following settings: tube current, 6.0 mA; tube voltage, 80 kV; scan time, 17 s; voxel size, 0.39 mm; and a single 360-degree rotation. All CBCT images used in the present study had the same field of view (200 × 179 mm). 3D reconstructions of the CBCT scan data were performed using a 3D imaging software (OnDemand3D; Cybermed Co., Seoul, Korea). All landmark identifications and measurements were done on a 22-inch HP monitor (LE2201w; Hewlett-Packard, Houston, TX, USA) with a resolution of 1,680 × 1,050 at 60 Hz.
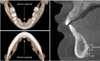
Three reference planes were constructed for the 3D measurements. The Frankfort horizontal (FH) plane was defined as the plane passing through the bilateral orbitales and the right porion. The midsagittal plane was defined as the plane perpendicular to the FH plane and passing through nasion and opisthion. The coronal plane was defined as the plane passing through nasion and perpendicular to the FH plane and the midsagittal plane. Me and GT were identified using the 3D-reconstructed image as well as the horizontal, sagittal, and coronal views, followed by the measurement of the distances from these landmarks to the three reference planes (Figure 1). Me was defined as the most inferior midpoint on the symphyseal outline, and GT was defined as the center of the four GTs of the mandible.
To determine the inter-examiner reliability of landmark identification of Me and GT, two examiners performed the identifications and measurements. Examiner SY is an orthodontist with more than 5 years of experience, and examiner GS is a second-year orthodontic resident. All three reference planes were oriented in all CBCT images before examination. To ensure blind testing, the image files were saved on the computer with only the sample numbers. One examiner opened the images and marked the landmarks and saved the images under a new file name. The reference planes were blinded during landmark identification. Then, the second examiner conducted the same examination and saved the images under another new file name.
To determine the intra-examiner reliability, both the examiners repeated the examinations 1 week later. The re-examined images were saved in different folders. The anteroposterior, vertical, and transverse distances from the landmarks (Me and GT) to the reference planes were measured after all marking was completed by the two examiners.
Statistical analysis
All measurements showed a normal distribution on the Shapiro-Wilk test (p > 0.05). The intra- and inter-examiner reliability of landmark identification of Me and GT was assessed using the intraclass correlation coefficient (ICC). Additionally, Bland-Altman plots were used to compare the reliability of identification of the GT with that of Me along the transverse axis. All statistical analyses were performed using PASW version 18.0 (IBM Co., Armonk, NY, USA).
RESULTS
Table 1 and Table 2 show the intra- and inter-examiner reliability of identification of Me and GT, respectively. Both the landmarks showed generally excellent reliability (ICC ≥ 0.993). Three-dimensionally, both points showed greater ICC values in the anteroposterior and vertical directions than in the transverse direction. In the transverse direction, the ICC values of GT (range, 0.997–0.999) tended to be slightly higher than those of Me (range, 0.993–0.996).
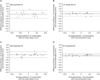
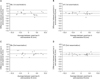
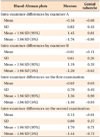
The reliability of landmark identification along the transverse axis was evaluated in greater detail by using Bland-Altman plots. Table 3 and Figures 2, 3 show the Bland-Altman plots of the difference against means for the two separate assessments. According to the Bland-Altman plots, both landmarks showed very small mean differences for the two separate assessments (ranging from 0.01 to 0.13 mm for Me, and from 0.01 to 0.11 mm for the GT). However, Me showed a greater SD (range, 0.61–0.82 mm) than did the GT (range, 0.26–0.45 mm), i.e., compared to the GT, Me showed slightly less intra- and inter-examiner reliability. Me showed a maximum error of 1.76 mm at the 95% limit, whereas the GT showed a maximum error of 0.96 mm at the 95% limit.
DISCUSSION
CBCT is known to overcome the possible inherent errors of conventional two-dimensional (2D) radiography, such as magnification error, image distortion, and the superimposition of structures.22 Gribel et al.8 reported no significant differences (mean difference, 0.1 mm) between CBCT measurements and direct craniometric measurements. Despite the high accuracy of 3D CBCT images, identifying landmarks located on flat or broad surfaces is sometimes difficult. For example, van Vlijmen et al.11 compared the intra-observer reliability for 2D PA cephalograms and 3D-reconstructed CBCT images and found that the angular measurements, including the location of the Me, had significantly lower reliability values on CBCT images than on conventional 2D radiographs.
However, many researchers and clinicians have used Me for the evaluation of mandibular asymmetry on CBCT images,1314151723 even though some studies, including the above-mentioned study, reported lower reliability of identification of the Me on 3D CT or CBCT images than on 2D radiographs.1011 This may be because most orthodontists are accustomed to conventional landmarks, such as Me, which have been used for more than half a century in 2D cephalometric analysis. However, the 3D definition of the conventional landmarks and their reliability should be confirmed for use in 3D CBCT images. In the present study, Me showed excellent reliability in terms of the ICC values. However, even though the intra-examiner differences (1.76 mm for examiner A and 1.20 mm for examiner B; ± 95% limit) may be clinically insignificant, the small difference may result in erroneous diagnosis and treatment planning. According to the study by Kragskov et al.10 who evaluated the intra- and inter-individual reliability of identification of Me on 3D CT images, the average intra-individual variation in the location of Me was more than 2.0 mm on 3D CT images, which was greater than that on conventional PA cephalograms (1.0 mm).
Williams and Richtsmeier24 categorized landmarks as “fuzzy,” “constructed,”or “biological” depending on their characteristics, and concluded that biological landmarks (i.e., foramina, bony processes, and muscle insertions) were less subjective than the other landmarks and, therefore, more appropriate for 3D CT. However, they categorized the Pog and Me as fuzzy landmarks, i.e., the definition of the landmark was larger than a single point. Therefore, the larger intra- and inter-examiner differences in the identification of Me in our study could have been caused by the peculiar characteristics of this landmark. Swennen et al.17 introduced step-by-step guidelines for more accurate landmark identification in 3D CBCT. According to their guidelines, in the first step, Me is defined as the most inferior point of the chin on the virtual lateral cephalogram; then, the position of Me is verified on the right and left profile views; and finally, it is verified on the base view of the 3D hard-tissue surface representation. Fuyamada et al.25 also suggested that strict definitions on each of the three sectional images—initially on the sagittal plane, secondarily on the axial plane, and finally on the coronal plane—are required for ensuring sufficient reliability in landmark identification. In the present study, we also used all three sectional images (in the midsagittal, horizontal, and coronal planes) and the 3D surface-rendered images for accurate landmark localization. However, the verification of Me in the horizontal and coronal planes was not easy in some patients with mandibular asymmetry, in whom the most inferior point of the chin was not located in the midsagittal plane.
All human have a fibrocartilaginous symphysis between the two mandibles in which lateral growth occurs during early development.26 Therefore, mandibular symphysis can be considered embryologically as midline of the mandible. However, it is mostly impossible to determine the symphysis because it fuses at an early age.16 Therefore, we paid attention to the genial tubercle (mental spine) which locates on the mandibular symphysis. The genial tubercle provides attachment for the genioglossus and the geniohyoid muscles. In this sense, the GT can be categorized as a “biological” landmark. According to the study by Wang et al.27 on the dimensions of the genial tubercle on CBCT images, the vertical height of the genial tubercle from the superior margin to the inferior margin was approximately 7.3 mm and 6.5 mm in adult male patients with Class I and Class II skeletal types, respectively, and 7.9 mm and 6.7 mm in female patients with Class I and Class II skeletal types, respectively. The mean transverse width of the genial tubercle ranged from 7.1 mm to 8.2 mm in their sample groups. Moreover, this landmark lies on a sharp projection, making it easier to identify than other points located on broad curves. Therefore, identifying the GT on CBCT images is not difficult. Hueman et al.28 also confirmed the accuracy of CBCT in determining the location of the GT in their study using 17 adult human cadavers. Figure 4 shows the genial tubercle observed in 39-year-old female who had Class I malocclusion and no facial asymmetry. The size of genial tubercle was 2.7 mm in height and 6.0 mm in vertical width, and located at 9.5 mm from the mandibular border and 30.0 mm from the lower incisor tip, and was coincident with the facial midline.
Our results also showed that the GT was as reliable a landmark as Me for the assessment of the midpoint of the mandible (Table 3). In a previous study, Major et al.29 evaluated the reliability of Me and GT, together with 50 other landmarks, on PA cephalometric radiographs. Their study showed that the intra- and inter-examiner reliability, represented by the SD, was 0.66 mm and 0.96 mm, respectively, for Me and 0.64 mm and 0.84 mm, respectively, for the GT. The reliability of Me in the present study using 3D CBCT (SD range, 0.61–0.82 mm) was not great compared with the results of Major et al.29 However, the reliability of the GT in the present study (SD range, 0.26–0.49 mm) was greater than that of the results reported by Major et al.,29 suggesting that the identification of the GT on 3D CBCT images is not difficult, unlike that on 2D PA cephalometric radiographs.
With regard to the sample sizes for the ICC analysis, Bonett30 reported that the optimal sample size for two ratings was 15 for ICC = 0.9, significance level (alpha) = 0.05, and width of confidence interval = 0.2. Therefore, our sample size of 20 was considered adequate for this study. The sharp point of the genial tubercles and absence of overlapping structures on CBCT images might enable better landmark identification. In some patients, however, two or four tubercles were identifiable on CBCT images. In such cases, we marked the midpoint between the two or four tubercles as the GT; however, this may be an inherent limitation of this landmark. Therefore, additional studies should be conducted to compare the GT with Me in patients with symmetric mandibles. The GT should also be studied from the points of view of muscle physiology and embryology.


 XML Download