

 PDF
PDF ePub
ePub Citation
 Print
Print


INTRODUCTION
A smile is a facial expression formed by flexing the muscles near both ends of the mouth and is used to express enjoyment, appreciation, and concurrence.1 A smile can provide a basis for social interactions and can also influence a person's mating success, kinship opportunities, personality evaluations, performance, and employment prospects.2,3 Because of the influence of the smile on the perceived attractiveness of an individual, a large number of patients seek the help of orthodontists to address esthetic concerns with their smiles.
There are 2 forms of smiles: the unposed smile and posed smile.4,5 An unposed smile is an involuntary response induced by joy or mirth. This type of smile is dynamic in the sense that it bursts forth and is not sustained.6 Moreover, an unposed smile is natural from the viewpoint of expressing an authentic human emotion.1,4-9
A posed smile, in contrast, is a voluntary expression that does not need to be elicited by or accompanied with an emotion. A facial photograph is an effective tool to analyze facial attractiveness.8,10 When a person is asked to pose for a photograph, the desired smile is voluntary, unstrained and static, yet natural.4,7 Thus, the posed smile is routinely used to assess facial and smile esthetic characteristics because of its reproducibility.6 Hulsey,7 Ackerman et al.6,8 and Rigsbee et al.4 agree that the posed smile has good reproducibility.
Most studies that used photographs of posed smiles employed objective or subjective evaluation systems. These systems mainly evaluated the following smile characteristics: smile arc,3,6-8,10,11 buccal corridor,5-8,11 interlabial gap,12-14 intercommissure width,6-8 smile index (width/height),6,8,13 smile symmetry,7,11 upper incisor exposure, and upper lip position.4,12,14 Some of these studies classified smiles based on upper incisor exposure and upper lip position during smiling into the following three categories: "low smile" (in which less than 75% of the clinical crown height of the maxillary anterior teeth is revealed), "average smile" (in which 75 - 100% of the maxillary anterior crown height and the interproximal gingival are revealed), and "high smile" (in which a band of contiguous maxillary gingival is exposed).1,4,11 Tjan et al.1 and Dong et al.11 reported that the average smile is the most common among adults while Tjan et al.1 and Rigsbee et al.4 studied the gender-related differences in upper incisor exposure at smiling and reported that female subjects showed high smiles more frequently than male subjects. Furthermore, Vig and Brundo15 reported that the upper incisor exposure tends to decrease with age, however, this study was conducted without the patients smiling. There were few studies found which examine the skeletal, dental, and soft-tissue variables that metrically describe the vertical relativity between the lips, upper jaw, and teeth while smiling. Peck et al.12 noted that the high smile is related to vertical maxillary excess, the muscular ability to raise the upper lip, greater overjet, greater overbite, and greater interlabial gap at rest. However, there was little research found regarding the degree of and the variables associated with maxillary incisor exposure while smiling, especially in Korean subjects.
Thus, the objectives of this study were to evaluate the relationship between various measurements and upper incisor exposure while smiling through examination of frontal facial photographs and lateral cephalograms of posed smiles. More specifically, the goals of this study were as follows: (1) to compare the gender-related frequency distributions of the three smile types - high smile, average smile, and low smile - which were classified on the basis of the upper incisor exposure rates (UIERs) in Korean young adults; (2) to evaluate the differences in the skeletal, dental, and soft tissue measurements among the three groups; and (3) to investigate the correlation between various factors and the UIERs while smiling.
MATERIALS AND METHODS
Sample selection
Samples were obtained from 127 students (64 male and 63 female students) at the College of Dentistry, Wonkwang University, in South Korea. The average age of the subjects in this study was 25.23 ± 2.01 years (males, 25.02 ± 2.87 years; females, 24.96 ± 2.25 years). The institutional review board at the Dental Hospital of Wonkwang University approved this study (WKDIRB 201103-01).
Data collection
To achieve a natural posed smile, a smiling practice session was held, and one examiner used a digital caliper to obtain the actual measurements. At rest position, the subjects were instructed to hold their upper and lower teeth slightly apart while their lips were touching lightly To reduce examiner errors, the measurements were obtained three times and the average of the three values was recorded. In addition, frontal posed smile photographs and lateral cephalograms of the subjects were taken for the measurement procedures. The frontal posed smile photographs were taken using a 35-mm camera (D80; Nikon, Tokyo, Japan) with a 90-mm lens and a tripod. The subjects sat on chairs, ensuring that their Frankfurt horizontal planes were parallel to the floor, which allowed us to obtain standardized frontal posed smile photographs of each subject. The camera lens was centered on the midsagittal plane of the subject, and the distance between the labial surface of the upper incisors and the film was set at 160 cm. To reduce errors, the photographs were taken when the same lip appearance was repeated at least three times. Next, lateral cephalograms were obtained while the subjects held their teeth in centric occlusion using a ProMax with Dimax3 machine (Planmeca, Helsinki, Finland).
Measurements
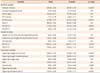
The clinically measured values in this study were the central incisor exposure length (while smiling), the central incisor clinical crown length, the upper lip length at rest, and the upper lip length during smiling (Table 1).
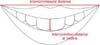
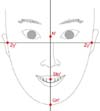
Measurements from the facial photographs were recorded in the form of the modified smile index (MSI) (Figure 1). The MSI, as suggested by Krishnan et al.,13 is a percentage of the inverse value of the smile index. From the facial photograph measurements, we also calculated the facial index, as suggested by Farkas et al.16 and Proffit et al.9 The facial index is a ratio of the facial width to the facial height and these measurements are shown in Figure 2.
Sample classification
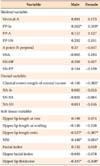
The UIER was calculated as the percentage of the exposed upper central incisor length and the exposed gingival length upon smiling to the upper right central incisor clinical crown length.1,4,11 The standards for dividing the subjects into the respective three groups using UIER values were as follows:
Statistical analyses
In order to determine intra-examiner errors, 15 samples were randomly selected and remeasured by the same examiner. The casual error was calculated according to Dahlberg's formula.17 The casual error ranged from 0.35 to 1.36, and no variable showed statistically significant systemic errors.
To compare group distribution differences by gender, the χ2 test was used. Independent t-tests were used to compare the measurements between male and female subjects, and these results were analyzed for significance using analysis of variance (ANOVA) and Duncan multiple range tests to compare the measurements between groups. Spearman correlation coefficients were calculated to evaluate the associations between the variables and UIER values. Results were considered statically significant at p < 0.05. These results were analyzed for significance using the PASW Statistics computer program (version 18.0; IBM Co., Armonk, NY, USA).
RESULTS
Frequency distribution of the three groups by gender
There were significant differences in the group distributions between male and female subjects (p < 0.05). Most of the male subjects were classified into group 1 (42.2%), with only 13% falling into group 3. In contrast, most of the female subjects met the criteria for group 3 (44.4%) while only 15% were classified into group 2 (Table 2).
Comparison of measurements between male and female subjects
Skeletal variables
The males had greater vertical-A and PP-U6 values than the females, with statistically significant differences (p < 0.05). The female group had statistically significantly larger SN-OP values than the male group (p < 0.05), with the SN-PP values also demonstrating a similar pattern with a statistically significant difference (p < 0.05) (Table 3).
Dental variables
The males had greater central incisor clinical crown lengths, SN-U1 and NA-U1, than the females, and the differences between the two groups were statistically significant (p < 0.05) (Table 3).
Soft tissue variables
The male group had greater upper lip lengths at rest, upper lip lengths at smiling, facial indices, and upper lip thicknesses than the female group, and these differences were statistically significant (p < 0.05) (Table 3).
Comparison of the measurements among the three groups
Skeletal variables
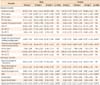
In both the male and female subjects, the PP-Is values showed statistically significant differences among the three groups (p < 0.05), with the values for groups 2 and 3 being greater than those of group 1 (Table 4).
Dental variables
In both the male and female subjects, the central incisor exposure heights during smiling were significantly different among the three groups (p < 0.05), and increased in the order of group 1, group 2, followed by group 3. In the female subjects, the central incisor clinical crown lengths significantly differed among the three groups (p < 0.05), with the values for groups 1 and 2 being greater than those of group 3 (Table 4).
Soft tissue variables
In both the male and female subjects, the upper lip length ratio showed statistically significant differences among the three groups (p < 0.05), and the values for group 1 were greater than those for groups 2 and 3. The MSI showed statistically significant differences among the three groups (p < 0.05) as well, with the values for groups 2 and 3 being greater than those of group 1. Furthermore, the upper lip thickness values also showed statistically significant differences among the three groups (p < 0.05), where the values for group 1 were greater than those of groups 2 and 3 (Table 4).
Correlation analysis
In both the male and female subjects, the PP-Is and MSI showed a positive correlation with the UIER (p < 0.05). On the other hand, the upper lip length ratio and upper lip thickness both showed a negative correlation with the UIER (p < 0.05). In female subjects, the central incisor clinical crown lengths showed a statistically significant negative correlation with the UIER (p < 0.05) (Table 5).
DISCUSSION
Facial photographs are effective in providing a valid method to analyze facial attractiveness.8,10 However, it is difficult to repeat the same exact posed smile during a single photography session, much less over a longer period of time. When several consecutive smile photographs are taken at an orthodontic visit, a clinician will often note variations in the smiles. Therefore, digital videography, which can complement the disadvantages of facial photography, is an option for recording posed smiles for diagnostic purposes and developing treatment plans for orthodontic and orthognathic surgical treatment.18 Schabel et al.10 insisted that clinical photography and digital videography do not show any significant differences in the analysis of smiles; however, because obtaining data using clinical photography is more convenient, it is more useful than digital videography for dental examinations. Thus, this study used clinical photography to record facial images of smiling subjects.
According to the study by Dong et al.,11 which examined 240 Korean subjects in their 20s, 56% of subjects had average smiles, while fewer subjects had high smiles (29%) and low smiles (15%). In our study with 127 Korean subjects in their 20s, the subjects were classified into three groups using the same methods as those employed in advanced research (classifying the subjects into three groups by the UIERs upon smiling), and found that low smiles were the most frequent (37%), followed by high smiles (32.3%) and average smiles (30.7%). These results revealed that the distribution of the three groups was similar and that there was a difference between the results of this study and the advanced study, as the percentage of low smiles was highest in our study. These differences may be attributed to the differences in the type of smiles measured in the two studies. This study used posed smiles to record and measure the smile types, while the previously mentioned studies classified the subjects into the three groups on the basis of the UIERs while the subjects posed with full smiles; in other words, the unposed smile was the standard.
Peck et al.12,14 analyzed the upper lip-tooth-jaw relativity in the vertical dimension quantitatively and studied the correlations among the exposure rates of the upper incisor and gingiva upon smiling with other variables. According to their study, which recorded full smiles, a significant gender dimorphism was found in the vertical lip-tooth-jaw relationship. When classifying the subjects into high smiles and low smiles, as well as by the exposure rate of the upper incisor and gingiva upon smiling, the high smiles showed higher frequencies in female subjects than in males, and male subjects showed higher frequencies of low smiles. Many other advanced research studies have shown similar results.1,6,8,11 In this study, we found significant differences in the frequency distributions between the male and female subjects within the three smile groups (Table 2).
In the current study, we studied the differences in skeletal, dental, and soft tissue variables between male and female subjects and our results indicate that the male subjects had significantly higher vertical-A and facial index (height/width) values than the female subjects (Table 3). Devised by Farkas et al,16 the facial index shows if the horizontal tendency or the vertical tendency of the face is the dominant factor by determining the ratio of the facial height to the facial width. The greater vertical facial heights in male subjects could possibly be attributed to the fact that the aforementioned variables were significantly greater in male subjects.
However, according to our study results, the above-mentioned variables did not demonstrate significant differences among the three groups, classified by UIER, and also did not show significant correlations with the UIER (Tables 4 and 5). The clinical crown length of the central incisor was higher in male subjects (Table 3) and this finding was similar to results reported in other studies.1,4,7,11 In this study, we compared the differences in these variables among the three groups and did not find any significant differences in male subjects; however, in female subjects, these variables had negative correlations with the UIER (Tables 4 and 5). In other words, in female subjects, the central incisor clinical crown length is inversely correlated with the UIER while smiling, but this correlation was not detected in male subjects.
The PP-Is is a skeletal variable that represents the vertical distance between the palatal plane and the incisal line of the upper central incisor, i.e., the anterior height of the maxilla. This variable showed a significant difference among the three groups in both male and female subjects and showed a positive correlation with the UIER (Tables 4 and 5). This result is similar to results described by Peck et al.12,14 In contrast, PP-U6, which is the vertical distance between the palatal plane and the distal cusp tip of the maxillary first molar, i.e., the posterior height of the maxilla, did not show any significant differences among the three groups or any correlation with the UIER (Tables 4 and 5). These results imply that an increase in the UIER is not related to an increase in the maxillary posterior height, but to an increase in the maxillary anterior height.
In this study, the NA-Is, SN-U1, and NA-U1 did not show any significant differences or correlations with the UIER among the three groups (Tables 4 and 5). These variables express the inclination of the upper incisor axis. Therefore, the inclination of the upper incisor did not have any influence on the UIER. This result differs from that of other advanced research, which showed that the exposure of the upper incisor during smiling increased with the labial inclination of the upper incisor.12,19 Moreover, in this study, the A point - N perpendicular and SNA were measured as skeletal variables, but these variables did not show any significant results. Therefore, the antero-posterior factor also did not have any significant correlation with the UIER, skeletally.
As mentioned before, although gender differences in the upper lip lengths at rest have been reported in advanced research, no significant differences were reported in the upper lip lengths at rest among the three groups, which were classified into high smile and low smile types on the basis of UIER and gingiva at smiling. This result coincides with the conclusion of this study (Table 4). Moreover, in this study, the lip length at rest and the UIER did not show any significant correlation (Table 5). In conclusion, according to the results of this study and other advanced researches, the upper lip length at rest is not a factor that can influence the UIER while smiling.
By comparing the variables between male and female subjects, the upper lip thickness showed a significant difference and was greater in male subjects (Table 3). This study used the distance between the skeletal A point and soft tissue A point to measure lip thickness, a method used in the study by Mamandras.20 This variable also showed a significant difference among the three groups and had a negative correlation (Tables 4 and 5). Thus, a thicker upper lip means less upward movement of the upper lip while smiling and leads to a decrease in the UIER.
According to Peck et al.,14 the upper lips of female subjects were positioned, on average, 1.5 mm more superiorly during maximum smiles when compared to male subjects. There was also a significant sex difference in upper lip length at rest; male subjects had longer upper lips than female subjects. These results are in accordance with the results of our study (Table 3).
Although the resting upper lip length did not have a significant correlation with the UIER, there was a significant difference in the upper lip length ratio among the three groups, and the upper lip length ratio was negatively correlated with the UIER (Tables 4 and 5). As suggested by Krishnan et al.,13 the MSI is the percentage of the ratio of the interlabial gap (the distance between the inferior border of the upper lip and the superior border of the lower lip, while smiling, measured on the midsagittal plane) to the intercommissural distance (the distance between the labial commissures). This is a percentage of the reciprocal value of the smile index, as suggested by Ackerman and Ackerman.8
The MSI also showed significant differences among the three groups and had a positive correlation with the UIER (Tables 4 and 5). The above-mentioned result of this study was similar to the result of advanced researches.12-14 With these results, we can assume that the levator muscle activity of the upper lip has a more positive correlation with the UIER than that of the activity of the muscles that move the labial commissures laterally. Therefore, many researchers have recommended muscle exercises and smile practice for the activity of levator muscle of the upper lip.11 We inferred that the lower the upper lip length ratio and the greater the MSI are, the greater the levator muscle activity of the upper lip and the greater the UIER.
In this study, we analyzed smile-related data and obtained results related to the UIER at smiling and the skeletal, dental, and soft tissue variables. More studies with larger samples are needed in the future, and changes caused by age and orthodontic treatment history should be taken into consideration as well.
CONCLUSION
From this study, the following inferences can be made:
Males had higher frequencies of low smiles, while females had higher frequencies of high smiles.
The height of the maxillary dentoalveolar bone was directly proportional to the UIER.
The upper lip length ratio was directly proportional to the UIER while the upper lip thickness was inversely proportional to the UIER.


 XML Download