

 PDF
PDF Citation
 Print
Print


INTRODUCTION
Cervical cancer is a common gynecological cancer and a serious threat to the health of women. In 2018, there were 560,000 new cases, and the mortality rate nearly reached 3.3% of that of all cancers [1]. The inhibition of the malignant proliferation of tumor cells and the induction of their apoptosis are important approaches for the treatment of cancer. Previous studies have shown that apoptosis is associated with attenuation of tumor expansion and distant invasion. In addition, escape and dysregulation of apoptosis not only promote tumorigenesis but might also result in resistance to cancer treatments [23]. Pseudolaric acid B (PAB) is a biologically active diterpenoid isolated from Tujingpi (the bark of Pseudolarix kaempferi) and has been shown to have broad anticancer and anti-angiogenic effects [4]. Tujingpi is used in Chinese folk medicine to treat fungal infections. Wong et al. [5] have reported that PAB is cytotoxic to multidrug-resistant tumor cell lines, such as breast and liver cancer line in 2005. The in vivo antitumor activity of PAB has been tested by treating mice with various concentrations of PAB (10, 15, 25, and 0.1 mg/kg) [5]; the mice showed no signs of poisoning or weight loss. Moreover, the results indicated that PAB selectively inhibited cancer cell proliferation, with minimal effect on normal tissue cells [5]. The mechanism of PAB induced apoptosis involves the disruption of cell microtubule formation, and cell cycle arrest at the G2-M transition [6]. PAB induces tumor cell apoptosis and effectively attenuates the resistance of tumor cells to chemotherapy by activating caspases through multiple pathways [57]. However, little is currently known about how PAB causes caspase-dependent apoptosis in tumor cells.
Paired Box 2 (PAX2) is a member of the PAX family of transcription factors. The PAX transcription factor family has a paired structural domain, and the protein sequences of its members are highly homologous and conserved. PAX genes are widely involved in embryonic development, organogenesis, cell proliferation, differentiation, and apoptosis, and their expression levels gradually decrease after tissue development [8]. PAX2 has long been thought to function at specific stages during embryonic development and is almost completely silenced in adults. In recent years, there has been increasing evidence that PAX2 is reactivated in a variety of tumor tissues, exhibiting carcinogenicity and promoting the proliferation, survival and migration of cancer cells [9]. This suggests the importance of investigating the role and potential molecular mechanisms of PAX2 in carcinogenesis.
Wnt is a group of cysteine-rich secreted glycoproteins that play key roles in maintaining embryonic development, tissue homeostasis, and malignancies [10]. In cervical cancer cells, abnormal activation of Wnt signaling promotes the growth and invasion of cancer cells. Genetic and other factors can cause mutations in Wnt ligands and activate this signaling pathway [11]. Studies have shown that Wnt4, Wnt8A, Wnt10B and Wnt14 are relatively highly expressed in various cervical cancer cell lines, while Wnt7A is strongly downregulated in the same cells [1213]. High expression of the downstream molecule, DV1-1, in the Wnt pathway Dvl-1 is also observed in cervical cancer cell lines, and high methylation is found in the promoters of Axin and APC, 2 other components of the Wnt pathway [1415]. Inhibition of the Wnt signaling has been found to impair the proliferation of cervical cancer cells and promote their apoptosis to varying degrees [16].
In this study, we analysed the effects of PAB on the apoptosis of a variety of HeLa cells. At the same time, we investigated the inhibitory effect of PAB on PAX2 and found that PAX2 negatively regulates the gene BAX, which triggers apoptosis via the mitochondrial pathway. Finally, we found that PAB significantly inhibits the Wnt signaling and inhibits PAX2 expression through this pathway, subsequently inducing apoptosis in HeLa cells. Our results deepened our understanding of the molecular mechanism of PAB effect on cervical cancer.
MATERIALS AND METHODS
1. Cell culture
The HeLa, SiHa, CasKi, C33A, and MS751 human cervical cancer cell lines were purchased from the Cell Bank of Type Culture Collection of the Chinese Academy of Sciences (Shanghai, China). C33A, HeLa, and SiHa cells were cultured in Dulbecco's Modified Eagle's Medium (Gibco, Carlsbad, CA, USA) and MS751 and CaSki cells were cultured in RPMI 1640 (Gibco); 10% Fetal Bovine Serum (Gibco) and 1% penicillin and streptomycin (Sigma, St. Louis, MO, USA) were added to the media. All cells were cultured at 37°C in humidified air containing 5% CO2. Adenoviral vectors overexpressing PAX2 and BAX (Ad-PAX2, Ad-BAX) were purchased from Shanghai R&S Biotechnology Co., Ltd. (Shanghai, China). Adenoviral infection was performed at a multiplicity of infection of 4. After 48 hours, green fluorescent protein expression was detected by fluorescence microscopy (Olympus IX73; Olympus, Tokyo, Japan) to ensure that viral infection efficiency was over 90%.
2. Three-(4,5-dimethylthiazol-2-yl)-2,5-diphenyltetrazolium bromide (MTT) assays
MTT assays were performed to assess the viability of HeLa, SiHa, CasKi, C33A, and MS751 cells. Cells were treated with increasing concentrations of PAB (2.5, 5, 10, 20, and 40 μM) or 0.16% dimethyl sulfoxide (DMSO), followed by incubation at 37°C. The assays were conducted using an MTT assay kit (Beyotime, Shanghai, China) according to the manufacturer's recommendations. Briefly, fresh MTT was added and the cells were cultured for additional 4 hours in an incubator. The formazan crystals were then dissolved, and the absorbance was measured at a wavelength of 570 nm using a microplate reader (Thermo Scientific Multiskan MK3; Thermo Fisher Scientific, Shanghai, China).
3. Apoptosis assessment
HeLa cells were treated with PAB (2.5, 5, 10, 20, and 40 μM) or 0.16% DMSO for 24 hours. An annexin V-fluorescein isothiocyanate (FITC)/propidium iodide (PI) double staining assay kit (Beyotime) was used to analyse the number of early and late apoptotic cells. The cells (1×10⁶) were collected and washed three times with phosphate-buffered saline buffer at 37°C. Samples were suspended in binding buffer containing 5 μL of annexin V and 5 μL of PI. The cells were incubated for 15 minutes at 37°C in the dark, and then quantitative analysis of annexin V-FITC-positive and PI-positive cells was performed by flow cytometry (BD Biosciences, San Jose, CA, USA).
Alternatively, HeLa cells were treated with different concentrations of PAB (2.5, 5, 10, 20, and 40 μM) or 0.16% DMSO for 48 hours. Hoechst 33258 (Beyotime) was used to stain the nuclei of HeLa cells, and nuclear morphology was observed using a fluorescence microscope (Olympus IX73, Tokyo, Japan) at an excitation wavelength of 350 nm.
4. Dual luciferase reporter assays
The −903/+260 bp fragment of the BAX promoter was cloned into the pGL3-Basic luciferase expression vector (Takara, Dalian, China). The fusion plasmid (pGL3-BAX) was used as a template to generate a reporter plasmid with the mutated BAX promoter using an inducible mutation kit (Invitrogen, Carlsbad, CA, USA). The BAX reporters (wild type or mutated) and pRL-TK (control reporter, expressing Renilla luciferase) plasmids were transiently transfected into HEK293T cells using the XtremeGENE HP DNA Transfection Reagent (Roche, Basel, Switzerland); the cells were then infected with Ad-PAX2. After 48 hours, the Dual-Luciferase Reporter System (Promega, Fitchburg, WI, USA) was used to measure luciferase activity on a luminometer (Lumat LB 9507; EG&G Berthold, Bad Wildbad, Germany), according to the manufacturer's recommendations.
5. TOPflash-luc activity assays
HeLa cells were seeded in 24-well plates at a density of 2×10⁵ and transiently co-transfected with 750 ng of TOPflash reporter plasmid or 750 ng of FOPflash reporter plasmid with 50 ng TK-Renilla plasmid (for a total of 800 ng) using the XtremeGENE HP DNA Transfection Reagent. After 48 hours, the Dual-Luciferase Reporter System was used to measure luciferase activity on a luminometer. All experiments were performed in triplicate and performed at least 3 times.
6. Chromatin immunoprecipitation (ChIP) assays
Approximately 1×10⁷ cells per sample were collected and used for DNA extraction. HeLa cells were fixed with 1% paraformaldehyde for 15 minutes at room temperature. Next, glycine 0.125 M was added to terminate the cross-linking reaction. Cells were harvested and centrifuged at 1,000 ×g for 5 minutes at 4°C. Immunoglobulin G and anti-HA were used to immunoprecipitate the nuclear chromatin. The specific primers 5′-CCT CCA TAC CCT GCT GAT CTA TCA G-3′ (forward) and 5′-GTT CGT GAC TCC CCG TCT TTG A-3′ (reverse) were used to amplify the −869/+250 bp region on BAX promoter [17].
7. Measurement of cytochrome C release from mitochondria
The mitochondria and the cytosol were separated using a Cytochrome C Releasing Apoptosis Assay kit (Beyotime). Cells were suspended in cytosol extraction buffer and, following a 10 minutes incubation on ice, they were homogenised using a Dounce homogenizer (GlobalSpec, East Greenbush, NY, USA) and centrifuged at 800 g for 10 minutes. Subsequently, the collected supernatant was re-centrifuged at 10,000 g for 30 minutes. The resulting supernatant (cytosolic fraction) and the pellet (mitochondrial fraction) were processed for western blot analysis.
8. Quantitative reverse transcription polymerase chain reaction (PCR)
Cells were collected and total RNA was extracted using Trizol reagent and miRNeasy mini kit (Invitrogen). The cDNA was synthesised by reverse transcription using SuperScript II (Invitrogen). Quantitative PCR was performed in 20ul reaction system containing specific primers, cDNA and SYBR Premix EX Taq (Takara). Primer information is as follows: caspase-3 forward: 5′-ATG GAG AAC AAC AAA ACC TCA GT-3′, reverse: 5′-TTG CTC CCA TGT ATG GTC TTT AC-3′; caspase-9 forward: 5′-TCC TGG TAC ATC GAG ACC TTG-3′, reverse: 5′-AAG TCC CTT TCG CAG AAA CAG-3′; B-cell lymphoma/leukemia-2(Bcl-2) forward: 5′-GTC GCT ACC GTC GTG ACT TC-3′, reverse: 5′-CAG ACA TGC ACC TAC CCA GC-3′; BAX forward: 5′-TGA AGA CAG GGG CCT TTT TG-3′, reverse: 5′-AAT TCG CCG GAG ACA CTC G-3′; Apaf-1 forward: 5′-AAG GTG GAG TAC CAC AGA GG-3′, reverse: 5′-TCC ATG TAT GGT GAC CCA TCC-3′; cytochrome (CytC) forward: 5′-CTT TGG GCG GAA GAC AGG TC-3′, reverse: 5′-TTA TTG GCG GCT GTG TAA GAG-3′; PAX2 forward: 5′-TGT CAG CAA AAT CCT GGG CAG-3′, reverse: 5′-GTC GGG TTC TGT CGT TTG TAT T-3′; Gene expression levels were normalised to those of glyceraldehyde 3-phosphate dehydrogenase (GAPDH) followed by analysis using the 2−∆∆Ct method.
9. Western blotting analysis
Protein samples were collected from cell lysates and protein concentrations were determined using a BCA kit (Beyotime). Proteins were separated by 10% or 12% sodium dodecyl sulfate-polyacrylamide gel electrophoresis electrophoresis and transferred to a nitrocellulose membrane. The membrane was blocked with 5% Tris-buffered saline with Tween 20 for 2 hours at room temperature and then incubated with primary antibody overnight at 4°C. The primary antibodies were: anti-caspase-3, anti-cleaved caspase-3, anti-caspase-9, anti-cleaved caspase-9, anti-BAX, anti-Bcl-2, anti-CytC, anti-Apaf-1, anti-COX IV, anti-PAX2, anti-GSK-3β, anti-pGSK-3β(Ser9), anti-β-catenin, anti-p-β-catenin(Ser33+Ser37), anti-Wnt2, anti-Wnt4, anti-Wnt5a, anti-Wnt10b, anti-Wnt11, anti-Wnt13, anti-Wnt14 (Abcam, Cambridge, UK), anti-GAPDH, and anti-β-actin (Cell Signaling Technology, Danvers, MA, USA). Films were cleaned 3 times with TBST and incubated with the corresponding horseradish peroxidase-conjugated secondary antibody for 1 hour. Membranes were visualised using the enhanced chemiluminescence reagents (Millipore, Burlington, MA, USA), and then the blots were quantified using ChemiDoc XRS system (Bio-Rad, Hercules, CA, USA).
10. Statistical analysis
Statistical analyses were conducted by SAS v8.0 (SAS Institute, Cary, NC, USA). Data were analysed using either 1- or 2-way analysis of variance depending on the number of variables. Comparisons among individual means were made by Fisher's least significant difference (LSD). Data are presented as mean ± standard error of the mean. The p<0.05 was considered to be significant.
RESULTS
1. PAB negatively affects the survival of cervical cancer cells in a time- and concentration-dependent manner
To investigate the effect of PAB on cervical cancer cells, we first investigated whether it affects cell survival. For this purpose, we treated HeLa, SiHa, CasKi, C33A, and MS751 cells with increasing concentrations of PAB. MTT assays were performed to assess cell survival over time (12, 24, and 72 houes). We found that PAB negatively affected the survival of cervical cancer cell lines as compared with survival in the control group (untreated) in a time- and concentration-dependent manner (Fig. 1A-E). By comparing the p value under the condition of 40 µM PAB treatment for 72 hours, we found that the differences in the results obtained for the different cell lines were not statistically significant. Based on this, we chose only one cell line, HeLa, for subsequent experiments to avoid unnecessary experimental work and to keep the study focused (Fig. 1F).
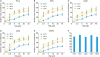 | Fig. 1PAB inhibits the survival of cervical cancer cells in a time- and concentration-dependent manner. Five different cervical cancer cell lines (HeLa, SiHa, Caski, C33A, and MS751) were treated with different concentrations of PAB (0, 2.5, 5.0, 10, 20, 40 μM) for 24, 48, and 72 hours. The MTT assay was used to measure the inhibitory effect of PAB on cell proliferation (n=3). Data are expressed as mean values ± standard deviation for 3 independent experiments.MTT, 3-(4,5-dimethylthiazol-2-yl)-2,5-diphenyltetrazolium bromide; PAB, pseudolaric acid B.
*p<0.05 was considered significant.
|
2. PAB increases the rate of apoptosis
Previous studies have shown that PAB negatively affects the survival of HeLa cells by inducing apoptosis [1819]. Therefore, we investigated whether the decreased survival of HeLa cells was due to apoptosis. Hoechst 33258 staining was used to detect the nuclear morphological changes induced by PAB in HeLa cells. As the PAB treatment concentration increased, cell nuclei became bright and shrank, exhibiting an irregular morphology typical of apoptosis. The number of apoptotic cells increased with the PAB concentration (Fig. 2A and B), and, at a PAB concentration of 40 μM, the nuclear disintegration and rupture were the most pronounced (Fig. 2A). We also measured PAB-induced apoptosis by annexin V/PI staining followed by flow cytometry. We found that PAB significantly increased the rate of early and late apoptotic cells, in a concentration-dependent manner (Fig. 2C and D). These results demonstrate that PAB promotes apoptosis in HeLa cells.
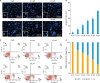 | Fig. 2PAB induces apoptosis in cervical cancer cells. HeLa cells were treated with different concentrations of PAB (0, 2.5, 5.0, 10, 20, 40 μM) for 24 hours. (A) Representative images of Hoechst 33258 staining of the nucleus (scale bar=200 μm; bottom left, scale bar=20 μm) (n=3). (B) The bar graphs represent the percentage of apoptotic cells in (A) (n=3, >30 fields per group were counted). (C, D) After AV/PI staining, percentage of cells in different apoptotic stages was analysed by flow cytometry (n=3). Data are expressed as mean values ± standard deviation for 3 independent experiments.AV, annexin V; FITC, fluorescein isothiocyanate; PAB, pseudolaric acid B; PI, propidium iodide.
*p<0.05 was considered significant.
|
3. PAB induces apoptosis through the mitochondrial pathway
The classical (intrinsic) pathway of apoptosis is the mitochondrial pathway. Apoptosis might also be activated through the extrinsic (Fas-mediated) pathway and endoplasmic reticulum stress (ERS)-induced caspase-12 activation. Based on the results reported above, we decided to perform subsequent experiments treating the cells with PAB for 24 hours. We found that PAB was unable to activate the Fas pathway and only slightly induced ERS (Fig. 3A and B).
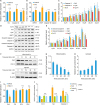 | Fig. 3PAB induces apoptosis in cervical cancer cell via the mitochondrial pathway. HeLa cells were treated with different concentrations of PAB (0, 2.5, 5.0, 10, 20, and 40 μM) for 24 hours to detect changes in mRNA expression levels and for 48 hours to detect changes in protein levels. (A) Relative expression levels of Fas, Caspase-8, and NIK mRNA in the Fas pathway (n=4). (B) Relative expression levels of caspase-3, CHOP, Caspase-12, and Calpain mRNA (n=4). (C) Relative expression levels of mitochondrial apoptosis-related gene mRNAs (n=4). (D-E) Relative expression levels of mitochondrial apoptosis-related proteins (n=4). (F-H) HeLa cells were subjected to mitochondrial and cytoplasmic separation, followed by measurement of CytC content in the mitochondria and cytosol (n=3). Values were normalised to β-actin in cytosol or COX IV in mitochondria. (I) Relative expression levels of Drp1, Fis1, Mfn1 and OPA1 mRNA (n=4). (J) Relative expression levels of BAX, Bcl-2 and Caspase-9 mRNA in cells treated with DMSO or Mdivi-1 (n=4). Data are expressed as mean values ± standard deviation.Bcl 2, B-cell lymphoma/leukemia-2; CHOP, C/EBP homologous protein; CytC, cytochrome; DMSO, dimethyl sulfoxide; Drp1, dynamin-related protein 1; Fis 1, fission protein 1; Mfn1, mitofusin 1; Mdivi-1, mitochondrial division inhibitor; NIK, NF-κB-inducing kinase; n.s., not significant; OPA 1, optic atrophy type 1; PAB, pseudolaric acid B.
*p<0.05 was considered significant.
|
The mRNA levels of Fas, caspase-8, NIK, GRP78, caspase-12, and calpain in the control group were not significantly different from those in the PAB groups, except for CHOP.
However, PAB increased the expression of mitochondrial apoptosis-related factors (caspase-3, caspase-9, BAX, CytC, and Apaf-1) and inhibited the expression of Bcl-2 in a concentration-dependent manner (Fig. 3C-E), This result is consistent with previous studies in prostate cancer and illustrates the potential of PAB for cancer treatment [20]. There were significant differences between the groups with different concentrations of PAB (p<0.05). In addition, PAB significantly enhanced the cleavage of caspase-3 and caspase-9, which indicates their activation (Fig. 3D). The protein expression level of cleaved caspase-3 and caspase-9 increased with increasing PAB concentration. Increased mitochondrial outer membrane permeability and release of cytochrome C into the cytosol are important markers of apoptosis [21]. Therefore, we examined CytC content in the cytosol and in isolated mitochondria. We found that PAB strongly induced the release of CytC from mitochondria into the cytosol (Fig. 3F-H). CytC content in mitochondria decreased gradually and that in the cytoplasm increased, with increasing time (p<0.05). Mdivi-1, a mitochondrial outer membrane permeabilisation inhibitor capable of crossing the cell membrane, was used to further investigate the effect of PAB on mitochondrial outer membrane permeability. The significantly decreased Drp1 expression levels validated Mdivi-1 treatment (p<0.05) (Fig. 3I). The expression of mitochondrial fission maker proteins Fis1, Mfn1 and OPA1, was not significantly different. Mdivi-1 significantly attenuated the increase in BAX and caspase-9 and the decrease in Bcl-2 induced by PAB (Fig. 3J). Taken together, these results indicate that PAB induces apoptosis in cervical cancer cells via the mitochondrial pathway.
4. PAB inhibits the expression of PAX2 and negatively regulates the transcription of BAX
Recent studies have found that the PAX family is abnormally activated in a variety of cancer cells and enhances cell viability [2223]. Therefore, we hypothesised that PAB may regulate the expression of PAX family genes in HeLa cells. To test this hypothesis, we measured the levels of PAX-related genes upon PAB treatment. We found that PAB inhibited the expression of PAX2 and PAX8 but had no significant effect on the expression of PAX3, PAX5, or PAX7 (Fig. 4A). Bouchard et al. [24] (2002) reported that Exon 3 of the PAX8 gene encoding the N-terminal part of the paired domain can bind to the transcription factors PAX2, PAX5, or PAX8. There is a dependency regarding the effect of PAX5 and PAX8 expression on PAX2 function [25]. This indicates that PAX2 and PAX8 are similar not only in function but also in structure, and the expression of PAX2 is always accompanied by the expression of PAX8. Some studies have indicated that both PAX8 and PAX2 are promising therapeutic targets for inhibiting serous cancer progression and pro-tumorigenicity and that PAX8 is ubiquitously expressed [26]. Our results are consistent with these previous observations. Whether PAX2 and PAX8 share similarities in their promoters and other aspects remains to be further studied.
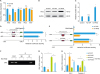 | Fig. 4PAX2 is inhibited by PAB and negatively regulates the expression of BAX. (A) Relative mRNA expression levels of the PAX family genes PAX2, PAX3, PAX5, PAX7, and PAX8 (n=4). (B, C) Efficiency of the adenoviral overexpression of PAX2 (n=4). (D) Dual luciferase reporter assay to investigate whether PAX2 binds to the BAX promoter: HEK293T were transfected with PGL3-basic (control), PGL3-BAX or PGL3-BAX-mutant plasmids (n=3). (E) Analysis of BAX promoter activity in HEK293T cells transfected with PGL3-basic (control), PGL3-BAX, or PGL3-BAX-mutant plasmids and infected with Ad-PAX2 (n=3). (F) Nuclear chromatin was collected from HeLa cells overexpressing PAX2, and subjected to ChIP assays using anti-HA or IgG antibodies. Another DNA input was collected as a positive control (n=3). (G, H) Relative mRNA expression levels of BAX, Bcl-2, and Caspase-3 with or without Ad-BAX (n=4). Data are expressed as mean values ± standard deviation.Bcl 2, B-cell lymphoma/leukemia-2; ChIP, chromatin immunoprecipitation; GFP, green fluorescent protein; IgG, immunoglobulin G; IP, immunoprecipitation; n.s., not significant; PAB, pseudolaric acid B; PAX2, paired box 2.
*p<0.05 was considered significant.
|
Because PAX is a transcription factor that regulates gene expression, we searched for genes that were regulated by PAB through PAX2 using online research tools (TRANSFAC and MatInspector). We found that the promoter of BAX contains a potential PAX2 binding site (−215/−207 bp from the transcription starting point). To investigate the molecular mechanism of PAX2 action in HeLa cells, we generated adenoviral vectors overexpressing PAX2 and measured their efficiency (Fig. 4B and C). We conducted luciferase reporter assays and found that PAX2 inhibited BAX promoter activity, while mutation of the putative PAX2 binding site on BAX significantly reduced the promoter activity (Fig. 4D). The ability of PAX2 to inhibit the activity of the BAX promoter was shown to be lost after overexpression of PAX2 (Fig. 4E). These results indicate that PAX2 binds to BAX and negatively regulates it transcriptionally. We validated these results in ChIP assays, which confirmed that PAX2 binds to BAX promoter (Fig. 4F). Furthermore, Ad-BAX significantly increased the expression of BAX, whereas Ad-PAX2 showed a strong inhibitory effect on BAX expression (Fig. 4G). In addition, PAX2 overexpression also inhibited the expression of caspase-3 and promoted the expression of Bcl-2 even upon BAX overexpression (Fig. 4H). Taken together, these data strongly suggest that PAX2 inhibits apoptosis in HeLa cells by negatively regulating BAX.
5. PAB-induced inhibition of apoptosis in HeLa cells is promoted by canonical Wnt signaling
Based on analysis of networks of interacting proteins by STRING, we found that PAX2 is closely related to Wnt signaling in cancer (Fig. 5A). We found that PAB significantly reduced the expression levels of Wnt2, Wnt10b, Wnt13, and Wnt14; notably, PAB did not alter the expression levels of Wnt4, Wnt5a, and Wnt11 (Fig. 5B and C). These data indicated that PAB inhibits canonical Wnt signaling rather than non-canonical Wnt signaling.
 | Fig. 5PAB inhibits canonical Wnt signaling and promotes apoptosis in cervical cancer cells. (A) The protein interaction network of PAX2 was analysed online using STRING. The blue node represents PAX2, the green nodes represent proteins that interact with PAX2 in cancer pathways, and the red nodes represent the Wnt protein molecules in cancer signaling. (B, C) Effect of PAB on the protein levels of canonical and non-canonical Wnt signaling-related molecules (n=3). (D) TOPFlash-luc activity assays upon PAB treatment in HeLa cells (n=4). (E, F) Relative phosphorylation levels of GSK-3β and β-catenin and relative protein expression levels of cleaved Caspase-3 and PAX2 after DMSO, tideglusib or IWP-O1 treatment (n=3). Data are expressed as mean values ± standard deviation.DMSO, dimethyl sulfoxide; GFP, green fluorescent protein; IgG, immunoglobulin G; IP, immunoprecipitation; GSK-3β, glycogen synthase kinase-3β; n.s., not significant; PAB, pseudolaric acid B; PAX2, paired box 2.
*p<0.05 was considered significant.
|
To verify this hypothesis, we performed luciferase assays using the TOPFlash-luc vector, a Wnt/β-catenin reporter, and found that PAB strongly inhibited the canonical Wnt signaling (Fig. 5D). GSK-3β, a cell apoptosis regulator, plays a critical role in the Wnt/ß-catenin signaling pathway. GSK-3β inhibitor can prevent the cleavage of caspase-3, and suppression of ß-catenin expression enhances the phosphorylation of GSK-3β [27]. To determine whether PAB exerts an effect on the GSK3 signaling pathway to inhibit apoptosis, IWP-O1, a specific inhibitor of Dvl2/3 phosphorylation, was used to block the Wnt/β-catenin signaling pathway. Conversely, tideglusib, an irreversible inhibitor of GSK-3β, was used to induce this pathway and promote β-catenin accumulation in cells.
As shown in Fig. 5E, PAB increased the expression of GSK-3β, thereby promoting β-catenin phosphorylation and subsequent activation of caspase-3, which triggered apoptosis. Similarly, PAB potently inhibited Wnt/β-catenin signaling under tideglusib treatment. Interestingly, during the blockade of Wnt/β-catenin signaling by IWP-O1, β-catenin inhibition by PAB was lost and attenuated PAB-induced apoptosis was attenuated. In addition, PAB-induced decreased expression of PAX2 was also attenuated after IWP-O1 treatment (Fig. 5E and F). These results indicate that PAB induces apoptosis in cervical cancer cells and inhibits the expression of PAX2 through the Wnt signaling.
DISCUSSION
Several studies have indicated that PAB is an active anti-cancer substance that inhibits angiogenesis and tumor growth, and regulates the immune response. PAB has been particularly extensively studied because it inhibits the growth of cancer cells. Additionally, PAB has been shown to strongly promote apoptosis in many types of cancer cells including liver cancer, lung cancer, breast cancer, melanoma, and rectal cancer cells [72829]. This process involves many signaling pathways and target molecules, including the PI3K/AKT (phosphatidylinositol-3 kinase/serine/threonine kinase) and ERK1/2(extracellular signal-regulated protein kinase1 and 2) signaling or molecules of the Bcl-2, PKC, and caspase families [303132]. In cervical cancer cells, it has been reported that PAB inhibits the AKT signaling and promotes apoptosis [33]. Additionally, activation of the ATM/p53 (ataxia telangiectasia-mutated/p53) pathway in HeLa cells by treatment with 1 μM PAB for 12 hours caused arrest in G2/M and triggered apoptosis [18]. Our study determined the time and concentration dependence of PAB effect in a variety of cervical cancer cells. We also investigated the possible apoptotic pathways activated by PAB and found that PAB induces apoptosis via the mitochondrial pathway by increasing mitochondrial outer membrane permeability, rather than via the Fas or ERS pathways.
The transcription factor PAX2 is considered to be essential for gonad formation [34]. PAX2 is highly expressed in kidney and gonad-related tumors compared to tumors in other sites [35]. The PAX2-positivity rates in patients with endometrial cancer and ovarian clear cell carcinoma are 40% and 42%, respectively [36]. The expression of PAX2 in cervical cancer cells is also greatly upregulated and inhibition of PAX2 by CP-31398 or direct RNA interference results in inhibition of proliferation, invasion, and migration of cervical cancer cells [37]. Therefore, PAX2 is considered to be a marker gene for the development of genital-related cancers. We found that PAB strongly inhibits PAX2 expression in cervical cancer cell. At the same time, we found that the promoter of the pro-apoptotic gene BAX contains a PAX2 binding site, and that PAX2 inhibits BAX expression. This suggests that downregulation of PAX2 plays an important role in PAB-induced apoptosis of cervical cancer through BAX. This is consistent with studies showing that PAX2 promotes cancer cell survival and enhances drug resistance [3738].
The Wnt/β-catenin signaling is highly correlated with proliferation and survival of cervical cancer cells [39]. Abnormally activated β-catenin transcription regulates the expression of various downstream factors related to cell cycle and survival, including cMYC, Cyclin D1, Survivin, Axin2, and matrix metalloproteinases [40]. After PAB treatment, Wnt2, Wnt10b, Wnt13, and Wnt14, which activate the canonical Wnt pathway, were broadly inhibited. We therefore further focused on the role of the Wnt/β-catenin signaling in PAB-induced apoptosis in cervical cancer cells. Using the Wnt/β-catenin signaling antagonist IWP-O1 or the agonist tideglusib, we demonstrated that PAB inhibits β-catenin accumulation within cells. Interestingly, we also found that PAB regulates the expression of PAX2 via Wnt/β-catenin signalling, though the molecular details of this mechanism remain to be further investigated.
In summary, our study demonstrates that PAB inhibits Wnt/β-catenin signaling and PAX2 expression in and induces apoptosis. Downregulation of PAX2 attenuates the inhibition of BAX expression, leading to accumulation of intracellular BAX and triggering apoptosis via the mitochondrial pathway. Therefore, this study deepens our understanding of PAB action and suggests that PAB is a potential therapeutic drug to induce apoptosis in cervical cancer cells.
 XML Download