

 PDF
PDF Citation
 Print
Print


INTRODUCTION
Ovarian granulosa cell tumors are a form of sex-cord stromal tumors that account for 1%–2% of all ovarian tumors and can be of the juvenile or adult type [1]. Adult granulosa cell tumors are common among women in their fifties and are known for estrogen production, although about 30% of cases do not produce estradiol [2]. The major symptom of granulosa cell tumors is postmenopausal genital bleeding, which is attributed to estrogen production [3].
About 50% of granulosa cell tumors are accompanied by endometrial hyperplasia, and 10% by endometrial carcinoma [4]. Disease activity is reflected by serum levels of inhibin B and anti-Müllerian hormone, but not estrogen [56]. Adult granulosa cell tumors can be classified pathologically into several types, according to morphology, as diffuse, microfollicular, macrofollicular, insular, and corded to trabecular [1]. However, the current pathological classification does not associate with the clinical symptoms or the behavior of the neoplasm. Moreover, few studies have analyzed the pathology and clinical symptoms in relation to hormone production.
To address this issue, the present study investigated clinical or pathological variations in granulosa cell tumors and their relationship to the expression of sex steroid synthesis enzymes.
MATERIALS AND METHODS
1. Samples and patient information
Central pathology data was used to confirm the diagnosis of adult granulosa cell tumors in 30 patients who underwent surgery at Kyoto University Hospital, Kinki University Hospital, or Hiroshima City Asa Citizens Hospital between 2002 and 2014. The records of clinical symptoms and serum hormone levels were retrospectively reviewed. Pregnant cases were excluded from the study. Written, informed consent was obtained from each patient. The study protocol was approved by the ethics committees of all 3 institutions.
2. Immunohistochemistry
Formalin-fixed, paraffin-embedded tumor tissue sample blocks were cut into 4-µm sections and stained with hematoxylin and eosin, or used for immunohistochemistry by the streptavidin-biotin-peroxidase method with the following antibodies: monoclonal mouse anti-inhibin α (M3609; Dako, Carpinteria, CA, USA), anti-P450 aromatase (22PS, SM 22; Acris, San Diego, CA, USA), and rabbit polyclonal anti-P450 17α-hydroxylase (P450c17) (LS-B 6749; LSBio, Seattle, WA, USA).
3. Evaluation of specimens
The expression of inhibin α, P450c17, and P450 aromatase was evaluated according to the intensity of the staining and scored as follows: 0, negative; 1, weak; 2, strong. Testis tissue was probed as a positive control for inhibin α and P450c17, and a normal ovarian follicle for P450 aromatase.
RESULTS
Clinical information of the 30 patients is shown in Table 1 and Supplementary Table 1. The mean age was 50.2 years; 14 patients were under and 16 over 50 years of age (younger and older groups, respectively). Abnormal genital bleeding, mainly representing abnormal menstrual cycles, was reported by 78.0% of patients in the younger group. Abnormal genital bleeding, mainly as postmenopausal bleeding, was reported by 87.5% of patients in the older group. Of the 30 patients, 28 were in International Federation of Gynecology and Obstetrics (FIGO) stage I. There was no significant difference in prognosis between younger and older groups.
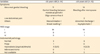
Table 1
Patients' profile of this study
![]()
A total of 16 patients underwent both salpingo-oophorectomy and hysterectomy. Three other patients underwent endometrial biopsy. Endometrial tissue specimens were available from a total of 19 patients. Two patients in the younger group had endometrial hyperplasia. Eight patients had endometrial hyperplasia and 1 had endometrioid adenocarcinoma in the older group.
Preoperative serum 17β-estradiol (E2) values were available for all 21 patients from the 2 institutions (Kyoto University Hospital and Kinki University Hospital) and not available for the other 9 patients form the other institution (Hiroshima Asa Citizens Hospital).
The values were greater than 30 pg/mL in 4 patients (36%) under 50 years of age and in 7 patients (64%) over 50 years of age. Serum E2 values tended to be higher in patients over 50 years of age than in those under 50 years of age (Table 2), though the difference was not statistically significant (p=0.081; Fisher's exact test). Serum follicle-stimulating hormone (FSH) values were low in all patients where it was measured, irrespective of age and serum E2 levels. Specifically, both serum E2 and FSH levels tended to be low in patients under 50 years of age, whereas those over 50 years of age tended to show high serum E2 and low FSH levels.
Table 2
Relationship of patients' age and serum E2 values

| Variables | <50 years old (n=14) | ≥50 years old (n=16) |
|---|---|---|
| E2<30 pg/mL | 8 | 2 |
| E2≥30 pg/mL | 4 | 7 |
![]()
To investigate the influence of estrogen on the endometrium, we compared endometrial thickness in magnetic resonance images from patients under and over 50 years of age. In the former group, the mean endometrial thickness was 4.0 mm, whereas a large uterus and significantly thicker endometrium (mean: 9.7 mm; p=0.013; Mann-Whitney test) were observed in the latter group despite the age of these patients (Fig. 1A and 1B).
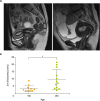 | Fig. 1Endometrial thickness. (A) Magnetic resonance imaging of representative cases (T2 weighted images, sagittal sections). Left: 34-year-old woman whose serum E2 level was 16.8 pg/mL with an endometrial thickness of 8.69 mm. Right: 71-year-old woman whose serum E2 level was 81.4 pg/mL with an endometrial thickness of 21.70 mm. (B) Differences in the endometrial thickness between patients under and over 50 years of age. Data are presented as mean±SD.
E2, 17β-estradiol; Em, endometrial; SD, standard deviation.
*p<0.05 (Mann-Whitney test).
|
Immunohistochemical analysis of the 30 cases revealed that inhibin α and P450 aromatase were expressed in tumor cells in a majority of cases regardless of patient age and serum E2 levels (Fig. 2, Supplementary Table 2). Strong P450c17 immunoreactivity was observed in luteinized cells with abundant eosinophilic cytoplasm, while some other tumor cells, as well as theca and fibroblast-like cells, were weakly positive (Fig. 3A). Luteinized cells were also strongly positive for inhibin α and P450 aromatase (Supplementary Fig. 1).
 | Fig. 2Inhibin α and P450 aromatase expression. Representative images of inhibin α and P450 aromatase expression as determined immunohistochemically.
H&E, hematoxylin and eosin staining (original magnification: ×40).
|
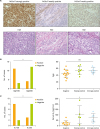 | Fig. 3Relationships between P450c17 expression and patient age and serum E2 levels. (A) Representative images of P450c17 expression. Samples are strongly positive (score 2) for P450c17 in luteinized cells (left upper), and weakly positive (score 1) for P450c17 in theca- or fibroblast-like cells (middle upper) and tumor cells (upper right), as determined by immunohistochemistry (original magnification: ×40). (B) Number of cases positive (score 1 or 2) or negative (score 0) for P450c17 among patients under and over 50 years of age (n=14 and 16, respectively). (C) Number of cases positive or negative for P450c17 among patients with serum E2 below or above 30 pg/mL (n=10 and 11, respectively).
E2, 17β-estradiol; H&E, hematoxylin and eosin staining; ns, not significant; P450c17, P450 17α-hydroxylase.
*p<0.05 (B, C: Fisher's exact test).
|
P450c17-positive (score 1 and 2) cases were more frequent in the older patient group than in the younger group (Fig. 3B; p=0.009; Fisher's exact test). The presence of P450c17-positive cells was significantly correlated to high E2 levels (>30) (Fig. 3C; p=0.030; Fisher's exact test). There was no significant difference in prognosis in terms of the serum E2 values.
DISCUSSION
This study is the most extensive immunohistochemical analysis to date of inhibin and hormone-synthesizing enzyme expression in adult granulosa cell tumors. Our review of 30 cases revealed that nearly all granulosa cell tumors were positive for inhibin α and P450 aromatase expression (Fig. 2, Supplementary Table 2). Inhibin is a heterodimer composed of α and β subunits. There are 2 types of the β subunit, A and B, that form inhibin A and B, respectively. One study found that the expression of inhibin B was elevated in about 90% of granulosa cell tumors in 30 patients aged 24 to 80 years [7]. Secondary amenorrhea seen in granulosa cell tumor cases may be caused by excessive production of inhibin B by the tumor [8]. Indeed, the pattern of hormonal expression in those cases resembled that of FSH deficiency (i.e., low FSH and high luteinizing hormone [LH] levels). Inhibin suppressed FSH production from the pituitary gland [9], resulting in irregular menstrual cycles in premenopausal cases of granulosa cell tumors. Although serum inhibin levels were not measured in any patients in the present study, 93% were immunohistochemically positive for inhibin α. Serum FSH levels were low irrespective of age and serum E2 level (Supplementary Table 2), indicating that inhibin production was a major feature of granulosa cell tumors and providing an explanation for the irregular menses, particularly oligo-amenorrhea, observed in the premenopausal patients.
Although granulosa cell tumors are known for E2 production, serum E2 levels were low in 33% of our cases. Interestingly, 67% of patients under 50 years of age showed low E2 levels (<30 pg/mL), whereas 78% of patients over 50 years of age showed higher levels (>30 pg/mL) (Table 2). This is contrary to normal women in whom the serum E2 level is high in the premenopausal state and low after menopause.
In this study, the effect of estrogen on the uterine endometrium was investigated by examining its thickness and histopathology. The magnetic resonance images revealed significant thickening of the endometrium in older patients (Fig. 1B), while the histopathological examination showed endometrial hyperplasia and endometrioid adenocarcinoma in many of these cases (Table 1). These results were consistent with the previous report that E2 levels were not elevated in about 30% of granulosa cell tumor patients [2] and that few granulosa cell tumors in patients under 40 years of age were accompanied by atypical endometrial hyperplasia or endometrioid adenocarcinoma [4]. Collectively, our data indicate that the estrogenic effect on the endometrium in postmenopausal women results in genital bleeding, and that negative feedback by estrogen or production of inhibin results in FSH suppression that is unusual for their age.
We examined the histopathological features of the tumors to explain the observed differences in serum E2 levels. The “2-cell, 2-gonadotropin theory” of normal ovarian follicles postulates that ovarian theca cells produce androgen that is converted by granulosa cells into estrogen [10]. In theca cells, cholesterol is first converted to pregnenolone by P450 cholesterol side-chain cleavage. The pregnenolone is then converted to androstenedione by 3β-dihydroxysteroid dehydrogenase and P450c17. Androstenedione moves into granulosa cells and is converted to estrone and estradiol by P450 aromatase. P450c17 is exclusively localized in theca cells [11]. Consequently, granulosa cells and theca cells are both critical for estrogen production.
The 2-cell, 2-gonadotropin theory has been applied to granulosa cell tumors. Many of these tumors have luteinized theca-like cells in the stroma, and these so-called theca reaction cases tend to show hormonal symptoms [12]. Typical granulosa tumor cells lack the ability to produce these hormones, whereas cells with a clear cytoplasm express steroid synthesis enzymes and are the source of hormones in granulosa cell tumors [11]. In the present study, luteinized cells were strongly positive, and other tumor cells and theca-like cells were weakly positive, for P450c17. Furthermore, P450c17-positive cases showed elevated serum E2 levels. Our data indicate that the expression of P450c17 regulates estrogen production in granulosa cell tumors and that the mechanism of hormone production in these tumors is similar to the 2-cell, 2-gonadotropin theory in normal ovaries.
Inhibin expressed by granulosa cell tumors suppresses FSH release from the pituitary gland and consequently, estrogen production from the normal ovary. P450c17 in luteinized and other cells synthesizes androgen, which is transformed into estradiol in granulosa and luteinized cells. Our data show that some tumors lacked P450c17-positive cells, resulting in low estrogen production probably due to the absence of androgen (Fig. 3B).
Overall, this study is the first to demonstrate the close relationship between serum E2 levels and P450c17 expression in granulosa cell tumors. Our results also revealed that granulosa cell tumors without P450c17-positive cells tended to arise in younger patients who consequently showed lower serum E2 levels than older patients. The reason why these tumors occur in younger women is unclear, and requires further investigation.
One of possible limitations of this study is the lack of data on FOXL2 mutation, which is identified in about 94%–97% in adult granulosa cell tumors. A specific point mutation (c.402C>G [C134W]) in the FOXL2 is likely to contribute to adult granulosa cell tumor development and a number of genes are known to be regulated by FOXL2, including p450 aromatase/CYP19A1 [1314]. Other limitations include the small sample size, lack of data on hormone synthesis for tissues other than tumors, and the fact that expression of steroidogenic enzymes does not necessarily reflect their activities. Nonetheless, this study characterized unique cellular functions and related symptoms in this rare tumor type.
In summary, we analyzed 30 cases of adult granulosa cell tumors, focusing on the relationship between the expression of hormone-synthesizing enzymes and clinical symptoms. Our data indicate that, in order to produce estrogen, not only granulosa cells expressing aromatase but also cells expressing androgen-synthesizing enzymes are necessary. Granulosa cell tumors lacking the latter cell types occur in relatively young women, and lack estrogenic manifestations. Granulosa cell tumors comprised of both cell types tend to occur in older women, and clinicians should pay attention to possible endometrial malignancy in these cases. Thus, dividing granulosa cell tumors into 2 types by the presence or absence of cells expressing androgen-synthesizing enzymes may help improve our understanding of the features of this rare tumor.
 XML Download